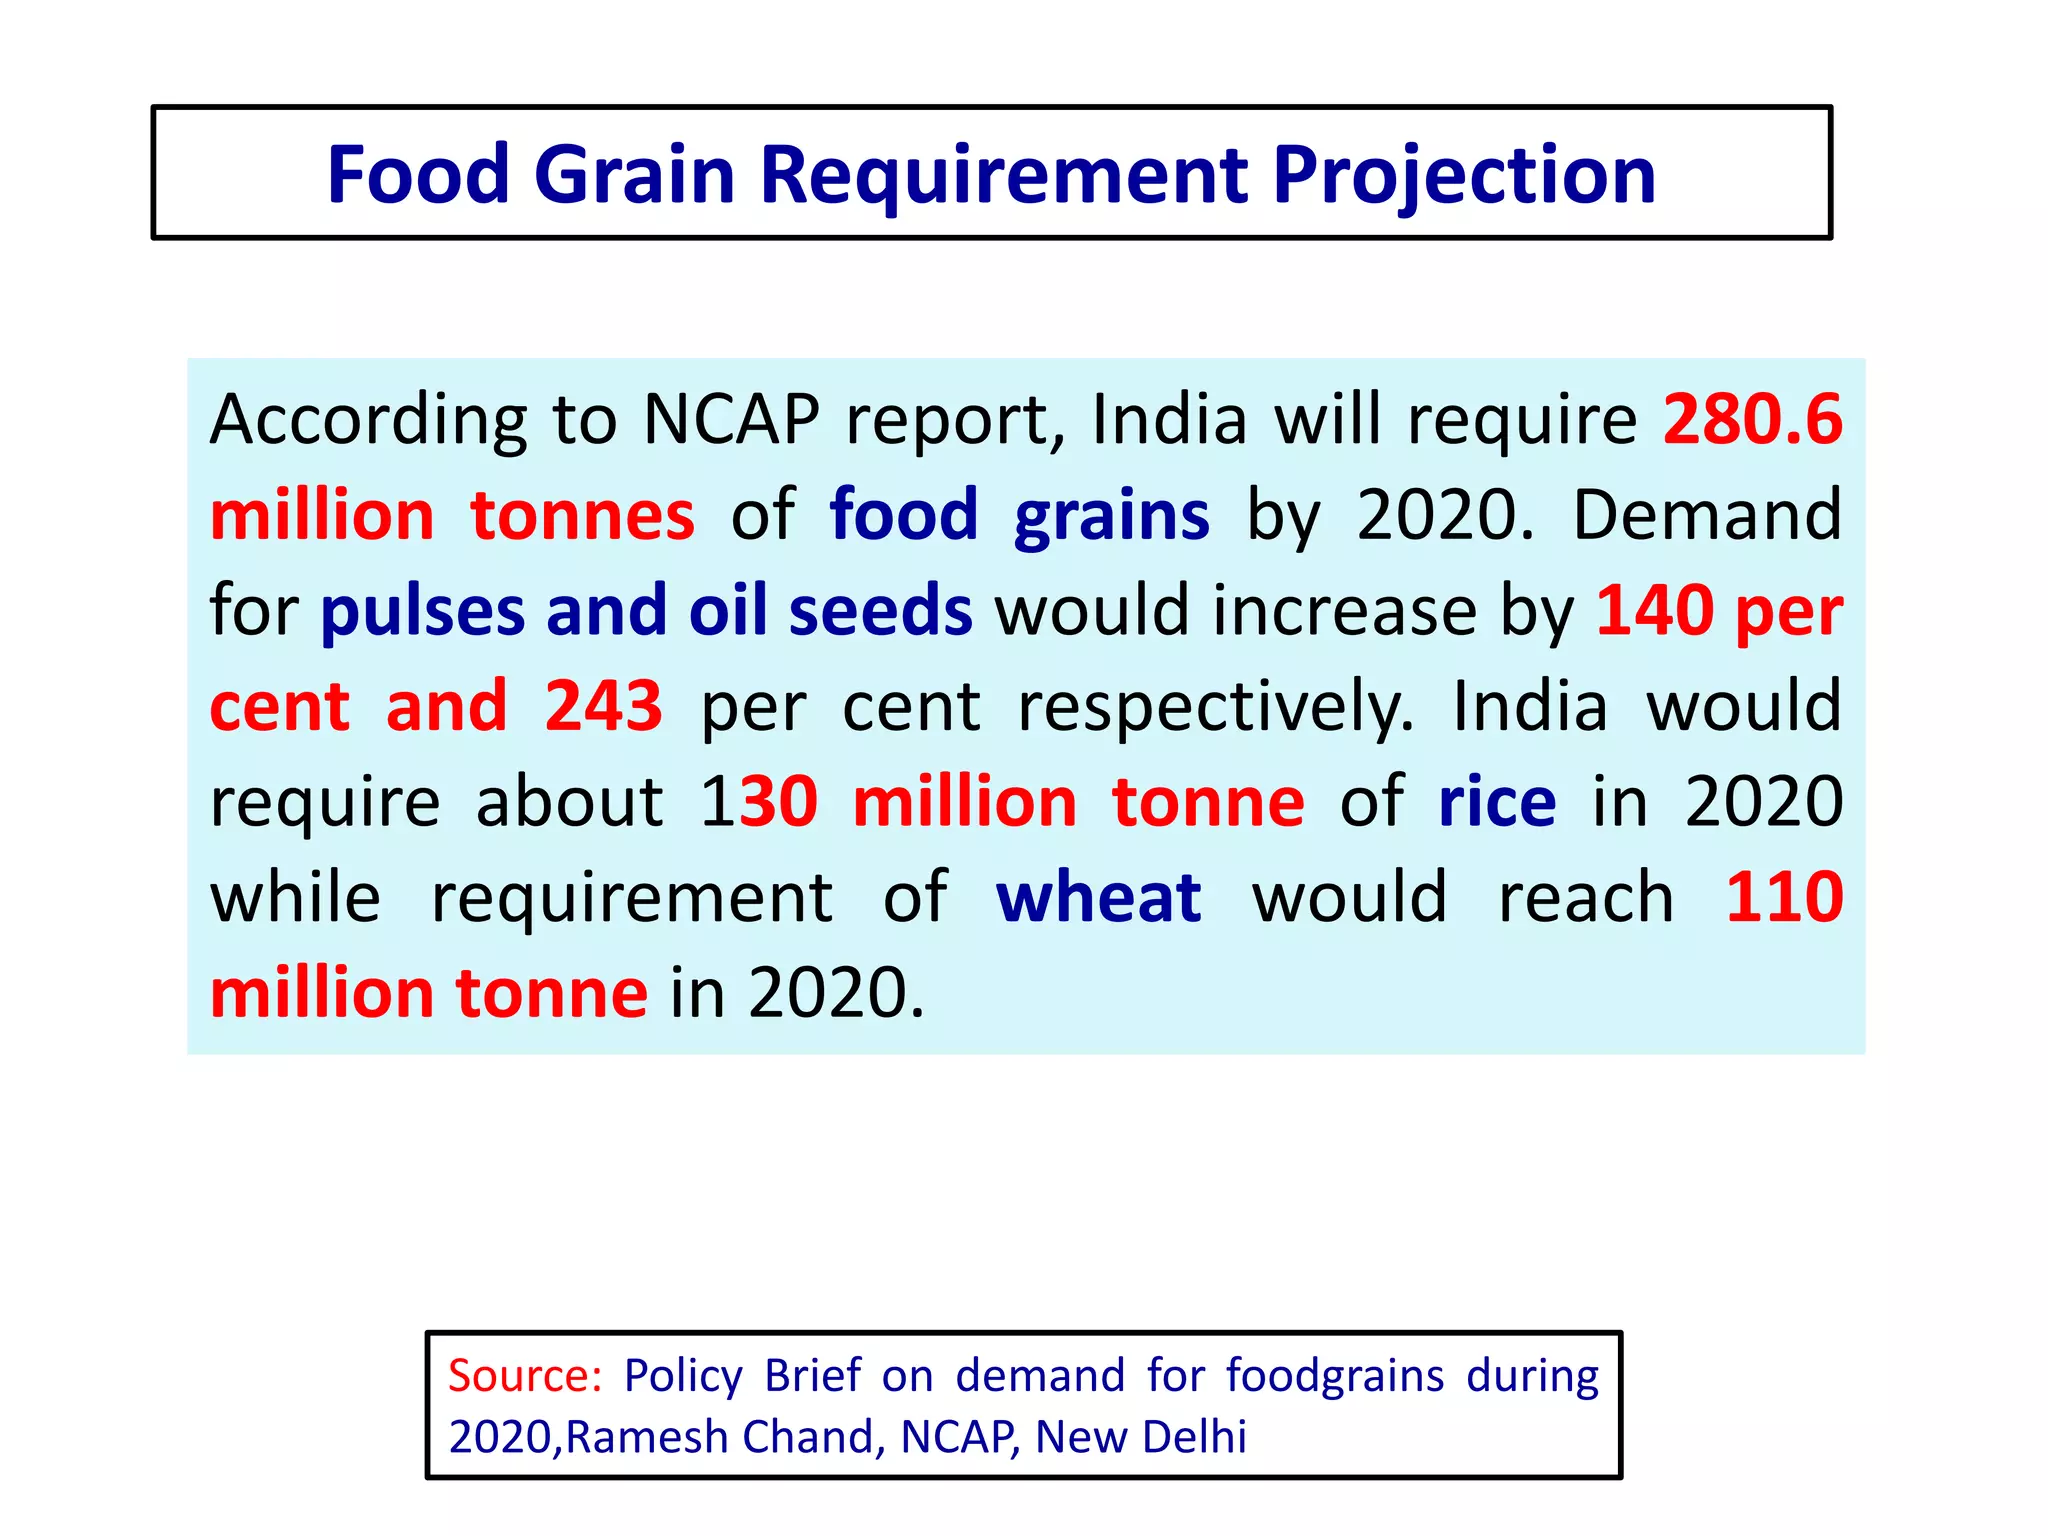
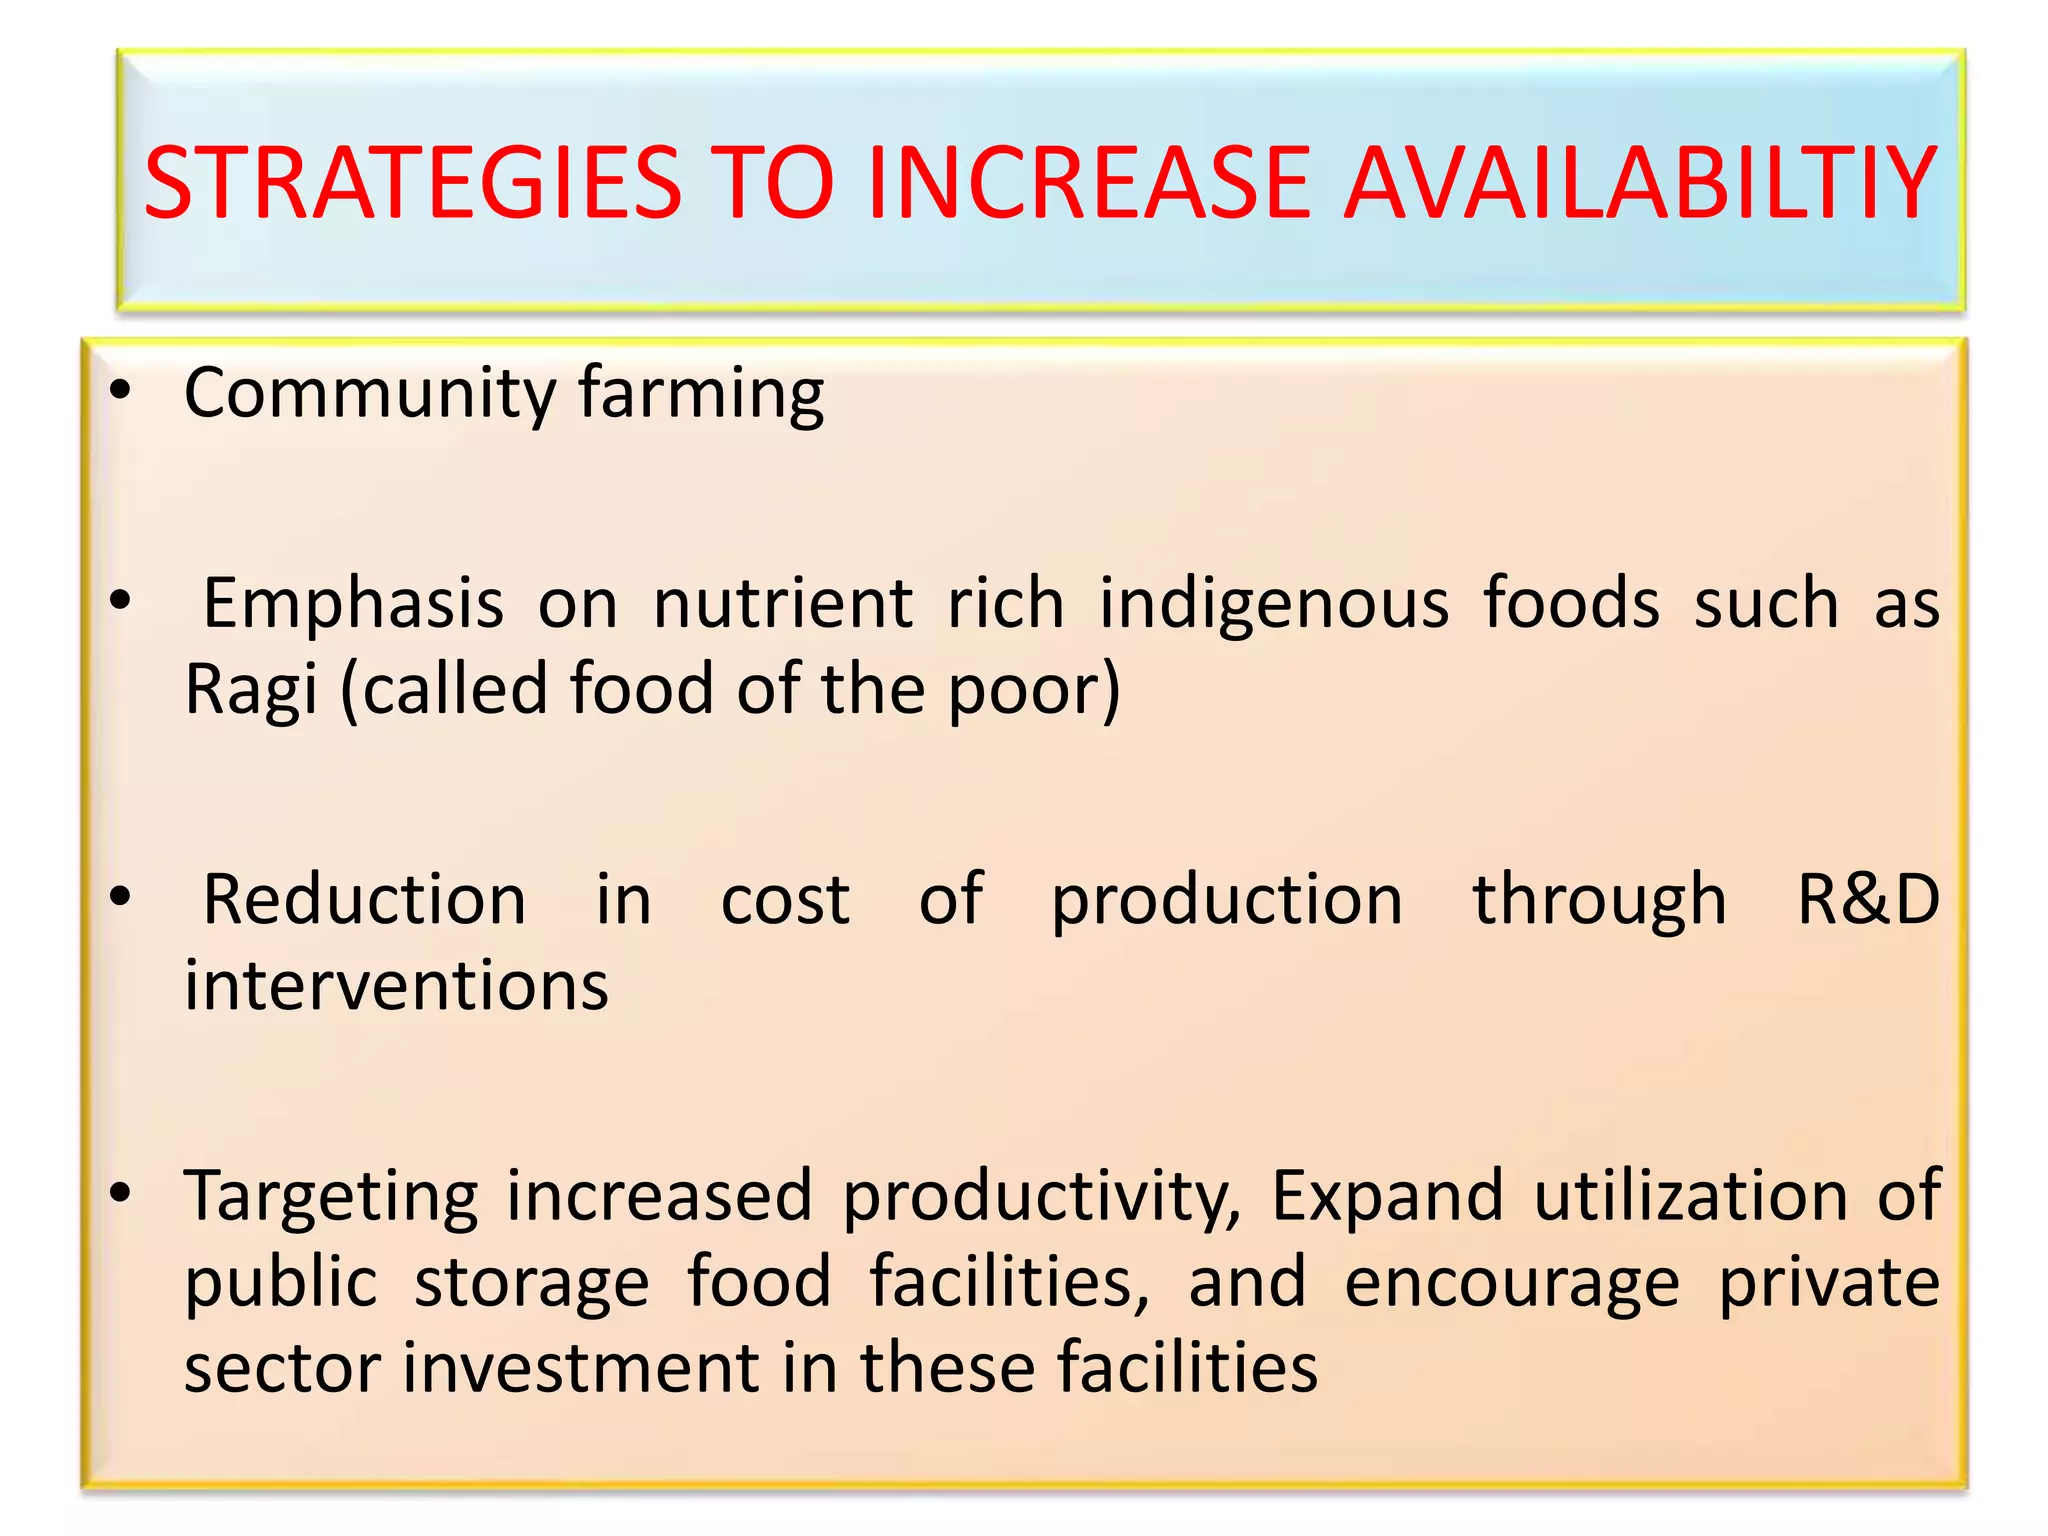
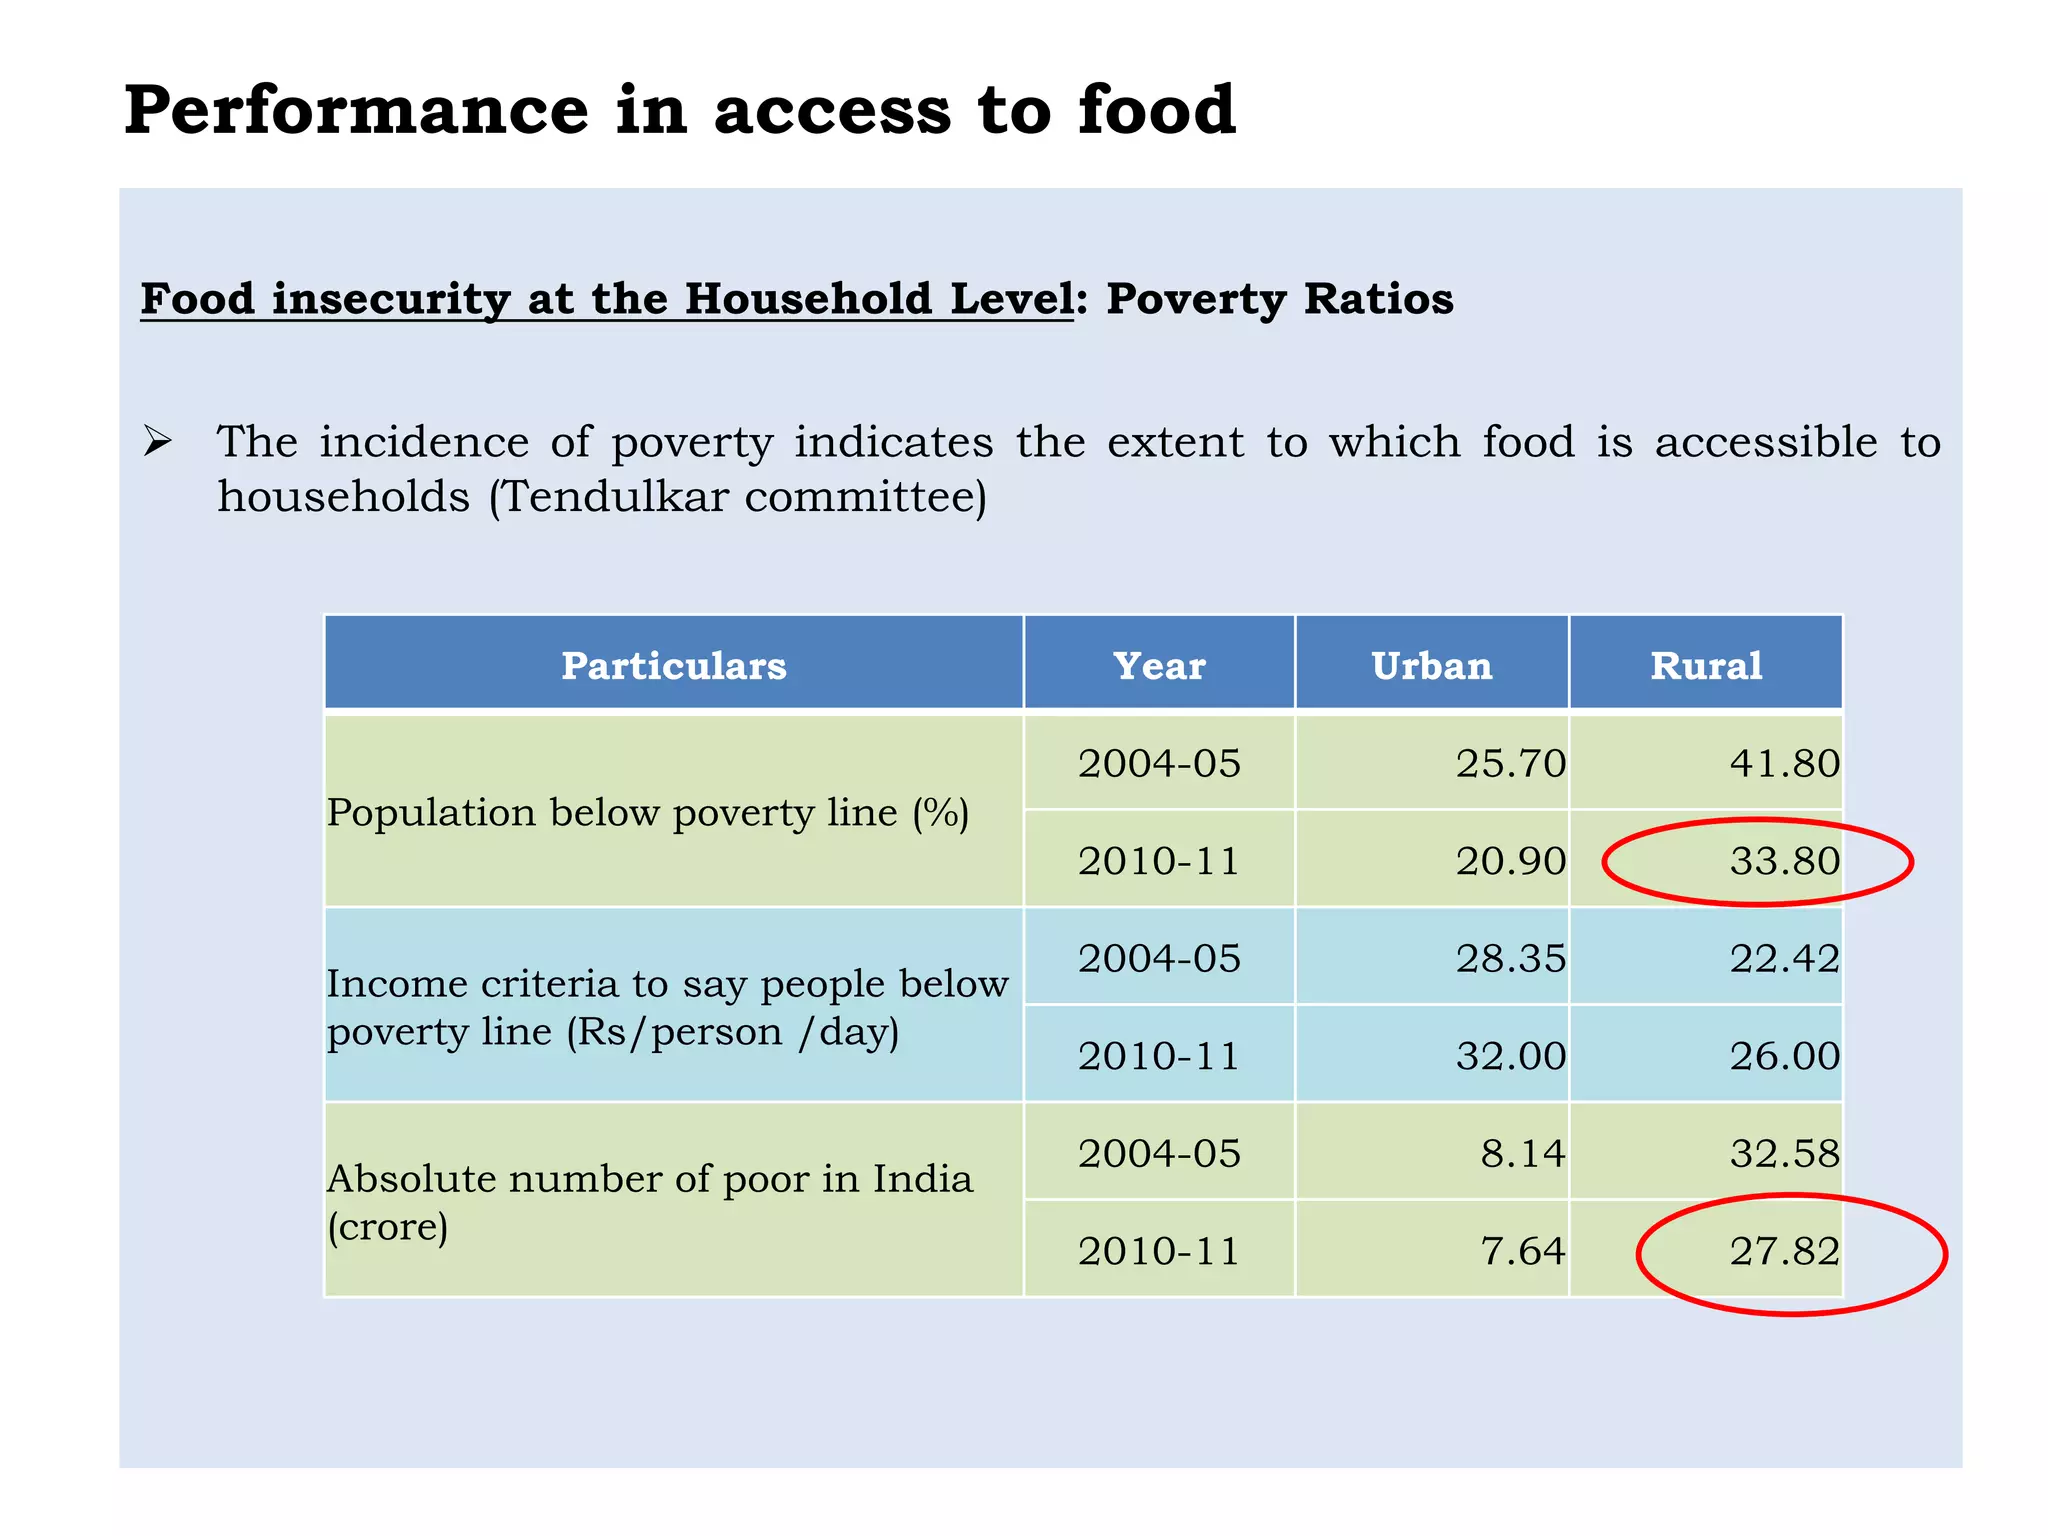
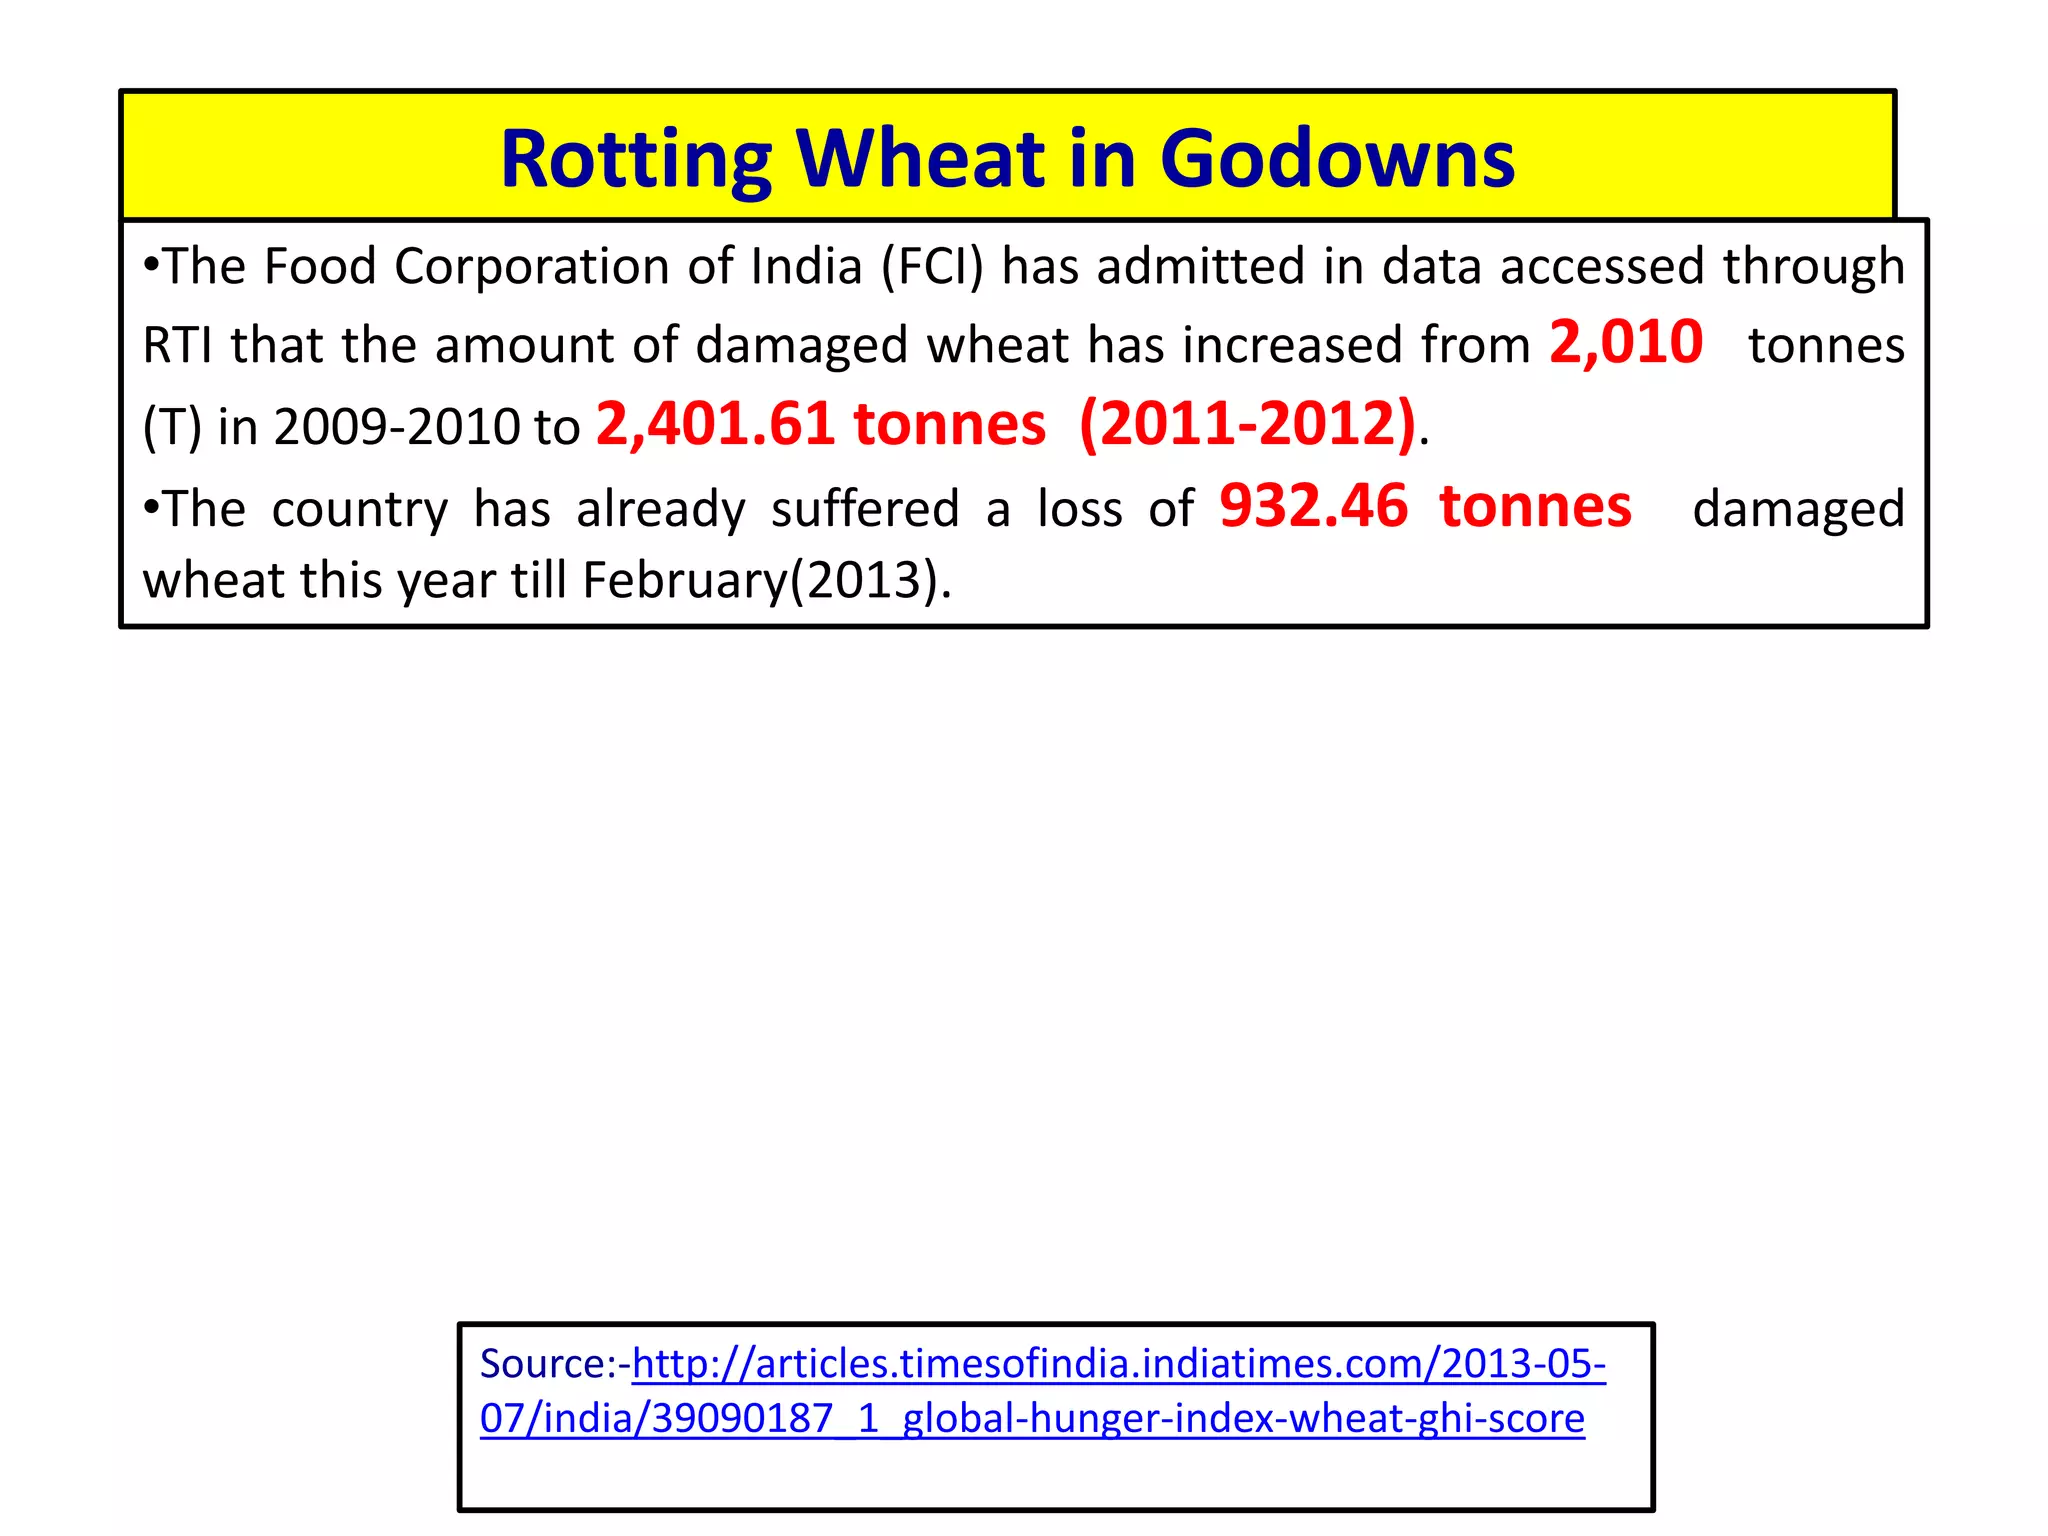
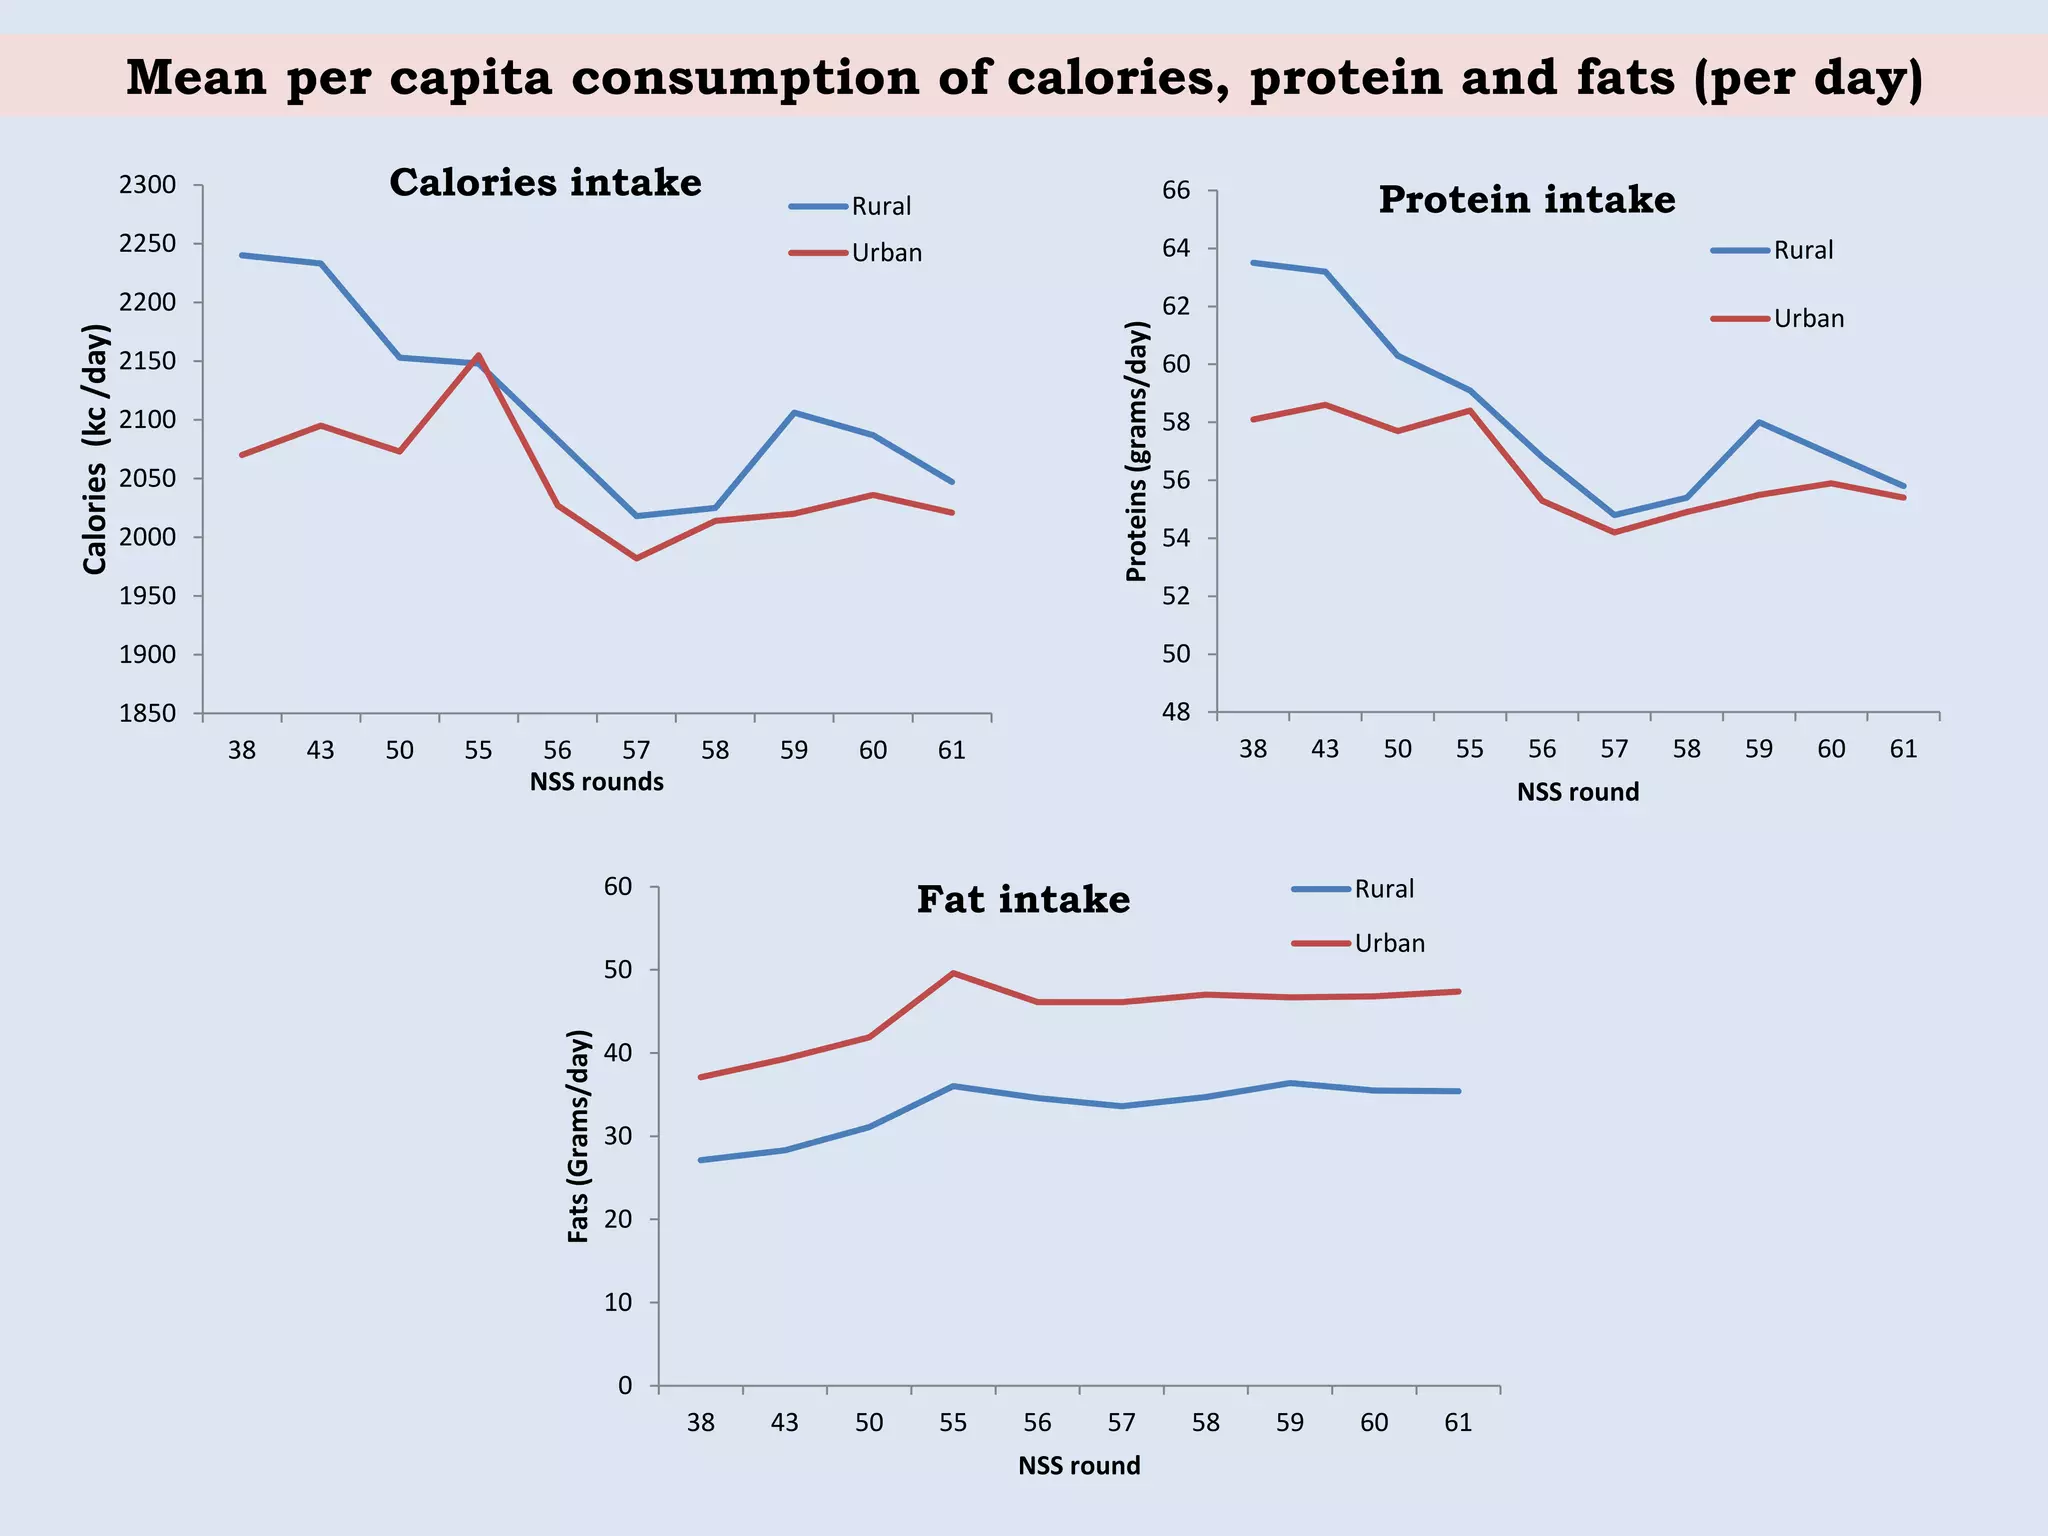
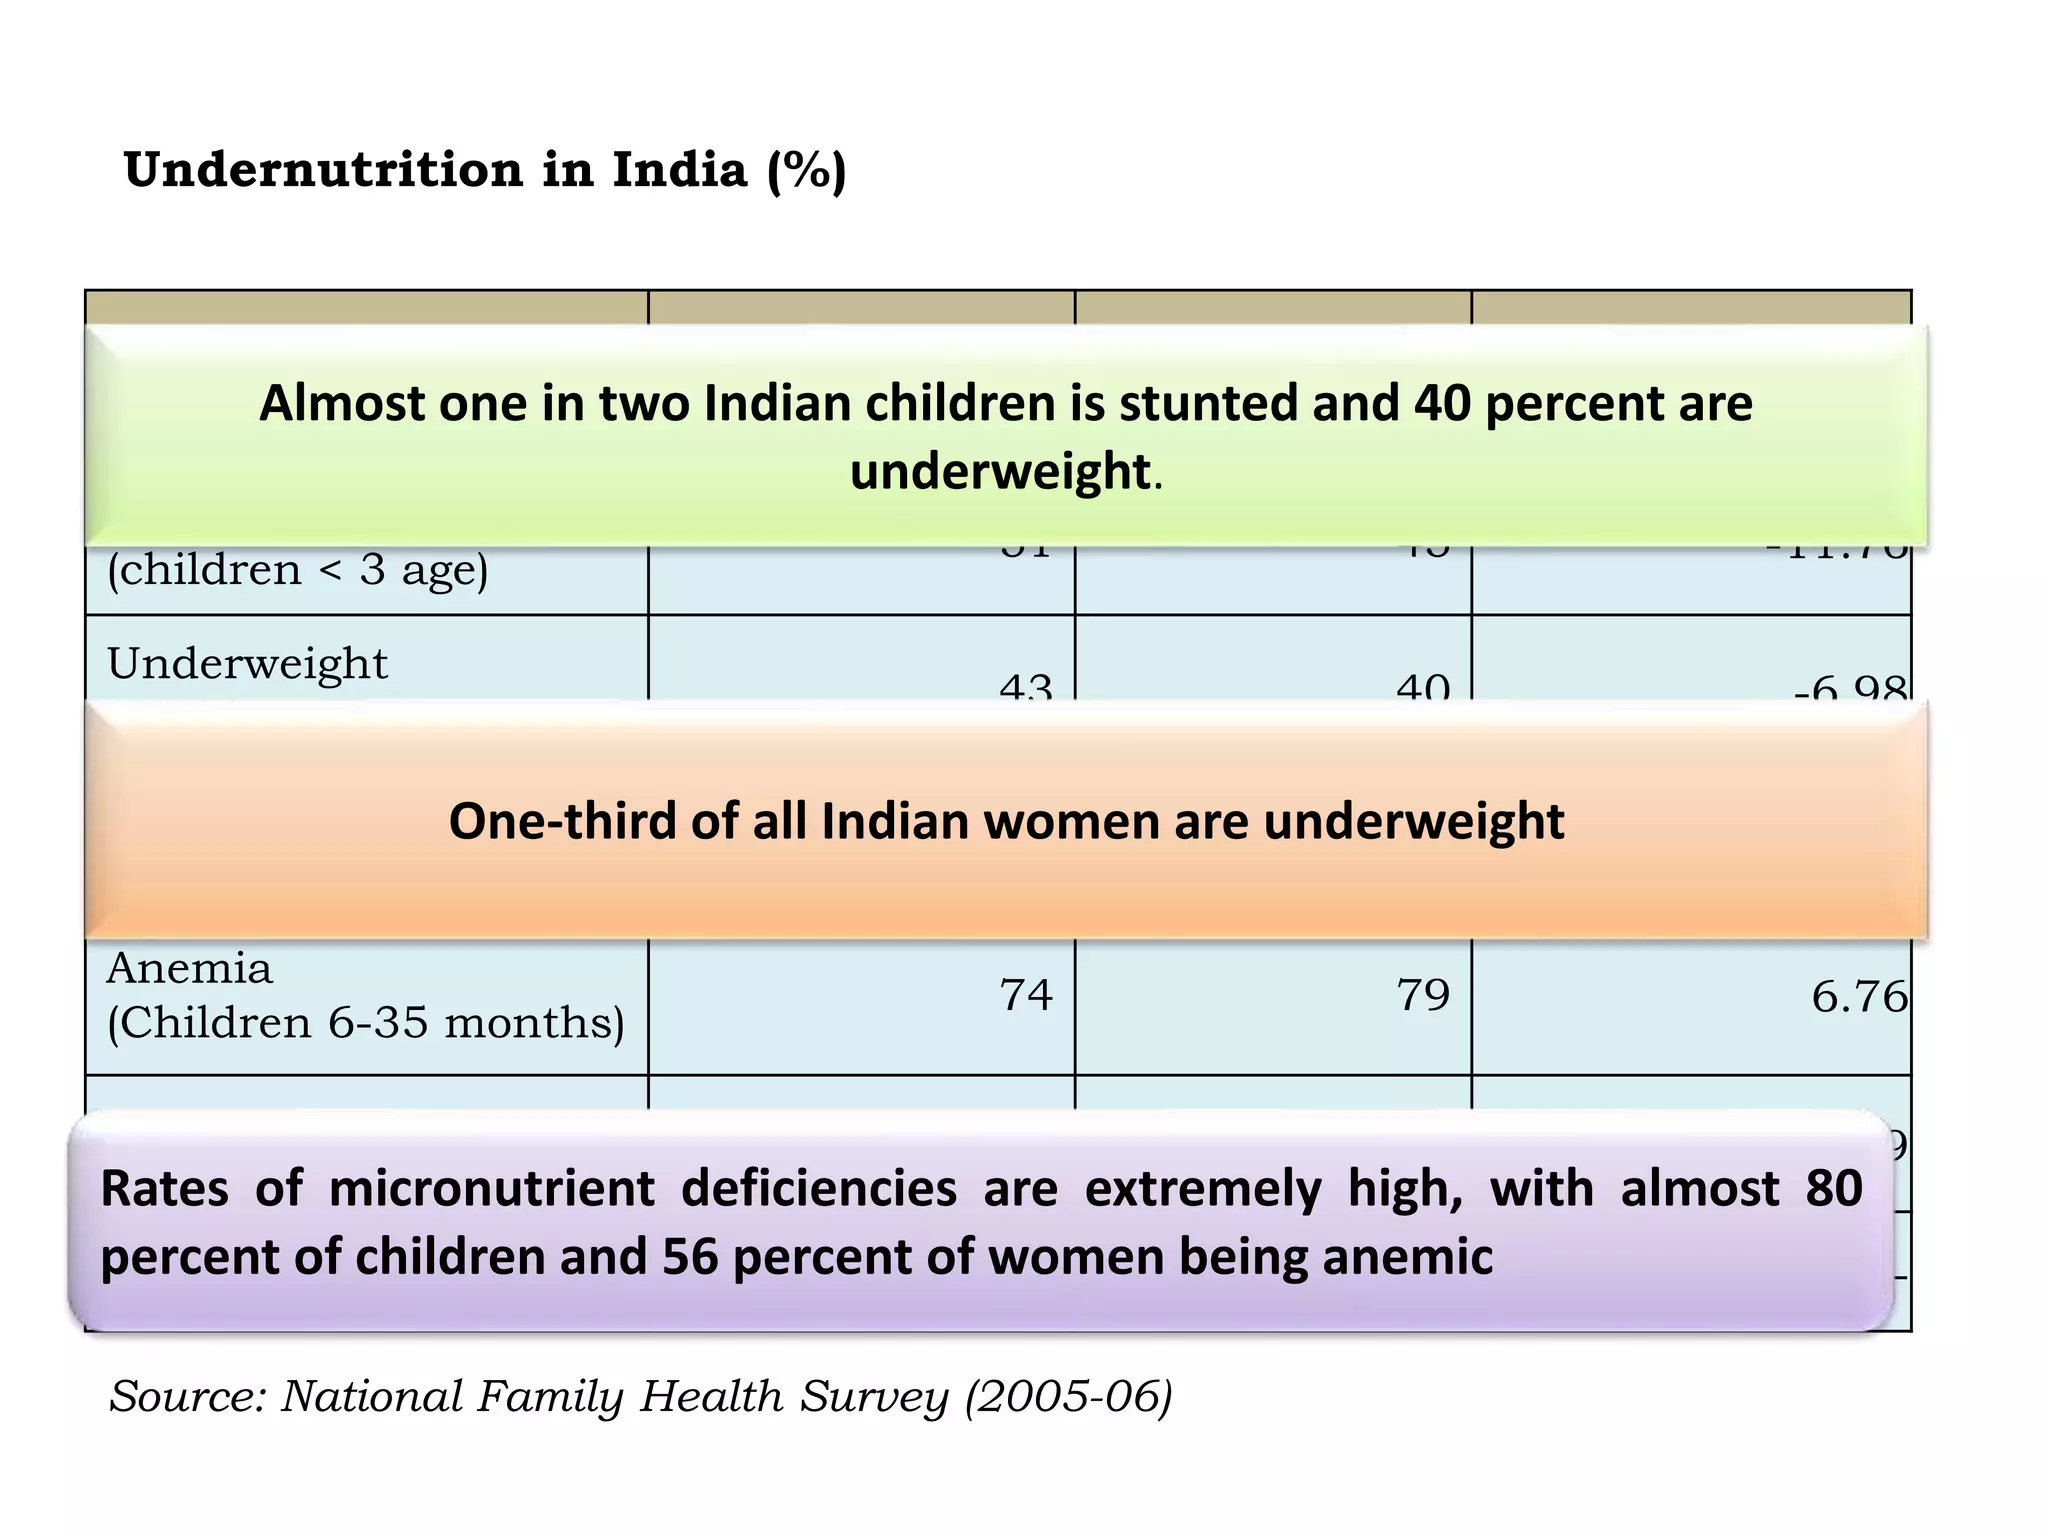
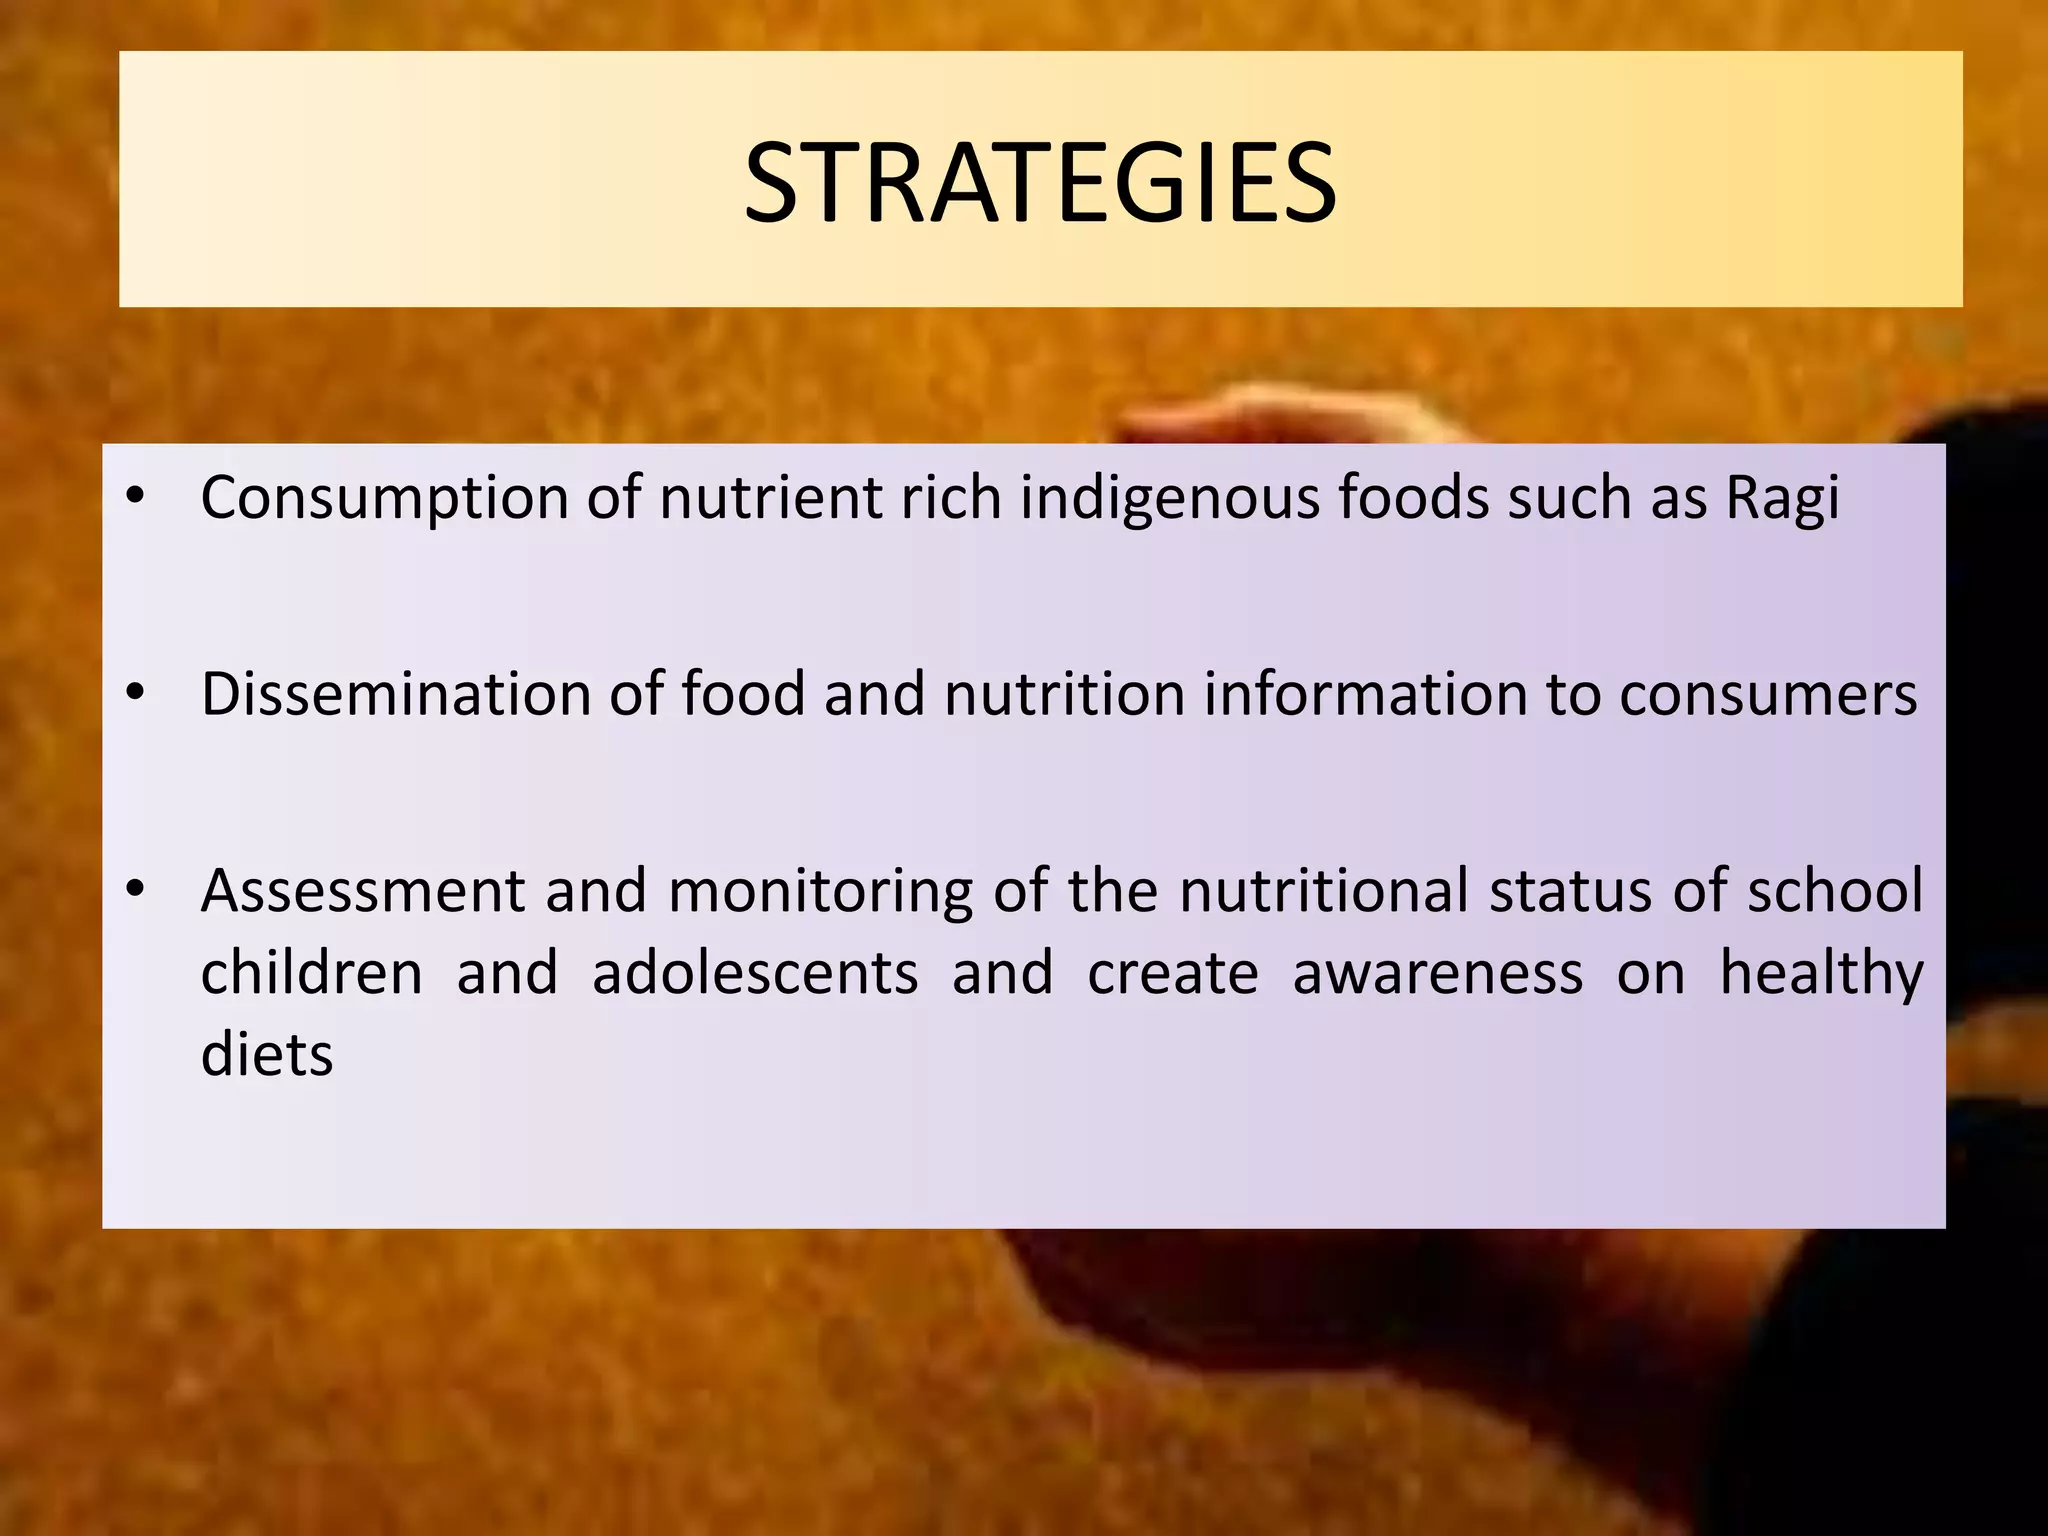
SlideShare a Scribd company logo
“Nothing is more degrading than hunger,
especially when man made.”
Ban Ki Moon, United Nations Secretary
General
Food and nutritional security in India:
Performance and Challenges
Presented by :
JAGRITI ROHIT
Roll No: 10242
According to FAO, 1996 “food security exists when all people,
at all times, have physical and economic access to sufficient,
safe and nutritious food to meet their dietary needs and food
preferences for an active and healthy life”
Physical and
economic
Availability
to food
Physical
and
economic
access to
food
Food
Utilization
Stability of
the other 3
dimensions
over time
dimensions
SWAMINATHAN (1986) has stressed the need for shifting to the
concept of ‘Nutrition Security’, which he has defined as
“physical, economic and social access to balanced diet, clean
drinking water, environmental hygiene, primary health care and
nutritional literacy”
Poverty
HungerMalnutrition
29.5% of the India population lives below the poverty line (FAO)
210 MILLION OF WORLD HUNGRY PEOPLE ARE IN INDIA. (FAO)
42.3 per cent children under the age of five years are underweight, 58.8 per
cent are stunted and 11.4 per cent are “wasted”. (FAO)
Food insecurity
Global losses in economic
productivity due to
undernutrition and
micronutrient deficiencies
have been estimated at more
than 10 percent of lifetime
earnings and 2–3 percent of
global gross domestic product
(GdP) (World bank, 2006a)
Reason for global food crisis
Food security at the national level refers to
availability in the country of sufficient stocks
of food to meet domestic demand through
domestic supply or imports
Crop 2011-12 2012-13
Rice 105.31 104.22
Wheat 94.88 93.62
Coarse cereals 42.04 39.52
Total cereals 242.23 237.3618
Pulses 17.09 18.00
Total food grains 259.32 255.36
Oilseeds 29.79 30.72
Sugar 24.60 26.00
Vegetables 156.325 156.445
Fruits 76.42 79.40
Milk 127.9 133.7
Source:-RBI Hand Book on India Economy 2011-12
(million tonnes)
Physical Availability of Food
Growth in production and yields of food grains, fruits and vegetables (%)
Rice Wheat
Coarse
Cereals
Pulses
Total food
grains
Fruits Vegetables
Production
1950s 4.46 5.17 3.66 4.10 4.24 NA NA
1960s 1.19 6.82 1.51 -1.29 1.85 NA NA
1970s 1.90 4.31 1.11 -0.39 2.07 NA NA
1980s 3.62 3.58 0.35 1.49 2.73 NA NA
1990s 2.02 3.57 -0.01 0.86 2.10 5.25 5.15
2000s 2.16 1.78 3.46 3.00 2.29 6.48 5.53
Overall 2.59 4.78 1.00 0.59 2.50 4.27 4.41
Productivity
1950s 3.15 1.08 2.33 0.94 2.26 NA NA
1960s 3.36 4.46 0.91 0.03 1.32 NA NA
1970s 1.01 1.87 2.00 -0.98 1.60 NA NA
1980s 3.19 3.10 1.71 1.59 2.97 NA NA
1990s 1.34 1.82 2.14 1.27 2.17 1.83 3.26
2000s 1.62 0.80 3.59 1.96 1.69 0.55 1.57
Overall 1.90 2.82 1.90 0.41 2.23 -0.09 1.67
0
200,000,000
400,000,000
600,000,000
800,000,000
1,000,000,000
1,200,000,000
0.00
50.00
100.00
150.00
200.00
250.00
300.00
1960-61 1970-71 1980-81 1990-91 2000-01 2010-11
Numbers
(inmillliontonne) Population vs Food
Food grain
Rice
Wheat
Pulses
Population
Source: Economic Survey, 2011-12
Production of major livestock products
0
20
40
60
80
100
120
140
Milk (million tonne)
Egg ('000 million no.)
Fish ('00 thousand tonne)
Products CGR (%)
Milk 4.11
Fish 5.77
Egg 3.44
 Scope for increase in net sown area is limited
 Land degradation in the form of depletion of soil fertility and erosion
 Exposure of domestic agriculture to international competition has
resulted in a high price volatility
 Steeper decline in per capita agricultural land availability
 Shrinking of farm size
 Land issues such as SEZs, land going to non-agriculture
Factors responsible for stagnating growth
Per capita availability of foodgrains
• Net availability declined if we compare till 1997 with 2010
• Increase in foodgrains production has not been able to keep pace
with the increase in population.
• 2010, per capita availability of foodgrains was only 439
grams/day - much lower than 510 grams/day in 1991
• Pulses - from1951 to 2010, per capita availability of has declined
significantly
• Per capita availability of sugar and edible oils has increased over
time
15
Year Cereal Pulses Total
1950-51 334.2 60.7 394.9
1960-61 399.7 69.0 468.7
1970-71 417.6 51.2 468.8
1980-81 417.3 37.5 454.8
1990-91 468.5 41.6 510.1
2000-01 366.2 30.0 416.2
2005-06 390.9 31.5 422.4
2006-07 412.1 32.5 444.5
2007-08 407.4 32.5 442.8
2008-09 374.6 41.8 436.0
2009-10 407.0 37.0 444.0
2010-11 407.0 31.6 438.6
Source: Indian Economy,Gaurav Datt and Ashwani Mahajan,2013
(in gram)
Per capita Net Availability Per Day
16
Commodity Per capita availability Minimum per capita
requirement
Total cereals 528.70 400
Pulses 46.78 80
Total food grains 568.79 480
Oil 39.73 30
Sugar 54.79 20
Vegetables 348.47 300
Fruits 176.86 150
Milk 297.81 300
Source:-National Institute of Nutrition, Hyderabad
(in gram per day)
Per capita availability, 2012-13
NSS round 43th 50th 55th 61st 62nd 63rd 64th
Year 1987-88 1993-94 1999-00 2004-05 2005-06 2006-07 2007-08
RURAL
Cereals 26.14 23.8 22.16 17.38 17.02 16.51 16.07
Gram 0.24 0.17 0.13 0.13 0.15 0.17 0.15
Edible oil 4.98 4.37 3.74 4.44 4.08 3.92 4.31
Milk & milk products 8.62 9.33 8.75 8.17 8.16 8.09 7.79
Egg, fish and meat 3.23 3.29 3.32 3.21 3.89 3.5 3.41
Vegetables 5.21 5.94 6.17 5.88 6.07 6.19 6.28
Fruits & nuts 1.63 1.71 1.72 1.8 1.88 1.79 1.76
URBAN
Cereals 14.79 13.85 12.35 9.58 9.38 9.05 8.88
Gram 0.16 0.17 0.11 0.1 0.11 0.13 0.12
Edible oil 5.29 4.33 3.14 3.29 2.99 2.86 3.16
Milk & milk products 9.54 9.67 8.68 7.54 7.26 7.43 7.25
Egg, fish and meat 3.54 3.34 3.13 2.58 2.76 2.61 2.68
Vegetables 5.25 5.38 5.13 4.24 4.25 4.33 4.37
Fruits & nuts 2.51 2.63 2.42 2.14 2.18 2.13 2.11
Source: Household consumption expenditure in India, 2007-08, NSSO, Government of India
Table 5: Share of different food items in per capita expenditure over NSS rounds (%)
Changes in consumption patterns
Share of different food items in per capita expenditure of consumer (%)
0
5
10
15
20
25
30
35
43th 50th 55th 61st 62nd 63rd 64th
Percentage
NSSO rounds
0
5
10
15
20
25
43th 50th 55th 61st 62nd 63rd 64th
Percentage
NSSO rounds
0
10
20
30
43th 50th 55th 61st 62nd 63rd 64th
Percentage
NSSO rounds
Cereals, grams and edible oil
Milk, fish, egg and meat
Vegetables, nuts and fruits
Rural
Urban
According to NCAP report, India will require 280.6
million tonnes of food grains by 2020. Demand
for pulses and oil seeds would increase by 140 per
cent and 243 per cent respectively. India would
require about 130 million tonne of rice in 2020
while requirement of wheat would reach 110
million tonne in 2020.
Food Grain Requirement Projection
Source: Policy Brief on demand for foodgrains during
2020,Ramesh Chand, NCAP, New Delhi
Projected Scenario of 2030
ICAR Vision Document 2030
Strategies to increase food production
• Defending the gains
conservation farming . ‘National Biosecurity System’ ,
“bright spots” and “hot spots” , Good Weather Code
• Extending the gains
Indo-Gangetic plains , ‘Ganges Water Machine’
• Making new gains
• post-harvest technology, agro-processing and value
addition to primary produce
STRATEGIES TO INCREASE AVAILABILTIY
• Community farming
• Emphasis on nutrient rich indigenous foods such as
Ragi (called food of the poor)
• Reduction in cost of production through R&D
interventions
• Targeting increased productivity, Expand utilization of
public storage food facilities, and encourage private
sector investment in these facilities
PERFORMANCE IN ACCESS TO FOOD AND
NUTRITION
PERFORMANCE IN ACCESS TO FOOD AND NUTRITION
 Individual level: food security means that all members of the
society have access to the food
 Own production
 The market
 The government’s transfer mechanism
 Two ways to ensuring the adequate purchasing power
1. Employment
2. Increase incomes and subsidize food through social
protection programmes
Employment Growth
Employment  Income  Purchasing power  Access  Consumption
Growth rates of employment: 1983 to 1994 and 1994 to 2005 (%)
Male Female Total
Rural
1983-1994 1.96 1.40 1.77
1994-2005 1.41 1.55 1.46
Urban
1983-1994 3.15 3.37 3.26
1994-2005 3.10 3.08 3.09
Total
1983-1994 2.25 1.65 2.08
1994-2005 1.87 1.78 1.84
Performance in terms of access to food
Source: Dev and Sharma (2010)
Performance in access to food
Food insecurity at the Household Level: Poverty Ratios
 The incidence of poverty indicates the extent to which food is accessible to
households (Tendulkar committee)
Particulars Year Urban Rural
Population below poverty line (%)
2004-05 25.70 41.80
2010-11 20.90 33.80
Income criteria to say people below
poverty line (Rs/person /day)
2004-05 28.35 22.42
2010-11 32.00 26.00
Absolute number of poor in India
(crore)
2004-05 8.14 32.58
2010-11 7.64 27.82
2004-05 2007-08
Rural Urban Total Rural Urban Total
Tamil Nadu 80.0 49.8 65.2 87.8 65.7 76.4
Andhra Pradesh 62.5 31.6 54.0 81.1 41.8 70.2
Himachal Pradesh 52.0 15.1 46.6 69.1 41.6 65.4
Kerala 39.3 28.6 36.5 58.6 42.4 54.2
Karnataka 59.8 21.8 45.4 58.6 15.9 42.4
Jammu and Kashmir 33.6 47.3 37.5 37.5 50.2 41.0
Chattisgarh 24.4 14.2 22.1 46.8 18.7 40.2
Orissa 21.6 6.7 19.1 36.1 16.7 32.5
Uttarakhand 26.4 3.0 19.5 35.1 16.8 29.9
Madhya Pradesh 23.8 11.6 20.4 30.2 16.6 26.3
Maharashtra 30.5 7.9 20.3 34.6 6.2 21.4
West Bengal 15.1 6.6 12.4 25.8 9.5 20.7
Gujarat 32.6 7.9 23.0 26.7 6.9 18.2
Assam 9.2 2.5 8.0 20.2 1.8 17.0
Uttara Pradesh 6.5 3.0 5.7 18.3 5.5 15.4
Rajasthana 12.8 2.0 10.0 11.4 8.9 10.8
Haryana 4.1 5.3 4.5 12.1 5.0 9.7
Punjab 0.3 0.7 0.5 9.3 4.3 7.3
Jharkhand 5.9 3.4 5.3 8.2 1.7 6.5
Bihar 2.0 1.8 1.9 3.0 2.6 3.0
All India 26.6 14.7 23.0 35.0 19.4 30.1
Proportion of households reporting grain purchase from PDS (%)
Source: Himamshu and Sen (2011)
Food security at the Household Level: PDS
Proportion of households reporting grain purchase from PDS (%)
0.0
10.0
20.0
30.0
40.0
50.0
60.0
70.0
80.0
90.0
100.0
Rural Urban
0.0
10.0
20.0
30.0
40.0
50.0
60.0
70.0
80.0
90.0
2004-05 2007-08
Rotting Wheat in Godowns
Source:-http://articles.timesofindia.indiatimes.com/2013-05-
07/india/39090187_1_global-hunger-index-wheat-ghi-score
•The Food Corporation of India (FCI) has admitted in data accessed through
RTI that the amount of damaged wheat has increased from 2,010 tonnes
(T) in 2009-2010 to 2,401.61 tonnes (2011-2012).
•The country has already suffered a loss of 932.46 tonnes damaged
wheat this year till February(2013).
STRATEGIES
• Shorten the Supply Chain
• Farmer-friendly Marketing and Processing –
Producers Owned Companies
Value addition near to production
• Non-farm Interventions
• Strengthen the management and distribution of the food
reserves through PPP
• Food Safety Net
• Innovative adoption of Food Coupons,
Food Stamps, Food Credit Cards
Direct Cash Transfer
Absorption/nutrition
Calories(kc) Protein (gms) Fats (gms)
Year NSSO Round Rural Urban Rural Urban Rural Urban
1983 38 2,240 2,070 63.5 58.1 27.1 37.1
1987-88 43 2,233 2,095 63.2 58.6 28.3 39.3
1993-94 50 2,153 2,073 60.3 57.7 31.1 41.9
1999-2000 55 2,148 2,155 59.1 58.4 36.0 49.6
2000-01 56 2,083 2,027 56.8 55.3 34.6 46.1
2001-02 57 2,018 1,982 54.8 54.2 33.6 46.1
2002 58 2,025 2,014 55.4 54.9 34.7 47.0
2003 59 2,106 2,020 58.0 55.5 36.4 46.7
2004 60 2,087 2,036 56.9 55.9 35.5 46.8
2004-05 61 2,047 2,021 55.8 55.4 35.4 47.4
Source: Deaton and Dreze (2009)
Mean per capita consumption of calories, protein and fats (per day)
Performance in terms of nutrition indicators
1850
1900
1950
2000
2050
2100
2150
2200
2250
2300
38 43 50 55 56 57 58 59 60 61
Calories(kc/day)
NSS rounds
Calories intake Rural
Urban
48
50
52
54
56
58
60
62
64
66
38 43 50 55 56 57 58 59 60 61
Proteins(grams/day)
NSS round
Protein intake
Rural
Urban
0
10
20
30
40
50
60
38 43 50 55 56 57 58 59 60 61
Fats(Grams/day)
NSS round
Fat intake Rural
Urban
Mean per capita consumption of calories, protein and fats (per day)
Undernutrition in India (%)
Nutrition indicators
NFHS I
(1998-99)
NFHS II
(2005-06)
Per cent change
Stunting
(children < 3 age)
51 45 -11.76
Underweight
(Children < 3 age)
43 40 -6.98
Vitamin A deficiency
(Children < 5 age)
NA 57 ---
Anemia
(Children 6-35 months)
74 79 6.76
Women with Anemia 52 56 7.69
Men with Anemia --- 24 ---
Source: National Family Health Survey (2005-06)
Almost one in two Indian children is stunted and 40 percent are
underweight.
One-third of all Indian women are underweight
Rates of micronutrient deficiencies are extremely high, with almost 80
percent of children and 56 percent of women being anemic
• Consumption of nutrient rich indigenous foods such as Ragi
• Dissemination of food and nutrition information to consumers
• Assessment and monitoring of the nutritional status of school
children and adolescents and create awareness on healthy
diets
STRATEGIES
AGRICULTURE TO
IMPROVE NUTRITION SECURITY?
Leveraging Existing Platforms
Improving Economic and Physical Access to High-
Quality, Nutrient-Rich Diets
Improve access to nutrient-rich foods
Biofortification of staple crops
Leveraging Agriculture to Empower Women and
Strengthen Their Capacity to Care for Themselves
and Young Children
COMPARISON BETWEEN INDIA AND
BRAZIL
Three main policy pillar
• Bolsa Família
• Alimentação Escolar
• The Fortalecimento da Agricultura Familiar
SUCCESSFUL EXAMPLES
In 2009 it was estimated that 20 million Brazilians climbed out of poverty
following the implementation of this policy.
There were 15.4% of Brazilians living in poverty in 2009, compared to 27.8% in
1999. The country has thus attained the Millennium Development Goal of
halving poverty.
Food security has improved overall: in 2009, 30.2% of households were food
insecure (34.8% in 2004). Early childhood malnutrition fell by 61% between
2003 and 2009
LESSONS FROM BRAZIL
• Decentralize purchasing
• Procurement of coarse cereals and millets
• Convergence of social protection schemes with national
flagship programme.
• A unified database similar to the Cadastro Único to promote
effective and standardized targeting across schemes
• India can start an in-depth study of the mechanisms of cash
transfers, and pilot the program in willing, better connected
areas
Government strategies
Availability
Production
Access
Affordability
•Food reserve and stocks (>80 million ton)
•500 thousand fair price shops
•Mahatma Gandhi National Rural Employment
Guarantee Program
•Direct Cash Transfer
•Subsidized food to people BPL
•Food Security act (Right to Food)
•Food Security Mission
• RKVY
•Subsidy in fertilizer and irrigation
•MSP and assured procurement
23-Aug-17 44
National Food Security Mission
•NFSM was launched in Aug,2007 by GOI with an aim of
achieving an additional production of 10,8 and 2
million tonnes of paddy, wheat and pulses respectively
by the end of 2011-12.
•A sum of Rs. 3381 crore has been spent till 31March,
2011.
Economic survey, 2013
Mid Day Meal Scheme
•100 million school
children are eligible for
hot meal; 50 million are
getting the meals; of
which 27 million also get
the “4-in-one health
package.”
•The scheme does not
provide meals to those
who does not attend the
school.
46
2007-08 2008-09 2009-10 2010-11 2011-12
Growth in GDP for
Agriculture and allied
Sectors (%), base year
2004-05
5.8 0.1 0.8 7.9 3.6
Source:-Economic Survey,2013
Rashtriya Krishi Vikas Yojana
•Started in 2007-08 for incentivizing states to enhance public
investment to achieve 4% growth rate in agriculture and
allied sectors during the 11th five year plan. During 2007-11
an amount of Rs.14598 was released.
47
• 10th September, 2013 with the objective to provide for food
and nutritional security in human life cycle approach, by
ensuring access to adequate quantity of quality food at
affordable prices to people to live a life with dignity.
•50% of urban and 75% of rural population be covered under
Act.
•Guarantees providing 5 kg food grain per person per month at a
subsidised rate to 67% of the country's population.
•82 crore people in both urban and rural areas.
•Food grains would include rice, wheat and millet at Rs.3, Rs.2
and Rs.1 per kg, respectively.
National Food Security Act 2013
States with increased requirement as per NFSB (lakh tonne)
Present TDPS allocation (2010-11) Likely TDPS requirement (As per NFSB) Increase
Uttara Pradesh 63.41 93.92 30.51
Bihar 33.83 59.23 25.40
Madhya Pradesh 24.02 37.77 13.75
Rajasthana 17.83 29.08 11.25
Maharashtra 40.87 48.71 7.84
West Bengal 32.97 37.87 4.90
Karnataka 20.71 24.78 4.07
Jharkhand 12.41 16.34 3.93
Orissa 21.19 24.53 3.34
Haryana 6.14 8.75 2.61
Chattisgarh 10.92 13.39 2.47
Punjab 7.45 8.88 1.43
Gujarath 1.08 1.21 0.13
Total 309.93 428.87 118.94
Source: Kumar, 2012
0
10
20
30
40
50
60
70
80
90
100
Present TDPS As per NFSB
2011-12 (billion Rs.) 2012-13 (billion Rs.)
Without NFSB 957.87 1097.96
With NFSB 988.42 1122.20
Existing allotment under TDPS (2010-11) 42.79 mt
Storage
Total capacity with FCI (15/01/12) 33.40 mt
Storage capacity with state agencies(31/03/2011) 30.33 mt
Total storage capacity 63.73 mt
Proposed storage capacity 15.12 mt
Food subsidy
Storage capacity requirement under NFSB
Case study
• Role of Agricultural Extension in Improving Food Security
of Rural Households of Hamedan Province, Iran
• Mehdi Mohamadian Jadval Ghadam (2012)
• Food availability situation, most of the farmers (40.6) have
stated that the situation of food availability is in moderate
level and only 12.8 percent have believed that it is completely
appropriate
• In regarding the role of agricultural education in improving
food security of rural households, findings indicate that most
of the farmers (44.4 percent) have mentioned that agricultural
education has a moderate role in improving food security,
while 34.2 percent has believed that it is little
Work from our division
• Livelihood security of rural area: a critical analysis by
Smitha baby (2005).
• In this study, the food security was operationalised as
availability and access to balanced food at household level. It
was studied as a component of livelihood security scale.
• Food security of the labor class was very poor as the majority
(70%) household was found to be food insecure. 22 per cent
of the marginal farmers were having low food security index .
SUGGESTIONS
• Small farms can be helped in increasing productivity by having access to
extension services and better water management. Sustainable agriculture
should be the focus of interventions.
• Local knowledge and local seeds can be used for biodiversity. Organic
farming can also be encouraged to protect the environment and generate
higher incomes for small farmers.
• Urban agriculture can improve food security in urban areas. Homegrown
food can also be encouraged as it would contribute to food security and
nutrition as well as freeing incomes for non-food expenses such as health
and education. ate higher incomes for small farmers.
• Project GOAL empowers communities through health literacy and
connects rural communities with the government health and nutrition
services available.
• Focus on areas likely to be affected by climate change.
• Group approach to realize economies of scale in buying inputs and
marketing outputs. One important problem in India is marketing of
agricultural production.
• Using information technology for agricultural production and marketing.
• Purchasing locally grown food from low income and small holder farmers
to benefit their families and communities.
• Micro nutrient programme is another area of intervention. For example,
Vitamin A tablets alone have prevented many deaths. Vitamin A and food
fortification like salt iodization are an integral part of food security
programmes.
• In order to improve delivery systems in food based programmes there is a
need to strengthen programmes like ICDS with the covnvergence of
several departments. International agencies can help in this convergence
as a pilot project to improve the delivery systems.
WAY FORWAD
• Freedom from hunger is not only a basic human right: it is essential for the
full enjoyment of other rights, such as health, education, information etc.
• Innovative strategic interventions are the needs of the hour to ensure food
availability, food access and utilization of food
• India will not have problem of Cereals availability in the long run (2020-21)
and will have shortage of Pulse and Oilseed production if adequate steps
are not taken by the Government of India.
• Due to changes in consumption patterns, demand for non-cereal food has
been increasing. So, need to focus on crop diversification and improve
allied activities
 There are many deficit areas in agriculture need to be focus
 Investment on infrastructure
 Soil and water management
 Research
 Market reforms
 Nutrition component needs a multi-disciplinary approach covering
diet diversification including micronutrients, women’s
empowerment, education, health, safe drinking water, sanitation
and hygiene
 Nutrition improvement should combine a rights based approach
and nutrition education.
“There are people in the world so hungry, that God cannot appear to
them except in the form of bread.” Mahatma Gandhi
Seminar food security

More Related Content

What's hot

Global Food Security Challenges and Opportunities
Global Food Security Challenges and OpportunitiesGlobal Food Security Challenges and Opportunities
Global Food Security Challenges and OpportunitiesShenggen Fan
 
8.Food security in pakistan recent trends and way By Mr Allah Dad Khan Provi...
8.Food security in pakistan recent trends and way  By Mr Allah Dad Khan Provi...8.Food security in pakistan recent trends and way  By Mr Allah Dad Khan Provi...
8.Food security in pakistan recent trends and way By Mr Allah Dad Khan Provi...Mr.Allah Dad Khan
 
Food loss and food wastage
Food loss and food wastage Food loss and food wastage
Food loss and food wastage Abhinav Vivek
 
Food security and Nutrition in Nepal
Food security and Nutrition in NepalFood security and Nutrition in Nepal
Food security and Nutrition in NepalManik Rajbhandari
 
Nutrition-sensitive food systems: from concepts to practice: Resources for de...
Nutrition-sensitive food systems: from concepts to practice: Resources for de...Nutrition-sensitive food systems: from concepts to practice: Resources for de...
Nutrition-sensitive food systems: from concepts to practice: Resources for de...Francois Stepman
 
Nutrition-Sensitive Agriculture in Achieving the End of Hunger and Malnutrition
Nutrition-Sensitive Agriculture in Achieving the End of Hunger and MalnutritionNutrition-Sensitive Agriculture in Achieving the End of Hunger and Malnutrition
Nutrition-Sensitive Agriculture in Achieving the End of Hunger and MalnutritionWorldFish
 
World Hunger and Food Security
World Hunger and Food SecurityWorld Hunger and Food Security
World Hunger and Food SecurityToni Menninger
 
Food security and food safety
Food security and food safetyFood security and food safety
Food security and food safetyMd.Nahian Rahman
 

What's hot (20)

Responding to the Global Food Crisis
Responding to the Global Food CrisisResponding to the Global Food Crisis
Responding to the Global Food Crisis
 
Food Insecurity and How to Address it
Food Insecurity and How to Address itFood Insecurity and How to Address it
Food Insecurity and How to Address it
 
Food Security and Developing Countries
Food Security and Developing CountriesFood Security and Developing Countries
Food Security and Developing Countries
 
Global Food Security Challenges and Opportunities
Global Food Security Challenges and OpportunitiesGlobal Food Security Challenges and Opportunities
Global Food Security Challenges and Opportunities
 
8.Food security in pakistan recent trends and way By Mr Allah Dad Khan Provi...
8.Food security in pakistan recent trends and way  By Mr Allah Dad Khan Provi...8.Food security in pakistan recent trends and way  By Mr Allah Dad Khan Provi...
8.Food security in pakistan recent trends and way By Mr Allah Dad Khan Provi...
 
4. World Hunger
4. World Hunger4. World Hunger
4. World Hunger
 
Food security
Food securityFood security
Food security
 
IFPRI-Bangladesh "Food Security in Bangladesh: What Role for Social Safety Ne...
IFPRI-Bangladesh "Food Security in Bangladesh: What Role for Social Safety Ne...IFPRI-Bangladesh "Food Security in Bangladesh: What Role for Social Safety Ne...
IFPRI-Bangladesh "Food Security in Bangladesh: What Role for Social Safety Ne...
 
Food Security
Food SecurityFood Security
Food Security
 
Food loss and food wastage
Food loss and food wastage Food loss and food wastage
Food loss and food wastage
 
Food security and Nutrition in Nepal
Food security and Nutrition in NepalFood security and Nutrition in Nepal
Food security and Nutrition in Nepal
 
Food Security & Challenges 2010
Food Security & Challenges 2010Food Security & Challenges 2010
Food Security & Challenges 2010
 
Nutrition-sensitive food systems: from concepts to practice: Resources for de...
Nutrition-sensitive food systems: from concepts to practice: Resources for de...Nutrition-sensitive food systems: from concepts to practice: Resources for de...
Nutrition-sensitive food systems: from concepts to practice: Resources for de...
 
Pakistan’s Multi-Sectoral Nutrition Strategy
Pakistan’s Multi-Sectoral Nutrition Strategy Pakistan’s Multi-Sectoral Nutrition Strategy
Pakistan’s Multi-Sectoral Nutrition Strategy
 
World hunger presentation ppt
World hunger presentation pptWorld hunger presentation ppt
World hunger presentation ppt
 
Nutrition-Sensitive Agriculture in Achieving the End of Hunger and Malnutrition
Nutrition-Sensitive Agriculture in Achieving the End of Hunger and MalnutritionNutrition-Sensitive Agriculture in Achieving the End of Hunger and Malnutrition
Nutrition-Sensitive Agriculture in Achieving the End of Hunger and Malnutrition
 
World Hunger and Food Security
World Hunger and Food SecurityWorld Hunger and Food Security
World Hunger and Food Security
 
Presentation on food security
Presentation on food securityPresentation on food security
Presentation on food security
 
Lecture 2 food security
Lecture 2 food security Lecture 2 food security
Lecture 2 food security
 
Food security and food safety
Food security and food safetyFood security and food safety
Food security and food safety
 

Viewers also liked

Up-scaling and out-scaling conservation agriculture technologies: The case of...
Up-scaling and out-scaling conservation agriculture technologies: The case of...Up-scaling and out-scaling conservation agriculture technologies: The case of...
Up-scaling and out-scaling conservation agriculture technologies: The case of...CIMMYT
 
Comparison of extension system of different countries
Comparison of extension system  of different countriesComparison of extension system  of different countries
Comparison of extension system of different countriesJagriti Rohit
 
Inclusive growth in India- prospects and challenges
Inclusive growth in India- prospects and challenges Inclusive growth in India- prospects and challenges
Inclusive growth in India- prospects and challenges Jagriti Rohit
 
Employment generation programmes in India
Employment generation programmes in India Employment generation programmes in India
Employment generation programmes in India Jagriti Rohit
 
indeginous traditional knowledge for tackling climate change
indeginous traditional knowledge for tackling climate changeindeginous traditional knowledge for tackling climate change
indeginous traditional knowledge for tackling climate changeJagriti Rohit
 
Community radio in agriculture
Community radio in agriculture Community radio in agriculture
Community radio in agriculture Jagriti Rohit
 
total quality management and team management
total quality management and team management total quality management and team management
total quality management and team management Jagriti Rohit
 
Agricultural Marketing Information System in India
Agricultural Marketing Information System in IndiaAgricultural Marketing Information System in India
Agricultural Marketing Information System in IndiaAttaluri Srinivasacharyulu
 

Viewers also liked (9)

Up-scaling and out-scaling conservation agriculture technologies: The case of...
Up-scaling and out-scaling conservation agriculture technologies: The case of...Up-scaling and out-scaling conservation agriculture technologies: The case of...
Up-scaling and out-scaling conservation agriculture technologies: The case of...
 
Comparison of extension system of different countries
Comparison of extension system  of different countriesComparison of extension system  of different countries
Comparison of extension system of different countries
 
Inclusive growth in India- prospects and challenges
Inclusive growth in India- prospects and challenges Inclusive growth in India- prospects and challenges
Inclusive growth in India- prospects and challenges
 
Employment generation programmes in India
Employment generation programmes in India Employment generation programmes in India
Employment generation programmes in India
 
indeginous traditional knowledge for tackling climate change
indeginous traditional knowledge for tackling climate changeindeginous traditional knowledge for tackling climate change
indeginous traditional knowledge for tackling climate change
 
Ict in agriculture
Ict in agricultureIct in agriculture
Ict in agriculture
 
Community radio in agriculture
Community radio in agriculture Community radio in agriculture
Community radio in agriculture
 
total quality management and team management
total quality management and team management total quality management and team management
total quality management and team management
 
Agricultural Marketing Information System in India
Agricultural Marketing Information System in IndiaAgricultural Marketing Information System in India
Agricultural Marketing Information System in India
 

Similar to Seminar food security

Food security and public distribution system
Food security and public distribution systemFood security and public distribution system
Food security and public distribution systemshivalika sood
 
Agriculture performance food security and public distristribution system.
Agriculture performance food security and public distristribution system.Agriculture performance food security and public distristribution system.
Agriculture performance food security and public distristribution system.Nazath Parvin
 
National Food Security Mission-Seminar
National Food Security Mission-SeminarNational Food Security Mission-Seminar
National Food Security Mission-SeminarRashmi Ranjan Moharana
 
An overview on ‘Agricultural Development in indeveloping India’
An overview on ‘Agricultural Development in indeveloping India’An overview on ‘Agricultural Development in indeveloping India’
An overview on ‘Agricultural Development in indeveloping India’RHIMRJ Journal
 
202317812-national-food-security-act-2013.pdf
202317812-national-food-security-act-2013.pdf202317812-national-food-security-act-2013.pdf
202317812-national-food-security-act-2013.pdfRoyalSamara
 
Institutional and Policy Innovations for Food and Nutrition Security in Asia ...
Institutional and Policy Innovations for Food and Nutrition Security in Asia ...Institutional and Policy Innovations for Food and Nutrition Security in Asia ...
Institutional and Policy Innovations for Food and Nutrition Security in Asia ...CIMMYT
 
E2 a02 unit_i_sectoral development in india
E2 a02 unit_i_sectoral development in indiaE2 a02 unit_i_sectoral development in india
E2 a02 unit_i_sectoral development in india4512452
 
Food systems methodology and the importance of capturing icdam 2012
Food systems methodology and the importance of capturing icdam 2012Food systems methodology and the importance of capturing icdam 2012
Food systems methodology and the importance of capturing icdam 2012Thingnganing Longvah
 
Agrarian Crisis in Telangana and Way forward
Agrarian Crisis in Telangana and Way forwardAgrarian Crisis in Telangana and Way forward
Agrarian Crisis in Telangana and Way forwardRamanjaneyulu GV
 

Similar to Seminar food security (20)

Food security and public distribution system
Food security and public distribution systemFood security and public distribution system
Food security and public distribution system
 
Agriculture performance food security and public distristribution system.
Agriculture performance food security and public distristribution system.Agriculture performance food security and public distristribution system.
Agriculture performance food security and public distristribution system.
 
National Food Security Mission-Seminar
National Food Security Mission-SeminarNational Food Security Mission-Seminar
National Food Security Mission-Seminar
 
IFPRI- Food Demand and Supply in Bihar, P Kumar, IFPRI
IFPRI- Food Demand and Supply in Bihar, P Kumar, IFPRIIFPRI- Food Demand and Supply in Bihar, P Kumar, IFPRI
IFPRI- Food Demand and Supply in Bihar, P Kumar, IFPRI
 
An overview on ‘Agricultural Development in indeveloping India’
An overview on ‘Agricultural Development in indeveloping India’An overview on ‘Agricultural Development in indeveloping India’
An overview on ‘Agricultural Development in indeveloping India’
 
Dietary changes – example from India, Bangladesh and Pakistan
Dietary changes – example from India, Bangladesh and PakistanDietary changes – example from India, Bangladesh and Pakistan
Dietary changes – example from India, Bangladesh and Pakistan
 
Food Security in Afghanistan
Food Security in AfghanistanFood Security in Afghanistan
Food Security in Afghanistan
 
IFPRI- Challenges of Food and Nutrition Security in Bihar, Anjani Kumar, IFPRI
IFPRI- Challenges of Food and Nutrition Security in Bihar, Anjani Kumar, IFPRI IFPRI- Challenges of Food and Nutrition Security in Bihar, Anjani Kumar, IFPRI
IFPRI- Challenges of Food and Nutrition Security in Bihar, Anjani Kumar, IFPRI
 
202317812-national-food-security-act-2013.pdf
202317812-national-food-security-act-2013.pdf202317812-national-food-security-act-2013.pdf
202317812-national-food-security-act-2013.pdf
 
Institutional and Policy Innovations for Food and Nutrition Security in Asia ...
Institutional and Policy Innovations for Food and Nutrition Security in Asia ...Institutional and Policy Innovations for Food and Nutrition Security in Asia ...
Institutional and Policy Innovations for Food and Nutrition Security in Asia ...
 
E2 a02 unit_i_sectoral development in india
E2 a02 unit_i_sectoral development in indiaE2 a02 unit_i_sectoral development in india
E2 a02 unit_i_sectoral development in india
 
Food market transformation and improving food security in Asia (within and ac...
Food market transformation and improving food security in Asia (within and ac...Food market transformation and improving food security in Asia (within and ac...
Food market transformation and improving food security in Asia (within and ac...
 
Food consumption patterns and nutritional status in pakistan
Food consumption patterns and nutritional status in pakistan Food consumption patterns and nutritional status in pakistan
Food consumption patterns and nutritional status in pakistan
 
STATUS OF FOOD and NUTRITION SECURITY IN FIJI
STATUS OF FOOD and NUTRITION SECURITY IN FIJISTATUS OF FOOD and NUTRITION SECURITY IN FIJI
STATUS OF FOOD and NUTRITION SECURITY IN FIJI
 
IFPRI - Food Secure Bihar, P K Joshi, IFPRI
IFPRI - Food Secure Bihar, P K Joshi, IFPRIIFPRI - Food Secure Bihar, P K Joshi, IFPRI
IFPRI - Food Secure Bihar, P K Joshi, IFPRI
 
T0 numtq0nzk=
T0 numtq0nzk=T0 numtq0nzk=
T0 numtq0nzk=
 
Food systems methodology and the importance of capturing icdam 2012
Food systems methodology and the importance of capturing icdam 2012Food systems methodology and the importance of capturing icdam 2012
Food systems methodology and the importance of capturing icdam 2012
 
IFPRI- dynamics of pulses production
IFPRI-  dynamics of pulses productionIFPRI-  dynamics of pulses production
IFPRI- dynamics of pulses production
 
Agrarian Crisis in Telangana and Way forward
Agrarian Crisis in Telangana and Way forwardAgrarian Crisis in Telangana and Way forward
Agrarian Crisis in Telangana and Way forward
 
India And Wto
India And WtoIndia And Wto
India And Wto
 

Recently uploaded

Basic_QTL_Marker-assisted_Selection_Sourabh.ppt
Basic_QTL_Marker-assisted_Selection_Sourabh.pptBasic_QTL_Marker-assisted_Selection_Sourabh.ppt
Basic_QTL_Marker-assisted_Selection_Sourabh.pptSourabh Kumar
 
[GDSC YCCE] Build with AI Online Presentation
[GDSC YCCE] Build with AI Online Presentation[GDSC YCCE] Build with AI Online Presentation
[GDSC YCCE] Build with AI Online PresentationGDSCYCCE
 
Phrasal Verbs.XXXXXXXXXXXXXXXXXXXXXXXXXX
Phrasal Verbs.XXXXXXXXXXXXXXXXXXXXXXXXXXPhrasal Verbs.XXXXXXXXXXXXXXXXXXXXXXXXXX
Phrasal Verbs.XXXXXXXXXXXXXXXXXXXXXXXXXXMIRIAMSALINAS13
 
2024_Student Session 2_ Set Plan Preparation.pptx
2024_Student Session 2_ Set Plan Preparation.pptx2024_Student Session 2_ Set Plan Preparation.pptx
2024_Student Session 2_ Set Plan Preparation.pptxmansk2
 
aaaaaaaaaaaaaaaaaaaaaaaaaaaaaaaaaaaaaaaaaaaaaaaaaaaaaaa
aaaaaaaaaaaaaaaaaaaaaaaaaaaaaaaaaaaaaaaaaaaaaaaaaaaaaaaaaaaaaaaaaaaaaaaaaaaaaaaaaaaaaaaaaaaaaaaaaaaaaaaaaaaaaa
aaaaaaaaaaaaaaaaaaaaaaaaaaaaaaaaaaaaaaaaaaaaaaaaaaaaaaasiemaillard
 
Application of Matrices in real life. Presentation on application of matrices
Application of Matrices in real life. Presentation on application of matricesApplication of Matrices in real life. Presentation on application of matrices
Application of Matrices in real life. Presentation on application of matricesRased Khan
 
Danh sách HSG Bộ môn cấp trường - Cấp THPT.pdf
Danh sách HSG Bộ môn cấp trường - Cấp THPT.pdfDanh sách HSG Bộ môn cấp trường - Cấp THPT.pdf
Danh sách HSG Bộ môn cấp trường - Cấp THPT.pdfQucHHunhnh
 
The Art Pastor's Guide to Sabbath | Steve Thomason
The Art Pastor's Guide to Sabbath | Steve ThomasonThe Art Pastor's Guide to Sabbath | Steve Thomason
The Art Pastor's Guide to Sabbath | Steve ThomasonSteve Thomason
 
Basic phrases for greeting and assisting costumers
Basic phrases for greeting and assisting costumersBasic phrases for greeting and assisting costumers
Basic phrases for greeting and assisting costumersPedroFerreira53928
 
aaaaaaaaaaaaaaaaaaaaaaaaaaaaaaaaaaaaaaaaa
aaaaaaaaaaaaaaaaaaaaaaaaaaaaaaaaaaaaaaaaaaaaaaaaaaaaaaaaaaaaaaaaaaaaaaaaaaaaaaaaaa
aaaaaaaaaaaaaaaaaaaaaaaaaaaaaaaaaaaaaaaaasiemaillard
 
Instructions for Submissions thorugh G- Classroom.pptx
Instructions for Submissions thorugh G- Classroom.pptxInstructions for Submissions thorugh G- Classroom.pptx
Instructions for Submissions thorugh G- Classroom.pptxJheel Barad
 
UNIT – IV_PCI Complaints: Complaints and evaluation of complaints, Handling o...
UNIT – IV_PCI Complaints: Complaints and evaluation of complaints, Handling o...UNIT – IV_PCI Complaints: Complaints and evaluation of complaints, Handling o...
UNIT – IV_PCI Complaints: Complaints and evaluation of complaints, Handling o...Sayali Powar
 
Matatag-Curriculum and the 21st Century Skills Presentation.pptx
Matatag-Curriculum and the 21st Century Skills Presentation.pptxMatatag-Curriculum and the 21st Century Skills Presentation.pptx
Matatag-Curriculum and the 21st Century Skills Presentation.pptxJenilouCasareno
 
size separation d pharm 1st year pharmaceutics
size separation d pharm 1st year pharmaceuticssize separation d pharm 1st year pharmaceutics
size separation d pharm 1st year pharmaceuticspragatimahajan3
 
Morse OER Some Benefits and Challenges.pptx
Morse OER Some Benefits and Challenges.pptxMorse OER Some Benefits and Challenges.pptx
Morse OER Some Benefits and Challenges.pptxjmorse8
 
How to the fix Attribute Error in odoo 17
How to the fix Attribute Error in odoo 17How to the fix Attribute Error in odoo 17
How to the fix Attribute Error in odoo 17Celine George
 
Students, digital devices and success - Andreas Schleicher - 27 May 2024..pptx
Students, digital devices and success - Andreas Schleicher - 27 May 2024..pptxStudents, digital devices and success - Andreas Schleicher - 27 May 2024..pptx
Students, digital devices and success - Andreas Schleicher - 27 May 2024..pptxEduSkills OECD
 
Sectors of the Indian Economy - Class 10 Study Notes pdf
Sectors of the Indian Economy - Class 10 Study Notes pdfSectors of the Indian Economy - Class 10 Study Notes pdf
Sectors of the Indian Economy - Class 10 Study Notes pdfVivekanand Anglo Vedic Academy
 
Salient features of Environment protection Act 1986.pptx
Salient features of Environment protection Act 1986.pptxSalient features of Environment protection Act 1986.pptx
Salient features of Environment protection Act 1986.pptxakshayaramakrishnan21
 

Recently uploaded (20)

Basic_QTL_Marker-assisted_Selection_Sourabh.ppt
Basic_QTL_Marker-assisted_Selection_Sourabh.pptBasic_QTL_Marker-assisted_Selection_Sourabh.ppt
Basic_QTL_Marker-assisted_Selection_Sourabh.ppt
 
[GDSC YCCE] Build with AI Online Presentation
[GDSC YCCE] Build with AI Online Presentation[GDSC YCCE] Build with AI Online Presentation
[GDSC YCCE] Build with AI Online Presentation
 
Phrasal Verbs.XXXXXXXXXXXXXXXXXXXXXXXXXX
Phrasal Verbs.XXXXXXXXXXXXXXXXXXXXXXXXXXPhrasal Verbs.XXXXXXXXXXXXXXXXXXXXXXXXXX
Phrasal Verbs.XXXXXXXXXXXXXXXXXXXXXXXXXX
 
2024_Student Session 2_ Set Plan Preparation.pptx
2024_Student Session 2_ Set Plan Preparation.pptx2024_Student Session 2_ Set Plan Preparation.pptx
2024_Student Session 2_ Set Plan Preparation.pptx
 
aaaaaaaaaaaaaaaaaaaaaaaaaaaaaaaaaaaaaaaaaaaaaaaaaaaaaaa
aaaaaaaaaaaaaaaaaaaaaaaaaaaaaaaaaaaaaaaaaaaaaaaaaaaaaaaaaaaaaaaaaaaaaaaaaaaaaaaaaaaaaaaaaaaaaaaaaaaaaaaaaaaaaa
aaaaaaaaaaaaaaaaaaaaaaaaaaaaaaaaaaaaaaaaaaaaaaaaaaaaaaa
 
Application of Matrices in real life. Presentation on application of matrices
Application of Matrices in real life. Presentation on application of matricesApplication of Matrices in real life. Presentation on application of matrices
Application of Matrices in real life. Presentation on application of matrices
 
Danh sách HSG Bộ môn cấp trường - Cấp THPT.pdf
Danh sách HSG Bộ môn cấp trường - Cấp THPT.pdfDanh sách HSG Bộ môn cấp trường - Cấp THPT.pdf
Danh sách HSG Bộ môn cấp trường - Cấp THPT.pdf
 
The Art Pastor's Guide to Sabbath | Steve Thomason
The Art Pastor's Guide to Sabbath | Steve ThomasonThe Art Pastor's Guide to Sabbath | Steve Thomason
The Art Pastor's Guide to Sabbath | Steve Thomason
 
Basic phrases for greeting and assisting costumers
Basic phrases for greeting and assisting costumersBasic phrases for greeting and assisting costumers
Basic phrases for greeting and assisting costumers
 
aaaaaaaaaaaaaaaaaaaaaaaaaaaaaaaaaaaaaaaaa
aaaaaaaaaaaaaaaaaaaaaaaaaaaaaaaaaaaaaaaaaaaaaaaaaaaaaaaaaaaaaaaaaaaaaaaaaaaaaaaaaa
aaaaaaaaaaaaaaaaaaaaaaaaaaaaaaaaaaaaaaaaa
 
Instructions for Submissions thorugh G- Classroom.pptx
Instructions for Submissions thorugh G- Classroom.pptxInstructions for Submissions thorugh G- Classroom.pptx
Instructions for Submissions thorugh G- Classroom.pptx
 
UNIT – IV_PCI Complaints: Complaints and evaluation of complaints, Handling o...
UNIT – IV_PCI Complaints: Complaints and evaluation of complaints, Handling o...UNIT – IV_PCI Complaints: Complaints and evaluation of complaints, Handling o...
UNIT – IV_PCI Complaints: Complaints and evaluation of complaints, Handling o...
 
Matatag-Curriculum and the 21st Century Skills Presentation.pptx
Matatag-Curriculum and the 21st Century Skills Presentation.pptxMatatag-Curriculum and the 21st Century Skills Presentation.pptx
Matatag-Curriculum and the 21st Century Skills Presentation.pptx
 
Mattingly "AI & Prompt Design: Limitations and Solutions with LLMs"
Mattingly "AI & Prompt Design: Limitations and Solutions with LLMs"Mattingly "AI & Prompt Design: Limitations and Solutions with LLMs"
Mattingly "AI & Prompt Design: Limitations and Solutions with LLMs"
 
size separation d pharm 1st year pharmaceutics
size separation d pharm 1st year pharmaceuticssize separation d pharm 1st year pharmaceutics
size separation d pharm 1st year pharmaceutics
 
Morse OER Some Benefits and Challenges.pptx
Morse OER Some Benefits and Challenges.pptxMorse OER Some Benefits and Challenges.pptx
Morse OER Some Benefits and Challenges.pptx
 
How to the fix Attribute Error in odoo 17
How to the fix Attribute Error in odoo 17How to the fix Attribute Error in odoo 17
How to the fix Attribute Error in odoo 17
 
Students, digital devices and success - Andreas Schleicher - 27 May 2024..pptx
Students, digital devices and success - Andreas Schleicher - 27 May 2024..pptxStudents, digital devices and success - Andreas Schleicher - 27 May 2024..pptx
Students, digital devices and success - Andreas Schleicher - 27 May 2024..pptx
 
Sectors of the Indian Economy - Class 10 Study Notes pdf
Sectors of the Indian Economy - Class 10 Study Notes pdfSectors of the Indian Economy - Class 10 Study Notes pdf
Sectors of the Indian Economy - Class 10 Study Notes pdf
 
Salient features of Environment protection Act 1986.pptx
Salient features of Environment protection Act 1986.pptxSalient features of Environment protection Act 1986.pptx
Salient features of Environment protection Act 1986.pptx
 

Seminar food security

  • 1. “Nothing is more degrading than hunger, especially when man made.” Ban Ki Moon, United Nations Secretary General
  • 2. Food and nutritional security in India: Performance and Challenges Presented by : JAGRITI ROHIT Roll No: 10242
  • 3. According to FAO, 1996 “food security exists when all people, at all times, have physical and economic access to sufficient, safe and nutritious food to meet their dietary needs and food preferences for an active and healthy life” Physical and economic Availability to food Physical and economic access to food Food Utilization Stability of the other 3 dimensions over time dimensions
  • 4. SWAMINATHAN (1986) has stressed the need for shifting to the concept of ‘Nutrition Security’, which he has defined as “physical, economic and social access to balanced diet, clean drinking water, environmental hygiene, primary health care and nutritional literacy”
  • 5. Poverty HungerMalnutrition 29.5% of the India population lives below the poverty line (FAO) 210 MILLION OF WORLD HUNGRY PEOPLE ARE IN INDIA. (FAO) 42.3 per cent children under the age of five years are underweight, 58.8 per cent are stunted and 11.4 per cent are “wasted”. (FAO) Food insecurity Global losses in economic productivity due to undernutrition and micronutrient deficiencies have been estimated at more than 10 percent of lifetime earnings and 2–3 percent of global gross domestic product (GdP) (World bank, 2006a)
  • 6. Reason for global food crisis
  • 7.
  • 8. Food security at the national level refers to availability in the country of sufficient stocks of food to meet domestic demand through domestic supply or imports
  • 9. Crop 2011-12 2012-13 Rice 105.31 104.22 Wheat 94.88 93.62 Coarse cereals 42.04 39.52 Total cereals 242.23 237.3618 Pulses 17.09 18.00 Total food grains 259.32 255.36 Oilseeds 29.79 30.72 Sugar 24.60 26.00 Vegetables 156.325 156.445 Fruits 76.42 79.40 Milk 127.9 133.7 Source:-RBI Hand Book on India Economy 2011-12 (million tonnes) Physical Availability of Food
  • 10. Growth in production and yields of food grains, fruits and vegetables (%) Rice Wheat Coarse Cereals Pulses Total food grains Fruits Vegetables Production 1950s 4.46 5.17 3.66 4.10 4.24 NA NA 1960s 1.19 6.82 1.51 -1.29 1.85 NA NA 1970s 1.90 4.31 1.11 -0.39 2.07 NA NA 1980s 3.62 3.58 0.35 1.49 2.73 NA NA 1990s 2.02 3.57 -0.01 0.86 2.10 5.25 5.15 2000s 2.16 1.78 3.46 3.00 2.29 6.48 5.53 Overall 2.59 4.78 1.00 0.59 2.50 4.27 4.41 Productivity 1950s 3.15 1.08 2.33 0.94 2.26 NA NA 1960s 3.36 4.46 0.91 0.03 1.32 NA NA 1970s 1.01 1.87 2.00 -0.98 1.60 NA NA 1980s 3.19 3.10 1.71 1.59 2.97 NA NA 1990s 1.34 1.82 2.14 1.27 2.17 1.83 3.26 2000s 1.62 0.80 3.59 1.96 1.69 0.55 1.57 Overall 1.90 2.82 1.90 0.41 2.23 -0.09 1.67
  • 11. 0 200,000,000 400,000,000 600,000,000 800,000,000 1,000,000,000 1,200,000,000 0.00 50.00 100.00 150.00 200.00 250.00 300.00 1960-61 1970-71 1980-81 1990-91 2000-01 2010-11 Numbers (inmillliontonne) Population vs Food Food grain Rice Wheat Pulses Population Source: Economic Survey, 2011-12
  • 12. Production of major livestock products 0 20 40 60 80 100 120 140 Milk (million tonne) Egg ('000 million no.) Fish ('00 thousand tonne) Products CGR (%) Milk 4.11 Fish 5.77 Egg 3.44
  • 13.  Scope for increase in net sown area is limited  Land degradation in the form of depletion of soil fertility and erosion  Exposure of domestic agriculture to international competition has resulted in a high price volatility  Steeper decline in per capita agricultural land availability  Shrinking of farm size  Land issues such as SEZs, land going to non-agriculture Factors responsible for stagnating growth
  • 14. Per capita availability of foodgrains • Net availability declined if we compare till 1997 with 2010 • Increase in foodgrains production has not been able to keep pace with the increase in population. • 2010, per capita availability of foodgrains was only 439 grams/day - much lower than 510 grams/day in 1991 • Pulses - from1951 to 2010, per capita availability of has declined significantly • Per capita availability of sugar and edible oils has increased over time
  • 15. 15 Year Cereal Pulses Total 1950-51 334.2 60.7 394.9 1960-61 399.7 69.0 468.7 1970-71 417.6 51.2 468.8 1980-81 417.3 37.5 454.8 1990-91 468.5 41.6 510.1 2000-01 366.2 30.0 416.2 2005-06 390.9 31.5 422.4 2006-07 412.1 32.5 444.5 2007-08 407.4 32.5 442.8 2008-09 374.6 41.8 436.0 2009-10 407.0 37.0 444.0 2010-11 407.0 31.6 438.6 Source: Indian Economy,Gaurav Datt and Ashwani Mahajan,2013 (in gram) Per capita Net Availability Per Day
  • 16. 16 Commodity Per capita availability Minimum per capita requirement Total cereals 528.70 400 Pulses 46.78 80 Total food grains 568.79 480 Oil 39.73 30 Sugar 54.79 20 Vegetables 348.47 300 Fruits 176.86 150 Milk 297.81 300 Source:-National Institute of Nutrition, Hyderabad (in gram per day) Per capita availability, 2012-13
  • 17. NSS round 43th 50th 55th 61st 62nd 63rd 64th Year 1987-88 1993-94 1999-00 2004-05 2005-06 2006-07 2007-08 RURAL Cereals 26.14 23.8 22.16 17.38 17.02 16.51 16.07 Gram 0.24 0.17 0.13 0.13 0.15 0.17 0.15 Edible oil 4.98 4.37 3.74 4.44 4.08 3.92 4.31 Milk & milk products 8.62 9.33 8.75 8.17 8.16 8.09 7.79 Egg, fish and meat 3.23 3.29 3.32 3.21 3.89 3.5 3.41 Vegetables 5.21 5.94 6.17 5.88 6.07 6.19 6.28 Fruits & nuts 1.63 1.71 1.72 1.8 1.88 1.79 1.76 URBAN Cereals 14.79 13.85 12.35 9.58 9.38 9.05 8.88 Gram 0.16 0.17 0.11 0.1 0.11 0.13 0.12 Edible oil 5.29 4.33 3.14 3.29 2.99 2.86 3.16 Milk & milk products 9.54 9.67 8.68 7.54 7.26 7.43 7.25 Egg, fish and meat 3.54 3.34 3.13 2.58 2.76 2.61 2.68 Vegetables 5.25 5.38 5.13 4.24 4.25 4.33 4.37 Fruits & nuts 2.51 2.63 2.42 2.14 2.18 2.13 2.11 Source: Household consumption expenditure in India, 2007-08, NSSO, Government of India Table 5: Share of different food items in per capita expenditure over NSS rounds (%) Changes in consumption patterns
  • 18. Share of different food items in per capita expenditure of consumer (%) 0 5 10 15 20 25 30 35 43th 50th 55th 61st 62nd 63rd 64th Percentage NSSO rounds 0 5 10 15 20 25 43th 50th 55th 61st 62nd 63rd 64th Percentage NSSO rounds 0 10 20 30 43th 50th 55th 61st 62nd 63rd 64th Percentage NSSO rounds Cereals, grams and edible oil Milk, fish, egg and meat Vegetables, nuts and fruits Rural Urban
  • 19. According to NCAP report, India will require 280.6 million tonnes of food grains by 2020. Demand for pulses and oil seeds would increase by 140 per cent and 243 per cent respectively. India would require about 130 million tonne of rice in 2020 while requirement of wheat would reach 110 million tonne in 2020. Food Grain Requirement Projection Source: Policy Brief on demand for foodgrains during 2020,Ramesh Chand, NCAP, New Delhi
  • 20. Projected Scenario of 2030 ICAR Vision Document 2030
  • 21. Strategies to increase food production • Defending the gains conservation farming . ‘National Biosecurity System’ , “bright spots” and “hot spots” , Good Weather Code • Extending the gains Indo-Gangetic plains , ‘Ganges Water Machine’ • Making new gains • post-harvest technology, agro-processing and value addition to primary produce
  • 22. STRATEGIES TO INCREASE AVAILABILTIY • Community farming • Emphasis on nutrient rich indigenous foods such as Ragi (called food of the poor) • Reduction in cost of production through R&D interventions • Targeting increased productivity, Expand utilization of public storage food facilities, and encourage private sector investment in these facilities
  • 23. PERFORMANCE IN ACCESS TO FOOD AND NUTRITION
  • 24. PERFORMANCE IN ACCESS TO FOOD AND NUTRITION  Individual level: food security means that all members of the society have access to the food  Own production  The market  The government’s transfer mechanism  Two ways to ensuring the adequate purchasing power 1. Employment 2. Increase incomes and subsidize food through social protection programmes
  • 25. Employment Growth Employment  Income  Purchasing power  Access  Consumption Growth rates of employment: 1983 to 1994 and 1994 to 2005 (%) Male Female Total Rural 1983-1994 1.96 1.40 1.77 1994-2005 1.41 1.55 1.46 Urban 1983-1994 3.15 3.37 3.26 1994-2005 3.10 3.08 3.09 Total 1983-1994 2.25 1.65 2.08 1994-2005 1.87 1.78 1.84 Performance in terms of access to food Source: Dev and Sharma (2010)
  • 26. Performance in access to food Food insecurity at the Household Level: Poverty Ratios  The incidence of poverty indicates the extent to which food is accessible to households (Tendulkar committee) Particulars Year Urban Rural Population below poverty line (%) 2004-05 25.70 41.80 2010-11 20.90 33.80 Income criteria to say people below poverty line (Rs/person /day) 2004-05 28.35 22.42 2010-11 32.00 26.00 Absolute number of poor in India (crore) 2004-05 8.14 32.58 2010-11 7.64 27.82
  • 27. 2004-05 2007-08 Rural Urban Total Rural Urban Total Tamil Nadu 80.0 49.8 65.2 87.8 65.7 76.4 Andhra Pradesh 62.5 31.6 54.0 81.1 41.8 70.2 Himachal Pradesh 52.0 15.1 46.6 69.1 41.6 65.4 Kerala 39.3 28.6 36.5 58.6 42.4 54.2 Karnataka 59.8 21.8 45.4 58.6 15.9 42.4 Jammu and Kashmir 33.6 47.3 37.5 37.5 50.2 41.0 Chattisgarh 24.4 14.2 22.1 46.8 18.7 40.2 Orissa 21.6 6.7 19.1 36.1 16.7 32.5 Uttarakhand 26.4 3.0 19.5 35.1 16.8 29.9 Madhya Pradesh 23.8 11.6 20.4 30.2 16.6 26.3 Maharashtra 30.5 7.9 20.3 34.6 6.2 21.4 West Bengal 15.1 6.6 12.4 25.8 9.5 20.7 Gujarat 32.6 7.9 23.0 26.7 6.9 18.2 Assam 9.2 2.5 8.0 20.2 1.8 17.0 Uttara Pradesh 6.5 3.0 5.7 18.3 5.5 15.4 Rajasthana 12.8 2.0 10.0 11.4 8.9 10.8 Haryana 4.1 5.3 4.5 12.1 5.0 9.7 Punjab 0.3 0.7 0.5 9.3 4.3 7.3 Jharkhand 5.9 3.4 5.3 8.2 1.7 6.5 Bihar 2.0 1.8 1.9 3.0 2.6 3.0 All India 26.6 14.7 23.0 35.0 19.4 30.1 Proportion of households reporting grain purchase from PDS (%) Source: Himamshu and Sen (2011) Food security at the Household Level: PDS
  • 28. Proportion of households reporting grain purchase from PDS (%) 0.0 10.0 20.0 30.0 40.0 50.0 60.0 70.0 80.0 90.0 100.0 Rural Urban 0.0 10.0 20.0 30.0 40.0 50.0 60.0 70.0 80.0 90.0 2004-05 2007-08
  • 29. Rotting Wheat in Godowns Source:-http://articles.timesofindia.indiatimes.com/2013-05- 07/india/39090187_1_global-hunger-index-wheat-ghi-score •The Food Corporation of India (FCI) has admitted in data accessed through RTI that the amount of damaged wheat has increased from 2,010 tonnes (T) in 2009-2010 to 2,401.61 tonnes (2011-2012). •The country has already suffered a loss of 932.46 tonnes damaged wheat this year till February(2013).
  • 30. STRATEGIES • Shorten the Supply Chain • Farmer-friendly Marketing and Processing – Producers Owned Companies Value addition near to production • Non-farm Interventions • Strengthen the management and distribution of the food reserves through PPP • Food Safety Net • Innovative adoption of Food Coupons, Food Stamps, Food Credit Cards Direct Cash Transfer
  • 32. Calories(kc) Protein (gms) Fats (gms) Year NSSO Round Rural Urban Rural Urban Rural Urban 1983 38 2,240 2,070 63.5 58.1 27.1 37.1 1987-88 43 2,233 2,095 63.2 58.6 28.3 39.3 1993-94 50 2,153 2,073 60.3 57.7 31.1 41.9 1999-2000 55 2,148 2,155 59.1 58.4 36.0 49.6 2000-01 56 2,083 2,027 56.8 55.3 34.6 46.1 2001-02 57 2,018 1,982 54.8 54.2 33.6 46.1 2002 58 2,025 2,014 55.4 54.9 34.7 47.0 2003 59 2,106 2,020 58.0 55.5 36.4 46.7 2004 60 2,087 2,036 56.9 55.9 35.5 46.8 2004-05 61 2,047 2,021 55.8 55.4 35.4 47.4 Source: Deaton and Dreze (2009) Mean per capita consumption of calories, protein and fats (per day) Performance in terms of nutrition indicators
  • 33. 1850 1900 1950 2000 2050 2100 2150 2200 2250 2300 38 43 50 55 56 57 58 59 60 61 Calories(kc/day) NSS rounds Calories intake Rural Urban 48 50 52 54 56 58 60 62 64 66 38 43 50 55 56 57 58 59 60 61 Proteins(grams/day) NSS round Protein intake Rural Urban 0 10 20 30 40 50 60 38 43 50 55 56 57 58 59 60 61 Fats(Grams/day) NSS round Fat intake Rural Urban Mean per capita consumption of calories, protein and fats (per day)
  • 34. Undernutrition in India (%) Nutrition indicators NFHS I (1998-99) NFHS II (2005-06) Per cent change Stunting (children < 3 age) 51 45 -11.76 Underweight (Children < 3 age) 43 40 -6.98 Vitamin A deficiency (Children < 5 age) NA 57 --- Anemia (Children 6-35 months) 74 79 6.76 Women with Anemia 52 56 7.69 Men with Anemia --- 24 --- Source: National Family Health Survey (2005-06) Almost one in two Indian children is stunted and 40 percent are underweight. One-third of all Indian women are underweight Rates of micronutrient deficiencies are extremely high, with almost 80 percent of children and 56 percent of women being anemic
  • 35. • Consumption of nutrient rich indigenous foods such as Ragi • Dissemination of food and nutrition information to consumers • Assessment and monitoring of the nutritional status of school children and adolescents and create awareness on healthy diets STRATEGIES
  • 36. AGRICULTURE TO IMPROVE NUTRITION SECURITY? Leveraging Existing Platforms Improving Economic and Physical Access to High- Quality, Nutrient-Rich Diets Improve access to nutrient-rich foods Biofortification of staple crops Leveraging Agriculture to Empower Women and Strengthen Their Capacity to Care for Themselves and Young Children
  • 38.
  • 39.
  • 40. Three main policy pillar • Bolsa Família • Alimentação Escolar • The Fortalecimento da Agricultura Familiar SUCCESSFUL EXAMPLES
  • 41. In 2009 it was estimated that 20 million Brazilians climbed out of poverty following the implementation of this policy. There were 15.4% of Brazilians living in poverty in 2009, compared to 27.8% in 1999. The country has thus attained the Millennium Development Goal of halving poverty. Food security has improved overall: in 2009, 30.2% of households were food insecure (34.8% in 2004). Early childhood malnutrition fell by 61% between 2003 and 2009
  • 42. LESSONS FROM BRAZIL • Decentralize purchasing • Procurement of coarse cereals and millets • Convergence of social protection schemes with national flagship programme. • A unified database similar to the Cadastro Único to promote effective and standardized targeting across schemes • India can start an in-depth study of the mechanisms of cash transfers, and pilot the program in willing, better connected areas
  • 43. Government strategies Availability Production Access Affordability •Food reserve and stocks (>80 million ton) •500 thousand fair price shops •Mahatma Gandhi National Rural Employment Guarantee Program •Direct Cash Transfer •Subsidized food to people BPL •Food Security act (Right to Food) •Food Security Mission • RKVY •Subsidy in fertilizer and irrigation •MSP and assured procurement
  • 44. 23-Aug-17 44 National Food Security Mission •NFSM was launched in Aug,2007 by GOI with an aim of achieving an additional production of 10,8 and 2 million tonnes of paddy, wheat and pulses respectively by the end of 2011-12. •A sum of Rs. 3381 crore has been spent till 31March, 2011. Economic survey, 2013
  • 45. Mid Day Meal Scheme •100 million school children are eligible for hot meal; 50 million are getting the meals; of which 27 million also get the “4-in-one health package.” •The scheme does not provide meals to those who does not attend the school.
  • 46. 46 2007-08 2008-09 2009-10 2010-11 2011-12 Growth in GDP for Agriculture and allied Sectors (%), base year 2004-05 5.8 0.1 0.8 7.9 3.6 Source:-Economic Survey,2013 Rashtriya Krishi Vikas Yojana •Started in 2007-08 for incentivizing states to enhance public investment to achieve 4% growth rate in agriculture and allied sectors during the 11th five year plan. During 2007-11 an amount of Rs.14598 was released.
  • 47. 47 • 10th September, 2013 with the objective to provide for food and nutritional security in human life cycle approach, by ensuring access to adequate quantity of quality food at affordable prices to people to live a life with dignity. •50% of urban and 75% of rural population be covered under Act. •Guarantees providing 5 kg food grain per person per month at a subsidised rate to 67% of the country's population. •82 crore people in both urban and rural areas. •Food grains would include rice, wheat and millet at Rs.3, Rs.2 and Rs.1 per kg, respectively. National Food Security Act 2013
  • 48. States with increased requirement as per NFSB (lakh tonne) Present TDPS allocation (2010-11) Likely TDPS requirement (As per NFSB) Increase Uttara Pradesh 63.41 93.92 30.51 Bihar 33.83 59.23 25.40 Madhya Pradesh 24.02 37.77 13.75 Rajasthana 17.83 29.08 11.25 Maharashtra 40.87 48.71 7.84 West Bengal 32.97 37.87 4.90 Karnataka 20.71 24.78 4.07 Jharkhand 12.41 16.34 3.93 Orissa 21.19 24.53 3.34 Haryana 6.14 8.75 2.61 Chattisgarh 10.92 13.39 2.47 Punjab 7.45 8.88 1.43 Gujarath 1.08 1.21 0.13 Total 309.93 428.87 118.94 Source: Kumar, 2012 0 10 20 30 40 50 60 70 80 90 100 Present TDPS As per NFSB
  • 49. 2011-12 (billion Rs.) 2012-13 (billion Rs.) Without NFSB 957.87 1097.96 With NFSB 988.42 1122.20 Existing allotment under TDPS (2010-11) 42.79 mt Storage Total capacity with FCI (15/01/12) 33.40 mt Storage capacity with state agencies(31/03/2011) 30.33 mt Total storage capacity 63.73 mt Proposed storage capacity 15.12 mt Food subsidy Storage capacity requirement under NFSB
  • 50. Case study • Role of Agricultural Extension in Improving Food Security of Rural Households of Hamedan Province, Iran • Mehdi Mohamadian Jadval Ghadam (2012) • Food availability situation, most of the farmers (40.6) have stated that the situation of food availability is in moderate level and only 12.8 percent have believed that it is completely appropriate • In regarding the role of agricultural education in improving food security of rural households, findings indicate that most of the farmers (44.4 percent) have mentioned that agricultural education has a moderate role in improving food security, while 34.2 percent has believed that it is little
  • 51. Work from our division • Livelihood security of rural area: a critical analysis by Smitha baby (2005). • In this study, the food security was operationalised as availability and access to balanced food at household level. It was studied as a component of livelihood security scale. • Food security of the labor class was very poor as the majority (70%) household was found to be food insecure. 22 per cent of the marginal farmers were having low food security index .
  • 52.
  • 53. SUGGESTIONS • Small farms can be helped in increasing productivity by having access to extension services and better water management. Sustainable agriculture should be the focus of interventions. • Local knowledge and local seeds can be used for biodiversity. Organic farming can also be encouraged to protect the environment and generate higher incomes for small farmers. • Urban agriculture can improve food security in urban areas. Homegrown food can also be encouraged as it would contribute to food security and nutrition as well as freeing incomes for non-food expenses such as health and education. ate higher incomes for small farmers. • Project GOAL empowers communities through health literacy and connects rural communities with the government health and nutrition services available.
  • 54. • Focus on areas likely to be affected by climate change. • Group approach to realize economies of scale in buying inputs and marketing outputs. One important problem in India is marketing of agricultural production. • Using information technology for agricultural production and marketing. • Purchasing locally grown food from low income and small holder farmers to benefit their families and communities. • Micro nutrient programme is another area of intervention. For example, Vitamin A tablets alone have prevented many deaths. Vitamin A and food fortification like salt iodization are an integral part of food security programmes. • In order to improve delivery systems in food based programmes there is a need to strengthen programmes like ICDS with the covnvergence of several departments. International agencies can help in this convergence as a pilot project to improve the delivery systems.
  • 55. WAY FORWAD • Freedom from hunger is not only a basic human right: it is essential for the full enjoyment of other rights, such as health, education, information etc. • Innovative strategic interventions are the needs of the hour to ensure food availability, food access and utilization of food • India will not have problem of Cereals availability in the long run (2020-21) and will have shortage of Pulse and Oilseed production if adequate steps are not taken by the Government of India. • Due to changes in consumption patterns, demand for non-cereal food has been increasing. So, need to focus on crop diversification and improve allied activities
  • 56.  There are many deficit areas in agriculture need to be focus  Investment on infrastructure  Soil and water management  Research  Market reforms  Nutrition component needs a multi-disciplinary approach covering diet diversification including micronutrients, women’s empowerment, education, health, safe drinking water, sanitation and hygiene  Nutrition improvement should combine a rights based approach and nutrition education. “There are people in the world so hungry, that God cannot appear to them except in the form of bread.” Mahatma Gandhi