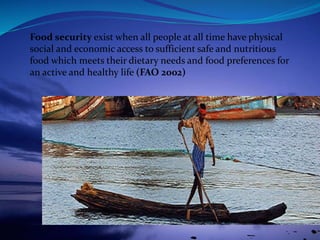
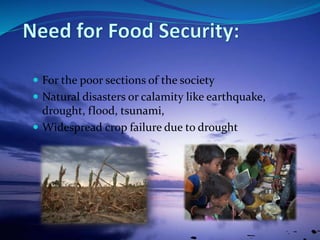
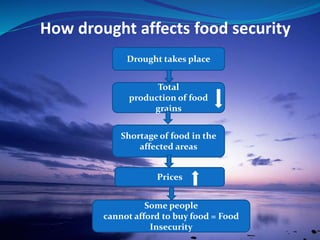
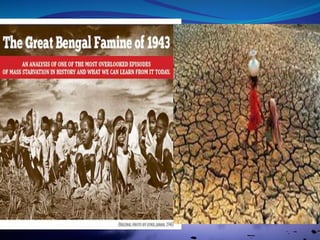
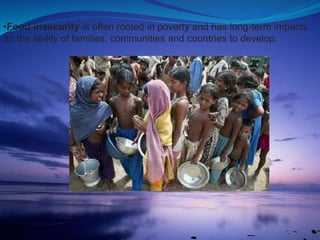
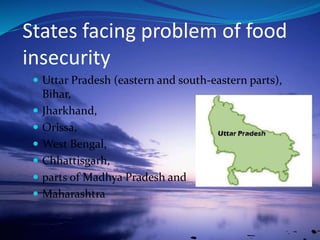
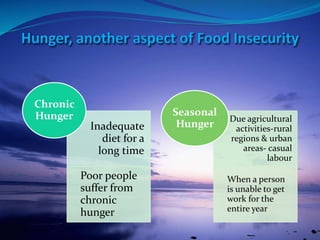
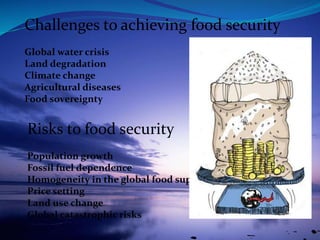
SESSION:- 2016-2017
PRESENTATION ON
FOOD SECURITY
GUIDED BY:- SUBMITTED BY:-
AYUSHI MAM AAYUSH MENON
Food security exist when all people at all time have physical
social and economic access to sufficient safe and nutritious
food which meets their dietary needs and food preferences for
an active and healthy life (FAO 2002)
Food security means :
 Availability,
Accessibility and
Affordability of food to all people at times.
 Enough food is available for all the persons
 All persons have the capacity to buy food of acceptable
quality and
 There is no barrier on access to food.
Food Security is ensured in a country
only if
 For the poor sections of the society
 Natural disasters or calamity like earthquake,
drought, flood, tsunami,
 Widespread crop failure due to drought
How drought affects food security
Drought takes place
Total
production of food
grains
Shortage of food in the
affected areas
Prices
Some people
cannot afford to buy food = Food
Insecurity
If such calamity happens in a very wide spread
area or is stretched over a longer time
period, it may cause a situation of starvation.
STARVATION
 A massive starvation might take a turn of
famine.
 A Famine is characterized by
1. widespread deaths and
2. epidemics
Famine
 Bengal Famine, 1943
-killed 1.5 million to 3 million
 The Bihar famine, 1966-7
- 2,353 deaths due to starvation reported
Starvation deaths have also been reported in:
1. Kalahandi and Kashipur in Orissa
2. Baran district of Rajasthan,
3. Palamau district of Jharkhand
and many other remote areas during the recent
years.
Famines and Starvation Deaths in
India
•Food insecurity is often rooted in poverty and has long-term impacts
on the ability of families, communities and countries to develop.
Worst Affected Groups:
 landless people
 traditional artisans
 traditional services providers
 petty self-employed workers
 Homeless, beggars etc.
 Families employed in ill-paid occupations
 casual labourers (seasonal activities+ very low
wages)
Food Insecure Groups
 Uttar Pradesh (eastern and south-eastern parts),
Bihar,
 Jharkhand,
 Orissa,
 West Bengal,
 Chhattisgarh,
 parts of Madhya Pradesh and
 Maharashtra
States facing problem of food
insecurity
Inadequate
diet for a
long time
Poor people
suffer from
chronic
hunger
Chronic
Hunger Due agricultural
activities-rural
regions & urban
areas- casual
labour
When a person
is unable to get
work for the
entire year
Seasonal
Hunger
Current status
Nearly 800 million people across the globe go to bed
hungry every night.
To meet the needs of a world population expected to reach
9 billion by 2050, agricultural production will need to
increase by at least 60 percent.
India’s poor population amounts to
more than 300 million people, with
almost 30 percent of India’s rural
population living in poverty.
The good news is, poverty has been on
the decline in recent years.
According to official government of
India estimates, poverty declined from
37.2% in 2004-05 to 29.8% in 2009-10.
The Global Hunger Index (GHI) is a multidimensional statistical tool
used to describe the state of countries' hunger situation.
The GHI measures progress and failures in the global fight
against hunger.
India is home to 25 percent of the world’s hungry population.
An estimated 43 per cent of children under the age of five years
are malnourished (WFP 2012)
It has the world’s largest area
under cultivation for wheat, rice,
and cotton, and is the world’s
largest producer of milk, pulses,
and spices (World Bank 2014).
Rural poverty declined by 8 percentage points from 41.8% to 33.8% and
urban poverty by 4.8 percentage points from 25.7% to 20.9% over the
same period (World Bank 2012).
Agricultural Production 2007 2008 2009 2010
Rice Production
144,570,000
MT
148,036,000
MT
135,673,000
MT
143,963,000
MT
Wheat Production
75,806,700
MT
78,570,200
MT
80,680,000
MT
80,710,000
MT
Maize Production
18,955,400
MT
19,731,400
MT
16,719,500
MT
21,725,800
MT
Soybean Production
10,968,000
MT
9,905,000
MT
10,217,000
MT
12,736,000
MT
Agricultural Exports 2006 2007 2008 2009
Rice Exports
4,739,872
MT
6,450,062
MT
2,484,275
MT
2,148,040
MT
Wheat Exports 46,633 MT 237.00 MT 1,121 MT 29.00 MT
Maize Exports 637,411 MT
2,727,715
MT
3,537,303
MT
2,600,821
MT
Soybean Exports 3,528 MT 7,460 MT 44,838 MT 24,699 MT
Agricultural Imports 2005 2006 2007 2008
Rice Imports 256.00 MT 162.00 MT 145.00 MT 85.00 MT
Wheat Imports 37,760 MT 6,079,560 MT 2,677,830 MT 20.00 MT
Maize Imports 1,632 MT 2,000 MT 4,273 MT 7,280 MT
Soybean Imports 2.00 MT 336.00 MT 29.00 MT 38.00 MT
Food Security Indicators
Calorie Supply Per Capita,
Receipts of Food Aid (cereals)
Calorie supply per capita is amount of food
available for consumption, measured in kilocalories per
capita per day.
This figure is reached by dividing the total available
food supply for human consumption by the population.
This dataset tracks the calorie supply per capita in
each country for calories available from crop products.
Although these figures can be taken as average supply
available for consumption, actual consumption by
individuals can vary greatly.
Highest
Growth
Punjab and
Haryana
Tamil Nadu
and Andhra
Pradesh
Low
Growth
Maharashtra,
Madhya
Pradesh
Bihar, Orissa
and the N-E
states
India’s attempts at attaining
Food Security
Green Revolution: Food grain Production
Buffer
Stock
Public
Distributi
on System
Food
Security
System of
India
India’s Food Security System
Government schemes
 PDS (initial Public Distribution System scheme)
 RPS (Revamped Public Distribution System)
 TPDS (Targeted Public Distribution System)
Special Schemes:
 AAY (Antyodaya Anna Yojana)
 APS (Annapurna Scheme)
Benefits from the PDS:
 Stabilizes prices of foodgrains
 Makes food available at affordable prices
 By supplying food from surplus regions of the
country to the deficit ones, it helps in combating
hunger and famine
 Prices set with poor households in mind
 Provides income security to farmers in certain
regions
Problems faced by PDS:
 Problem of Hunger still exists in many areas of India
 Foodstock in granaries often above specifed levels
 Deterioration in quality of stored foodgrains if kept
for longer time
 High storage costs
 Increase in MSP has led to shift from coarse grain to
rice and wheat production among the farmers
 Cultivation of rice has also led to environmental
degradation and fall in the water level
 Average consumption of PDS grain at the all-
India level is very low
 Malpractices on part of PDS dealers:
 Diverting the grains to open market to get better
margin,
 Selling poor quality grains at ration shops,
 Irregular opening of the shops
 Low Income families earning just above poverty
line have to pay APL rates which are almost equal
to open market rates – lower incentive to buy
from Fair Price Shops
Challenges to achieving food security
Global water crisis
Land degradation
Climate change
Agricultural diseases
Food sovereignty
Risks to food security
Population growth
Fossil fuel dependence
Homogeneity in the global food supply
Price setting
Land use change
Global catastrophic risks
It took great help of our economic
book & some help of internet , my
friends & subject teacher .
Foodsecurity 161203132650

Foodsecurity 161203132650

  • 1.
    SESSION:- 2016-2017 PRESENTATION ON FOODSECURITY GUIDED BY:- SUBMITTED BY:- AYUSHI MAM AAYUSH MENON
  • 3.
    Food security existwhen all people at all time have physical social and economic access to sufficient safe and nutritious food which meets their dietary needs and food preferences for an active and healthy life (FAO 2002)
  • 4.
    Food security means:  Availability, Accessibility and Affordability of food to all people at times.
  • 5.
     Enough foodis available for all the persons  All persons have the capacity to buy food of acceptable quality and  There is no barrier on access to food. Food Security is ensured in a country only if
  • 6.
     For thepoor sections of the society  Natural disasters or calamity like earthquake, drought, flood, tsunami,  Widespread crop failure due to drought
  • 7.
    How drought affectsfood security Drought takes place Total production of food grains Shortage of food in the affected areas Prices Some people cannot afford to buy food = Food Insecurity
  • 8.
    If such calamityhappens in a very wide spread area or is stretched over a longer time period, it may cause a situation of starvation. STARVATION
  • 9.
     A massivestarvation might take a turn of famine.  A Famine is characterized by 1. widespread deaths and 2. epidemics Famine
  • 10.
     Bengal Famine,1943 -killed 1.5 million to 3 million  The Bihar famine, 1966-7 - 2,353 deaths due to starvation reported Starvation deaths have also been reported in: 1. Kalahandi and Kashipur in Orissa 2. Baran district of Rajasthan, 3. Palamau district of Jharkhand and many other remote areas during the recent years. Famines and Starvation Deaths in India
  • 12.
    •Food insecurity isoften rooted in poverty and has long-term impacts on the ability of families, communities and countries to develop.
  • 13.
    Worst Affected Groups: landless people  traditional artisans  traditional services providers  petty self-employed workers  Homeless, beggars etc.  Families employed in ill-paid occupations  casual labourers (seasonal activities+ very low wages) Food Insecure Groups
  • 14.
     Uttar Pradesh(eastern and south-eastern parts), Bihar,  Jharkhand,  Orissa,  West Bengal,  Chhattisgarh,  parts of Madhya Pradesh and  Maharashtra States facing problem of food insecurity
  • 15.
    Inadequate diet for a longtime Poor people suffer from chronic hunger Chronic Hunger Due agricultural activities-rural regions & urban areas- casual labour When a person is unable to get work for the entire year Seasonal Hunger
  • 16.
    Current status Nearly 800million people across the globe go to bed hungry every night. To meet the needs of a world population expected to reach 9 billion by 2050, agricultural production will need to increase by at least 60 percent.
  • 17.
    India’s poor populationamounts to more than 300 million people, with almost 30 percent of India’s rural population living in poverty. The good news is, poverty has been on the decline in recent years. According to official government of India estimates, poverty declined from 37.2% in 2004-05 to 29.8% in 2009-10.
  • 18.
    The Global HungerIndex (GHI) is a multidimensional statistical tool used to describe the state of countries' hunger situation. The GHI measures progress and failures in the global fight against hunger.
  • 20.
    India is hometo 25 percent of the world’s hungry population. An estimated 43 per cent of children under the age of five years are malnourished (WFP 2012) It has the world’s largest area under cultivation for wheat, rice, and cotton, and is the world’s largest producer of milk, pulses, and spices (World Bank 2014). Rural poverty declined by 8 percentage points from 41.8% to 33.8% and urban poverty by 4.8 percentage points from 25.7% to 20.9% over the same period (World Bank 2012).
  • 21.
    Agricultural Production 20072008 2009 2010 Rice Production 144,570,000 MT 148,036,000 MT 135,673,000 MT 143,963,000 MT Wheat Production 75,806,700 MT 78,570,200 MT 80,680,000 MT 80,710,000 MT Maize Production 18,955,400 MT 19,731,400 MT 16,719,500 MT 21,725,800 MT Soybean Production 10,968,000 MT 9,905,000 MT 10,217,000 MT 12,736,000 MT
  • 22.
    Agricultural Exports 20062007 2008 2009 Rice Exports 4,739,872 MT 6,450,062 MT 2,484,275 MT 2,148,040 MT Wheat Exports 46,633 MT 237.00 MT 1,121 MT 29.00 MT Maize Exports 637,411 MT 2,727,715 MT 3,537,303 MT 2,600,821 MT Soybean Exports 3,528 MT 7,460 MT 44,838 MT 24,699 MT
  • 23.
    Agricultural Imports 20052006 2007 2008 Rice Imports 256.00 MT 162.00 MT 145.00 MT 85.00 MT Wheat Imports 37,760 MT 6,079,560 MT 2,677,830 MT 20.00 MT Maize Imports 1,632 MT 2,000 MT 4,273 MT 7,280 MT Soybean Imports 2.00 MT 336.00 MT 29.00 MT 38.00 MT
  • 24.
    Food Security Indicators CalorieSupply Per Capita, Receipts of Food Aid (cereals) Calorie supply per capita is amount of food available for consumption, measured in kilocalories per capita per day. This figure is reached by dividing the total available food supply for human consumption by the population. This dataset tracks the calorie supply per capita in each country for calories available from crop products. Although these figures can be taken as average supply available for consumption, actual consumption by individuals can vary greatly.
  • 25.
    Highest Growth Punjab and Haryana Tamil Nadu andAndhra Pradesh Low Growth Maharashtra, Madhya Pradesh Bihar, Orissa and the N-E states India’s attempts at attaining Food Security Green Revolution: Food grain Production
  • 26.
  • 28.
    Government schemes  PDS(initial Public Distribution System scheme)  RPS (Revamped Public Distribution System)  TPDS (Targeted Public Distribution System) Special Schemes:  AAY (Antyodaya Anna Yojana)  APS (Annapurna Scheme)
  • 30.
    Benefits from thePDS:  Stabilizes prices of foodgrains  Makes food available at affordable prices  By supplying food from surplus regions of the country to the deficit ones, it helps in combating hunger and famine  Prices set with poor households in mind  Provides income security to farmers in certain regions
  • 31.
    Problems faced byPDS:  Problem of Hunger still exists in many areas of India  Foodstock in granaries often above specifed levels  Deterioration in quality of stored foodgrains if kept for longer time  High storage costs  Increase in MSP has led to shift from coarse grain to rice and wheat production among the farmers  Cultivation of rice has also led to environmental degradation and fall in the water level
  • 32.
     Average consumptionof PDS grain at the all- India level is very low  Malpractices on part of PDS dealers:  Diverting the grains to open market to get better margin,  Selling poor quality grains at ration shops,  Irregular opening of the shops  Low Income families earning just above poverty line have to pay APL rates which are almost equal to open market rates – lower incentive to buy from Fair Price Shops
  • 33.
    Challenges to achievingfood security Global water crisis Land degradation Climate change Agricultural diseases Food sovereignty Risks to food security Population growth Fossil fuel dependence Homogeneity in the global food supply Price setting Land use change Global catastrophic risks
  • 34.
    It took greathelp of our economic book & some help of internet , my friends & subject teacher .