The document provides an overview of the National Food Security Act 2013 in India. Some key points:
- The Act aims to provide food and nutritional security to people across their lifecycle by ensuring access to adequate food at affordable prices.
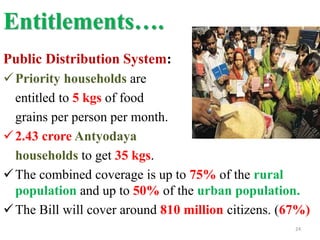
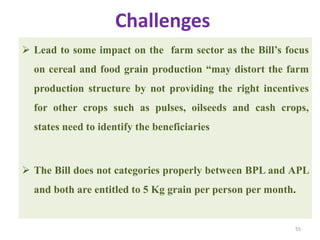
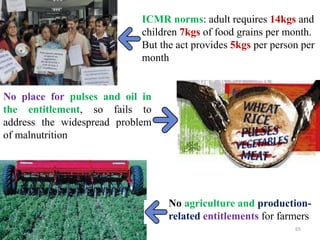
- It entitles priority households to 5kg of foodgrains per person per month and Antyodaya households to 35kg per month. In total, about 67% of the rural and 50% of the urban population are covered.
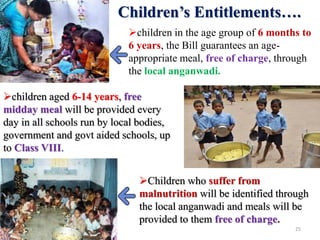
- Children aged 6 months to 6 years are entitled to an age-appropriate meal through anganwadis. Children aged 6-14 years are entitled to a free midday meal in schools.
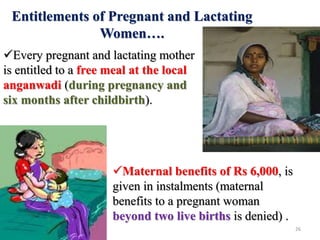
- Pregnant and