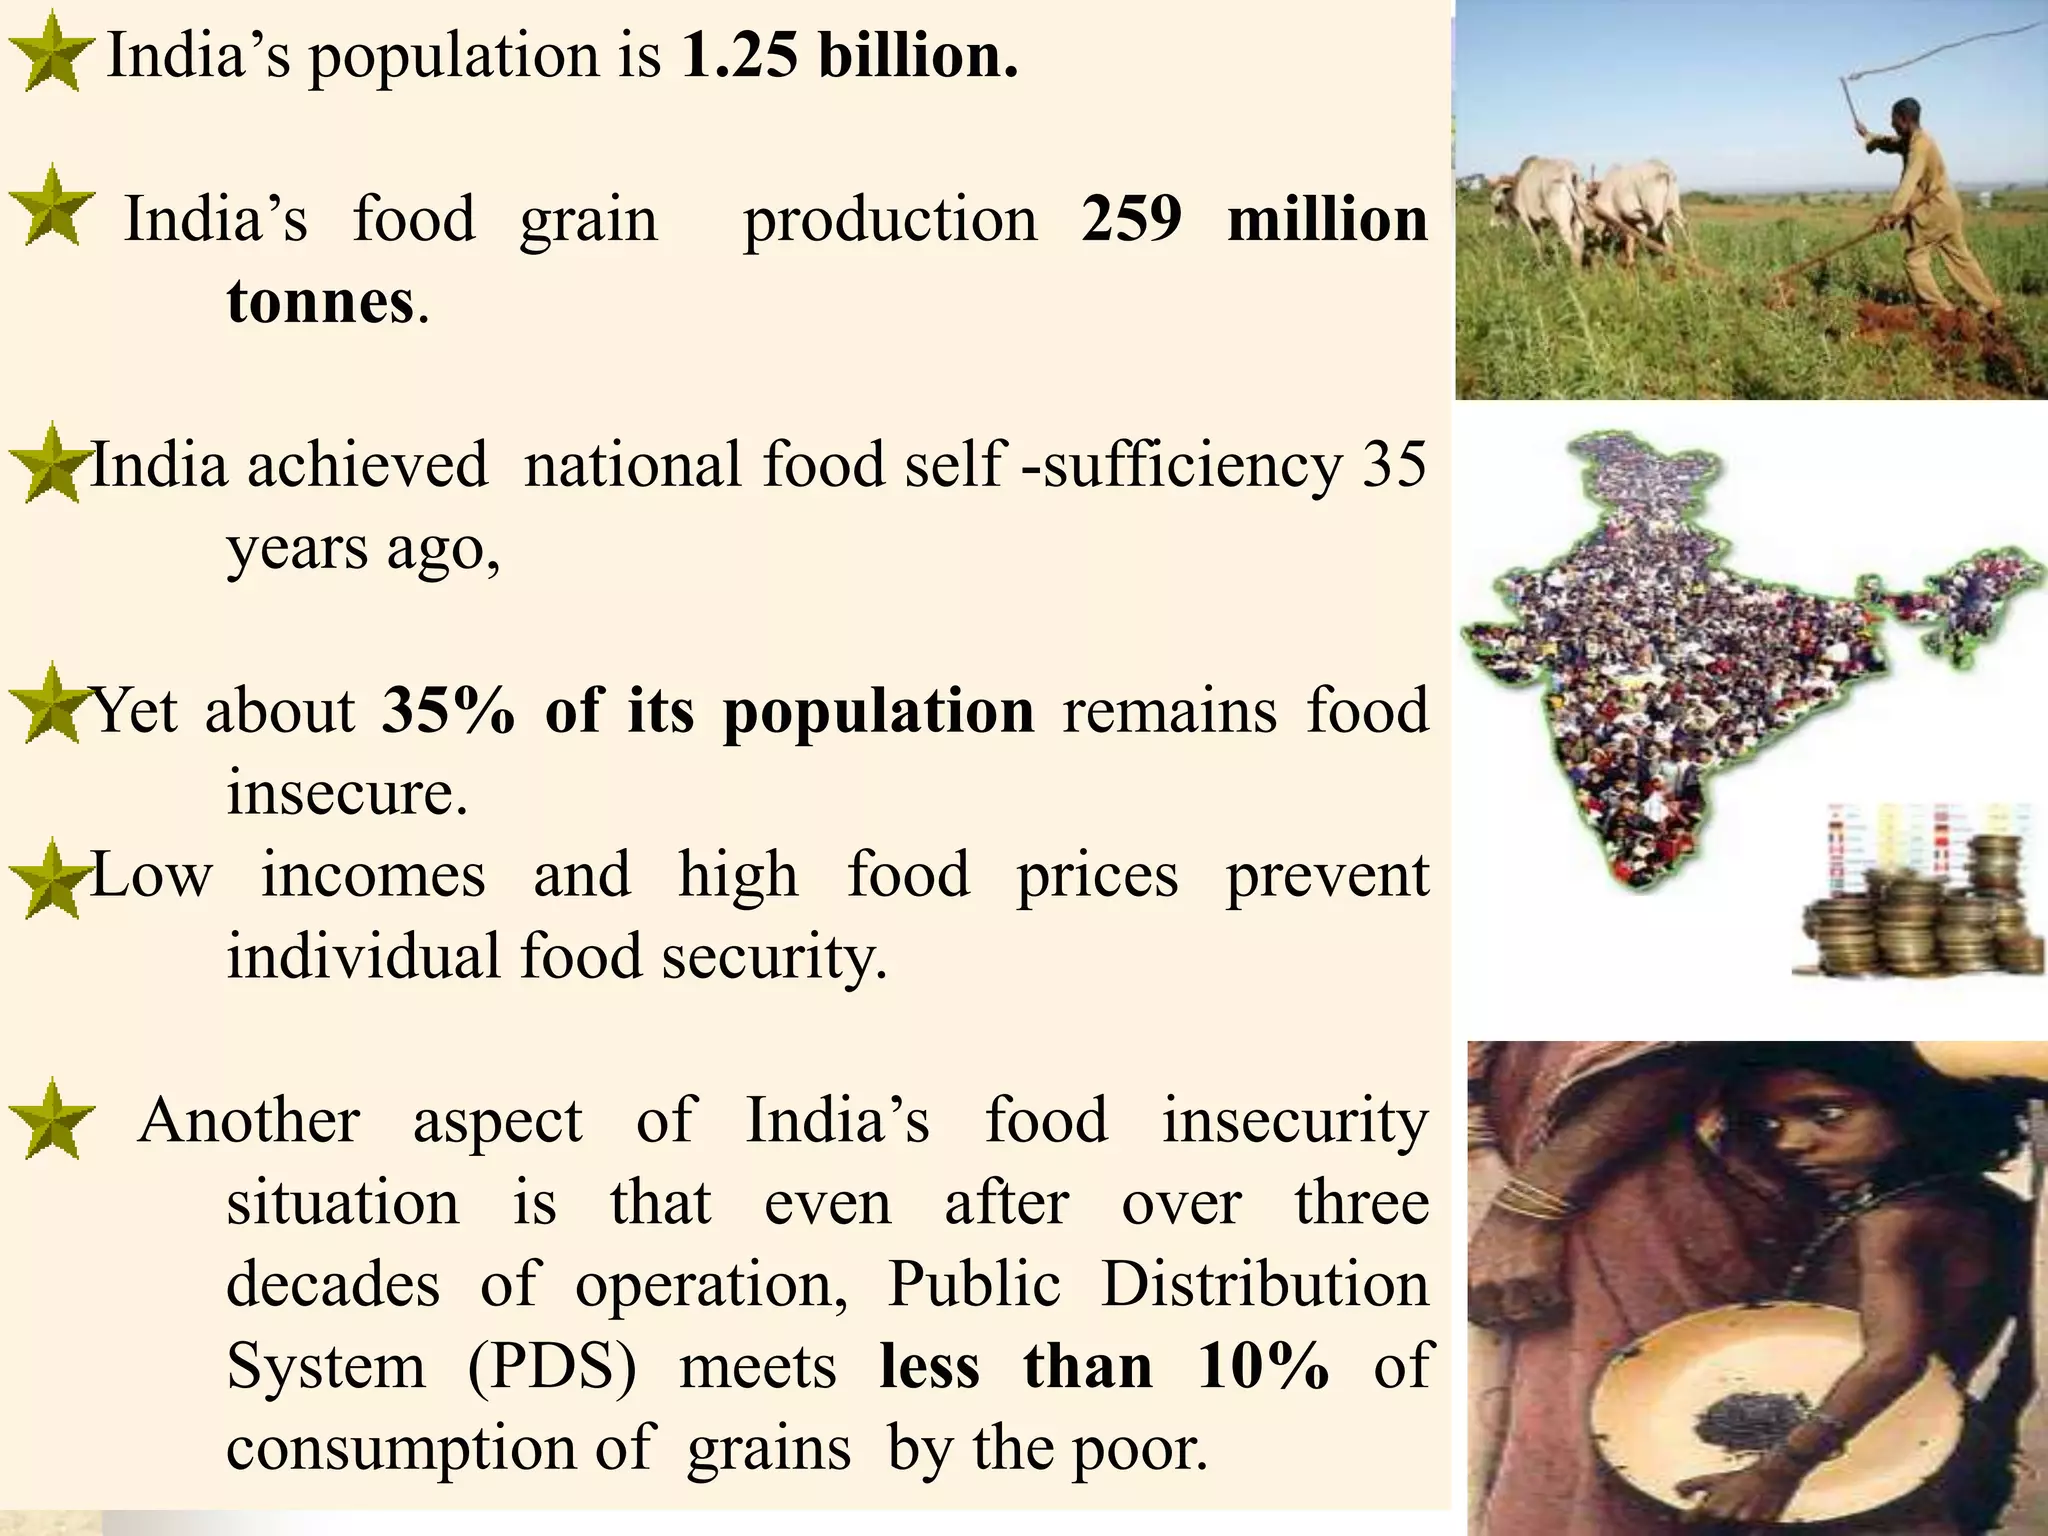
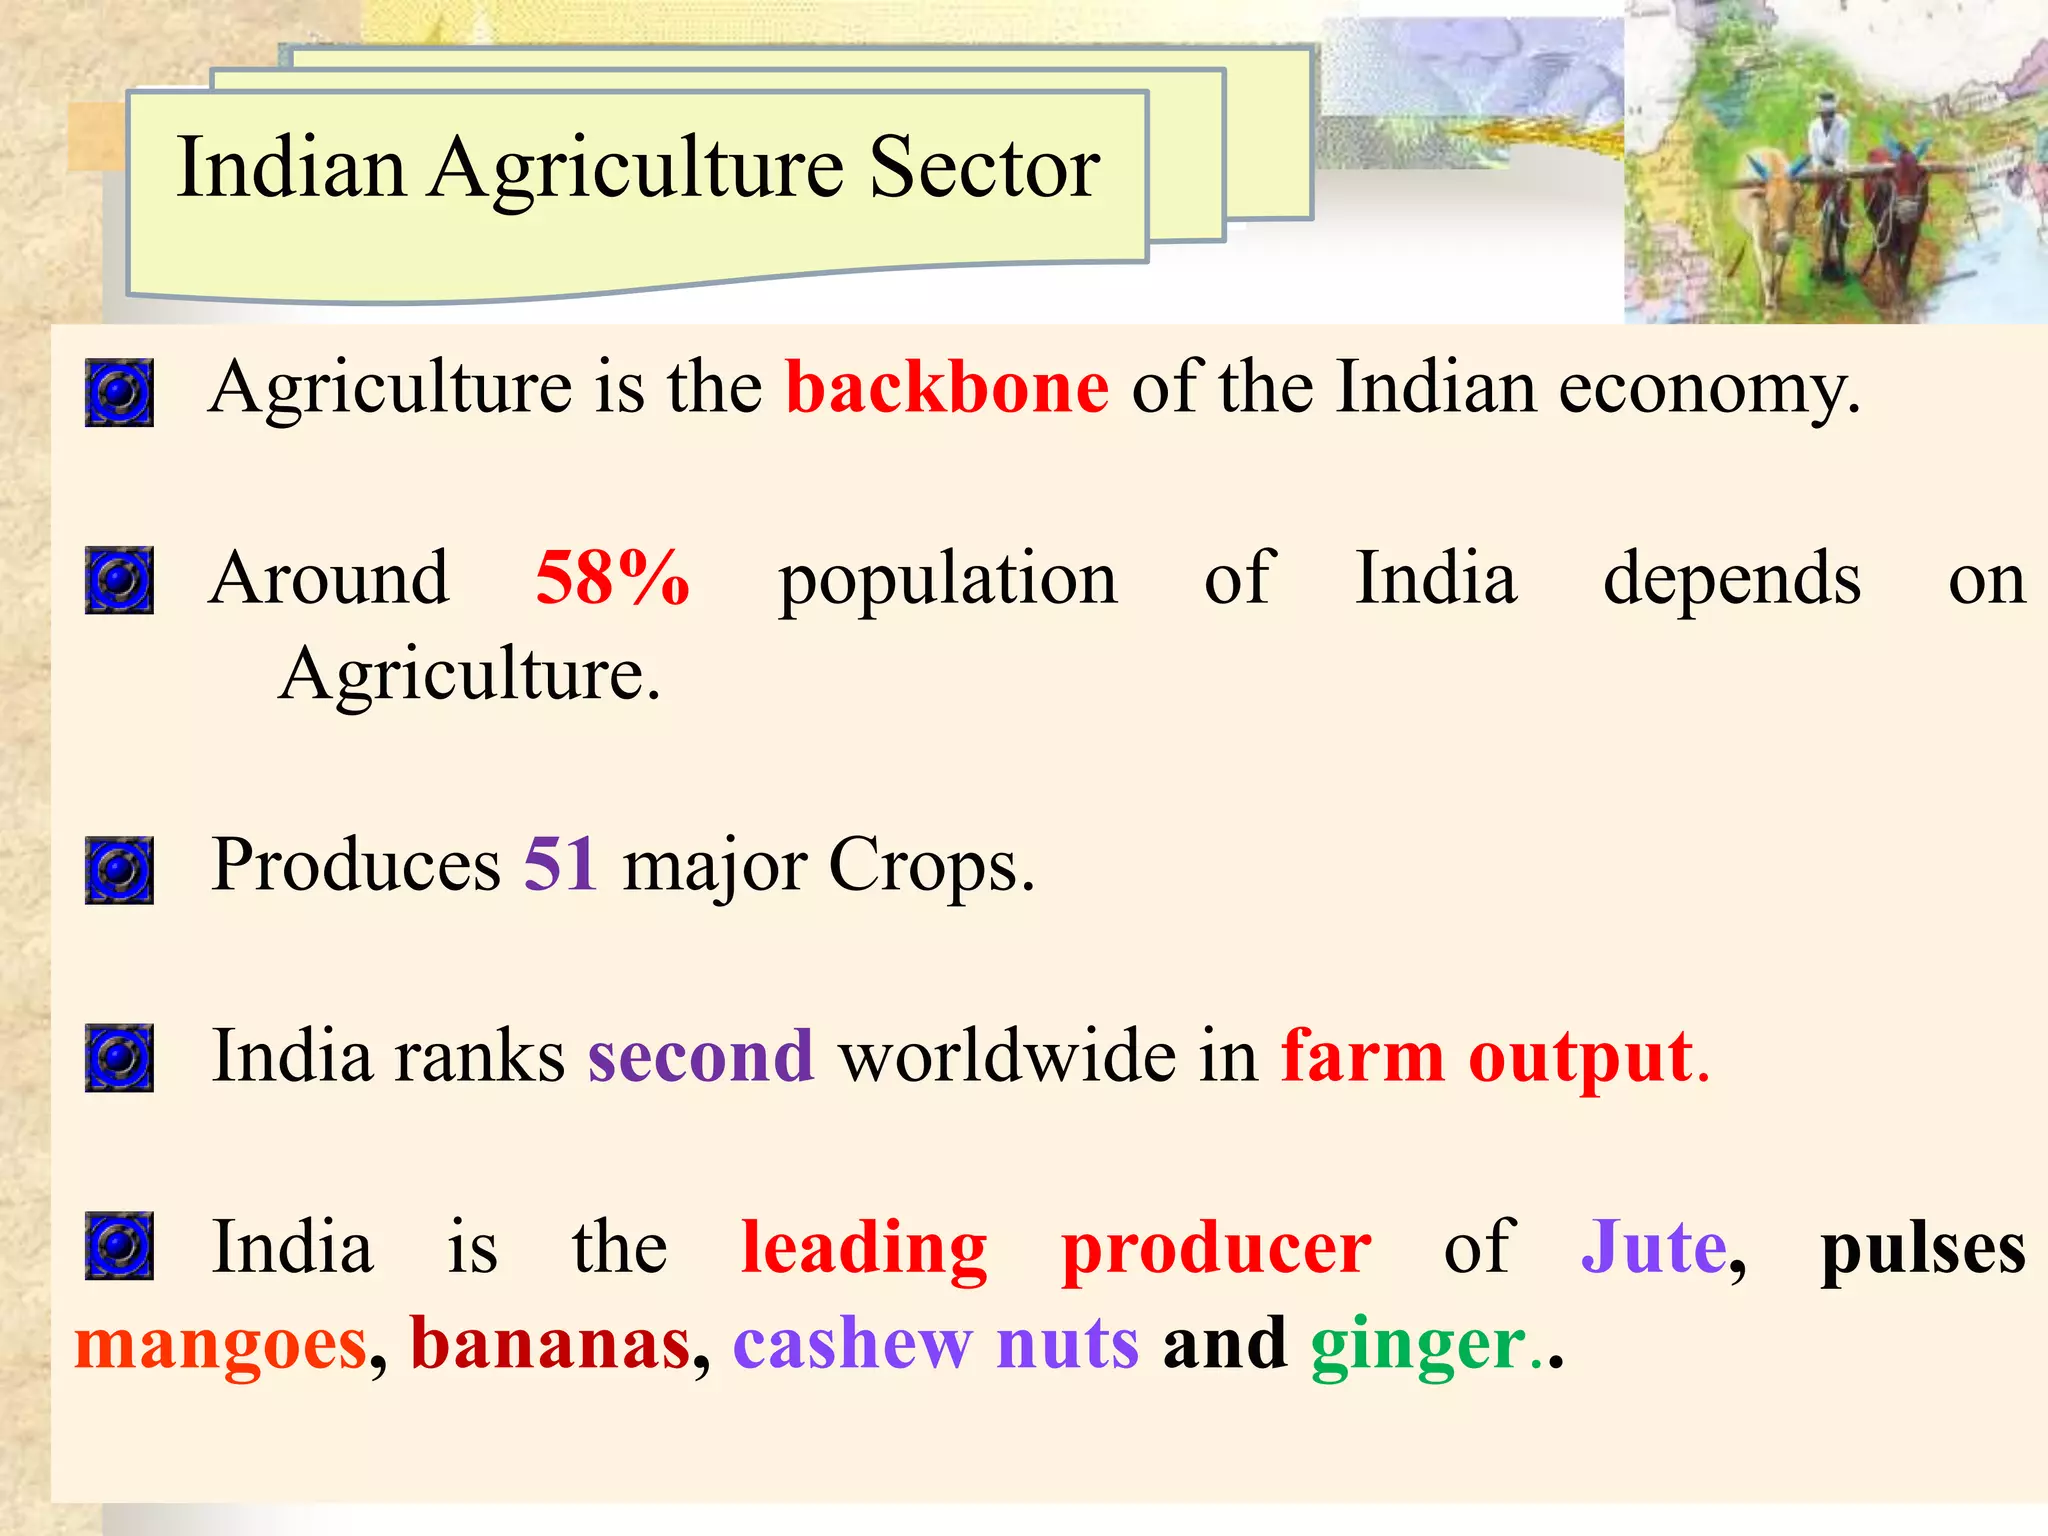
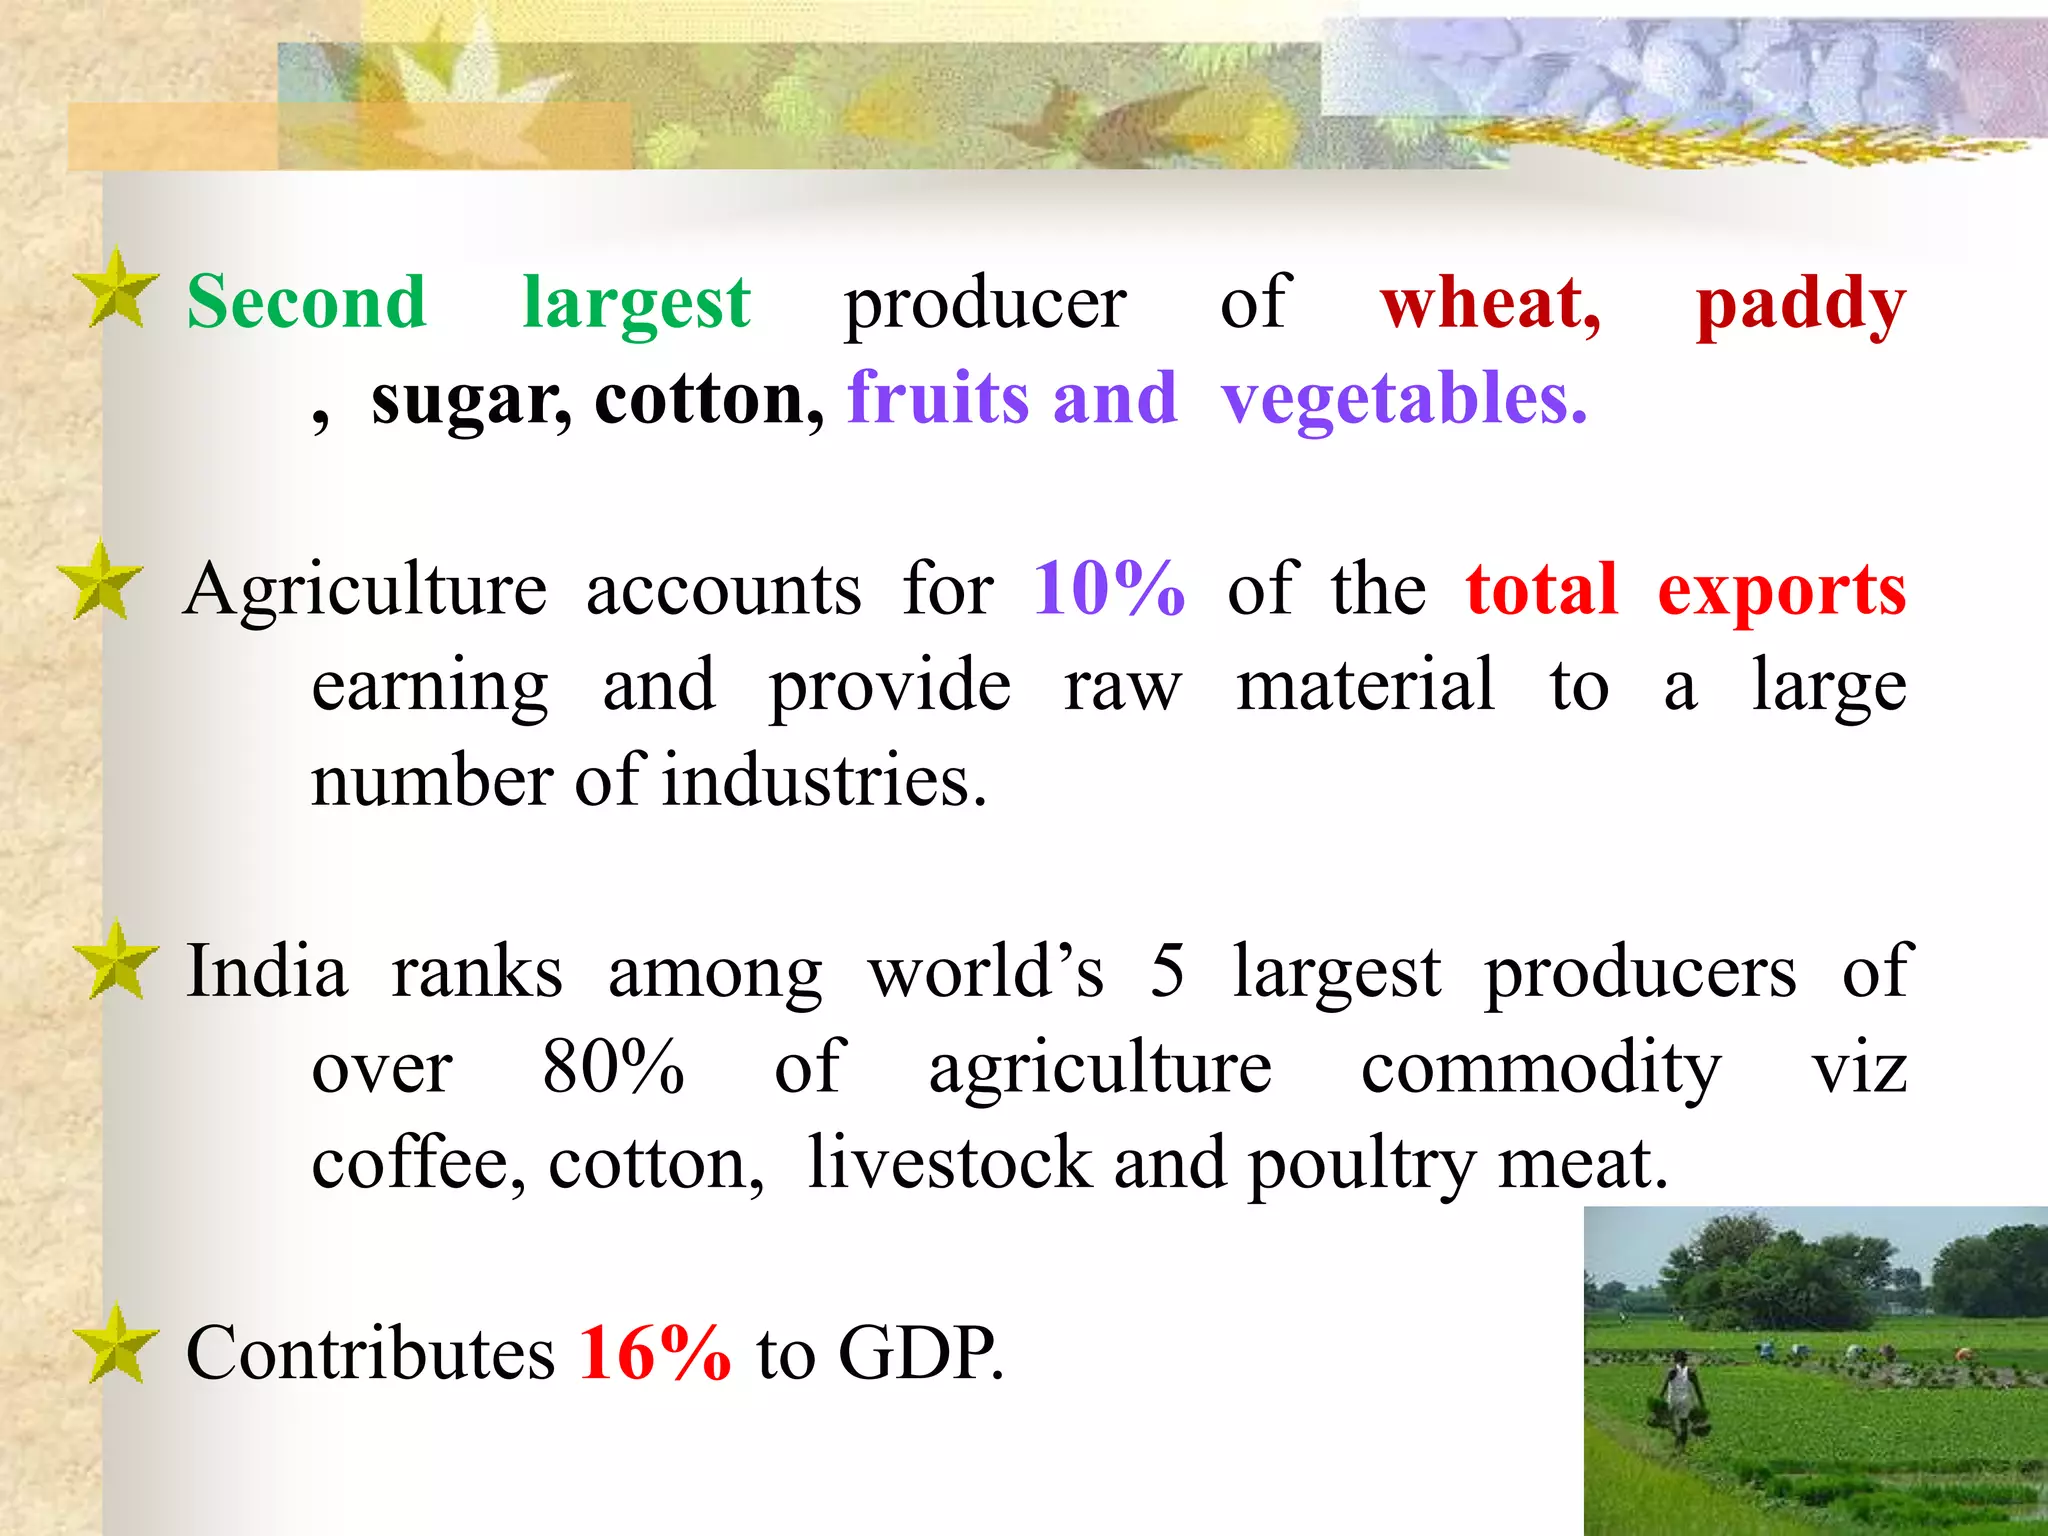
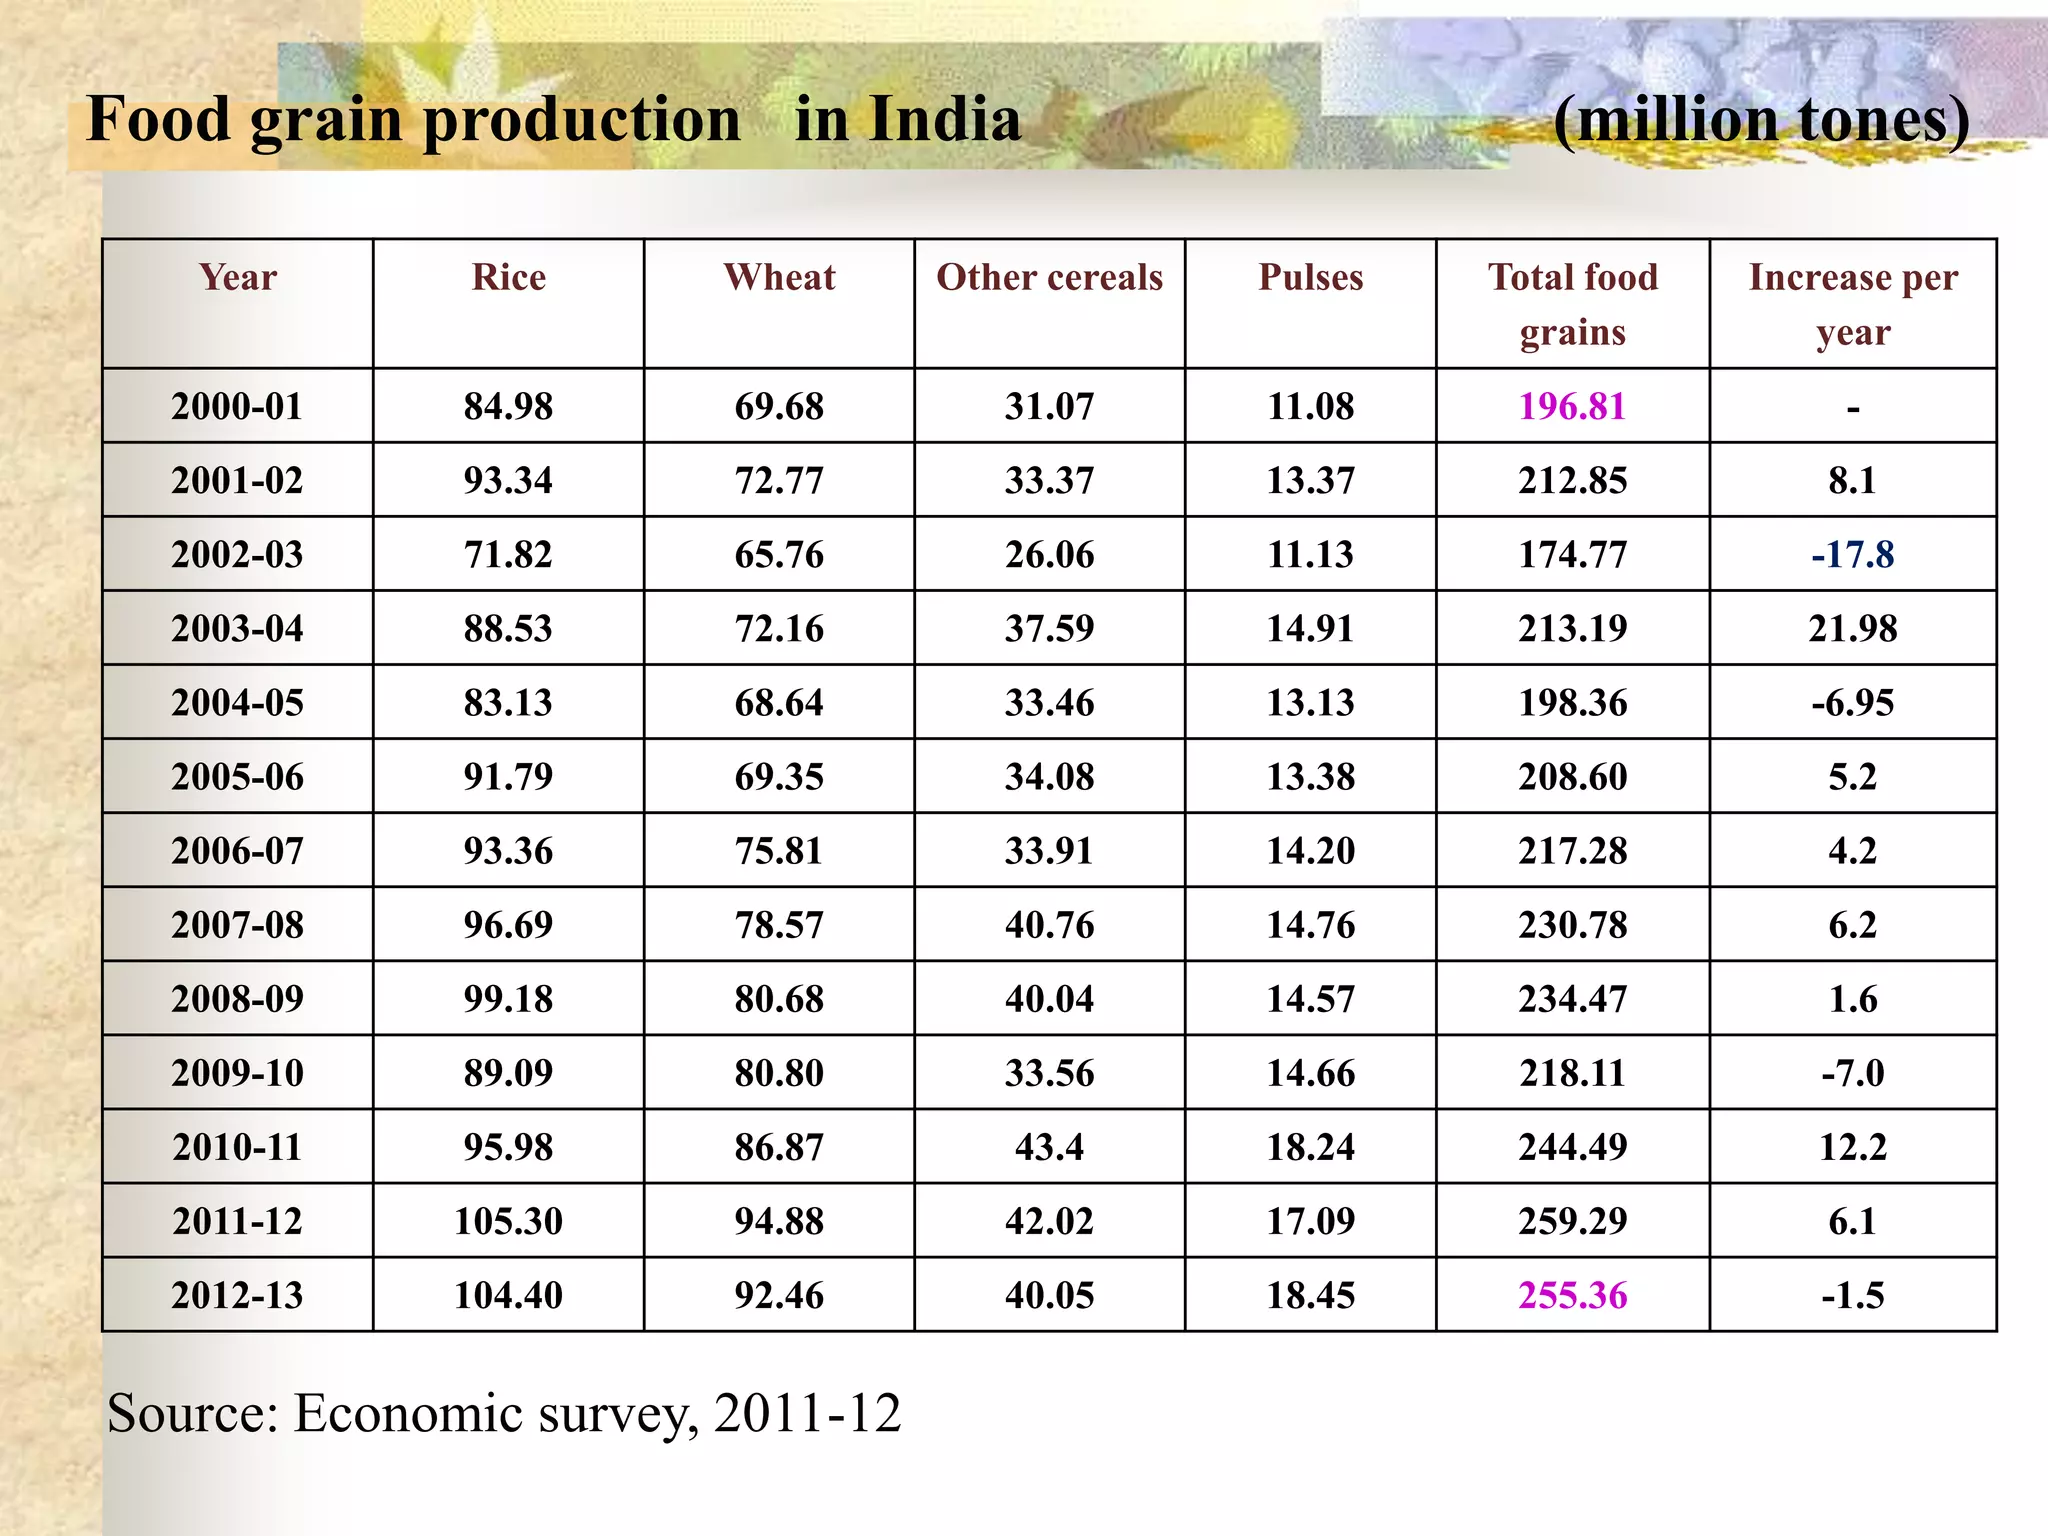
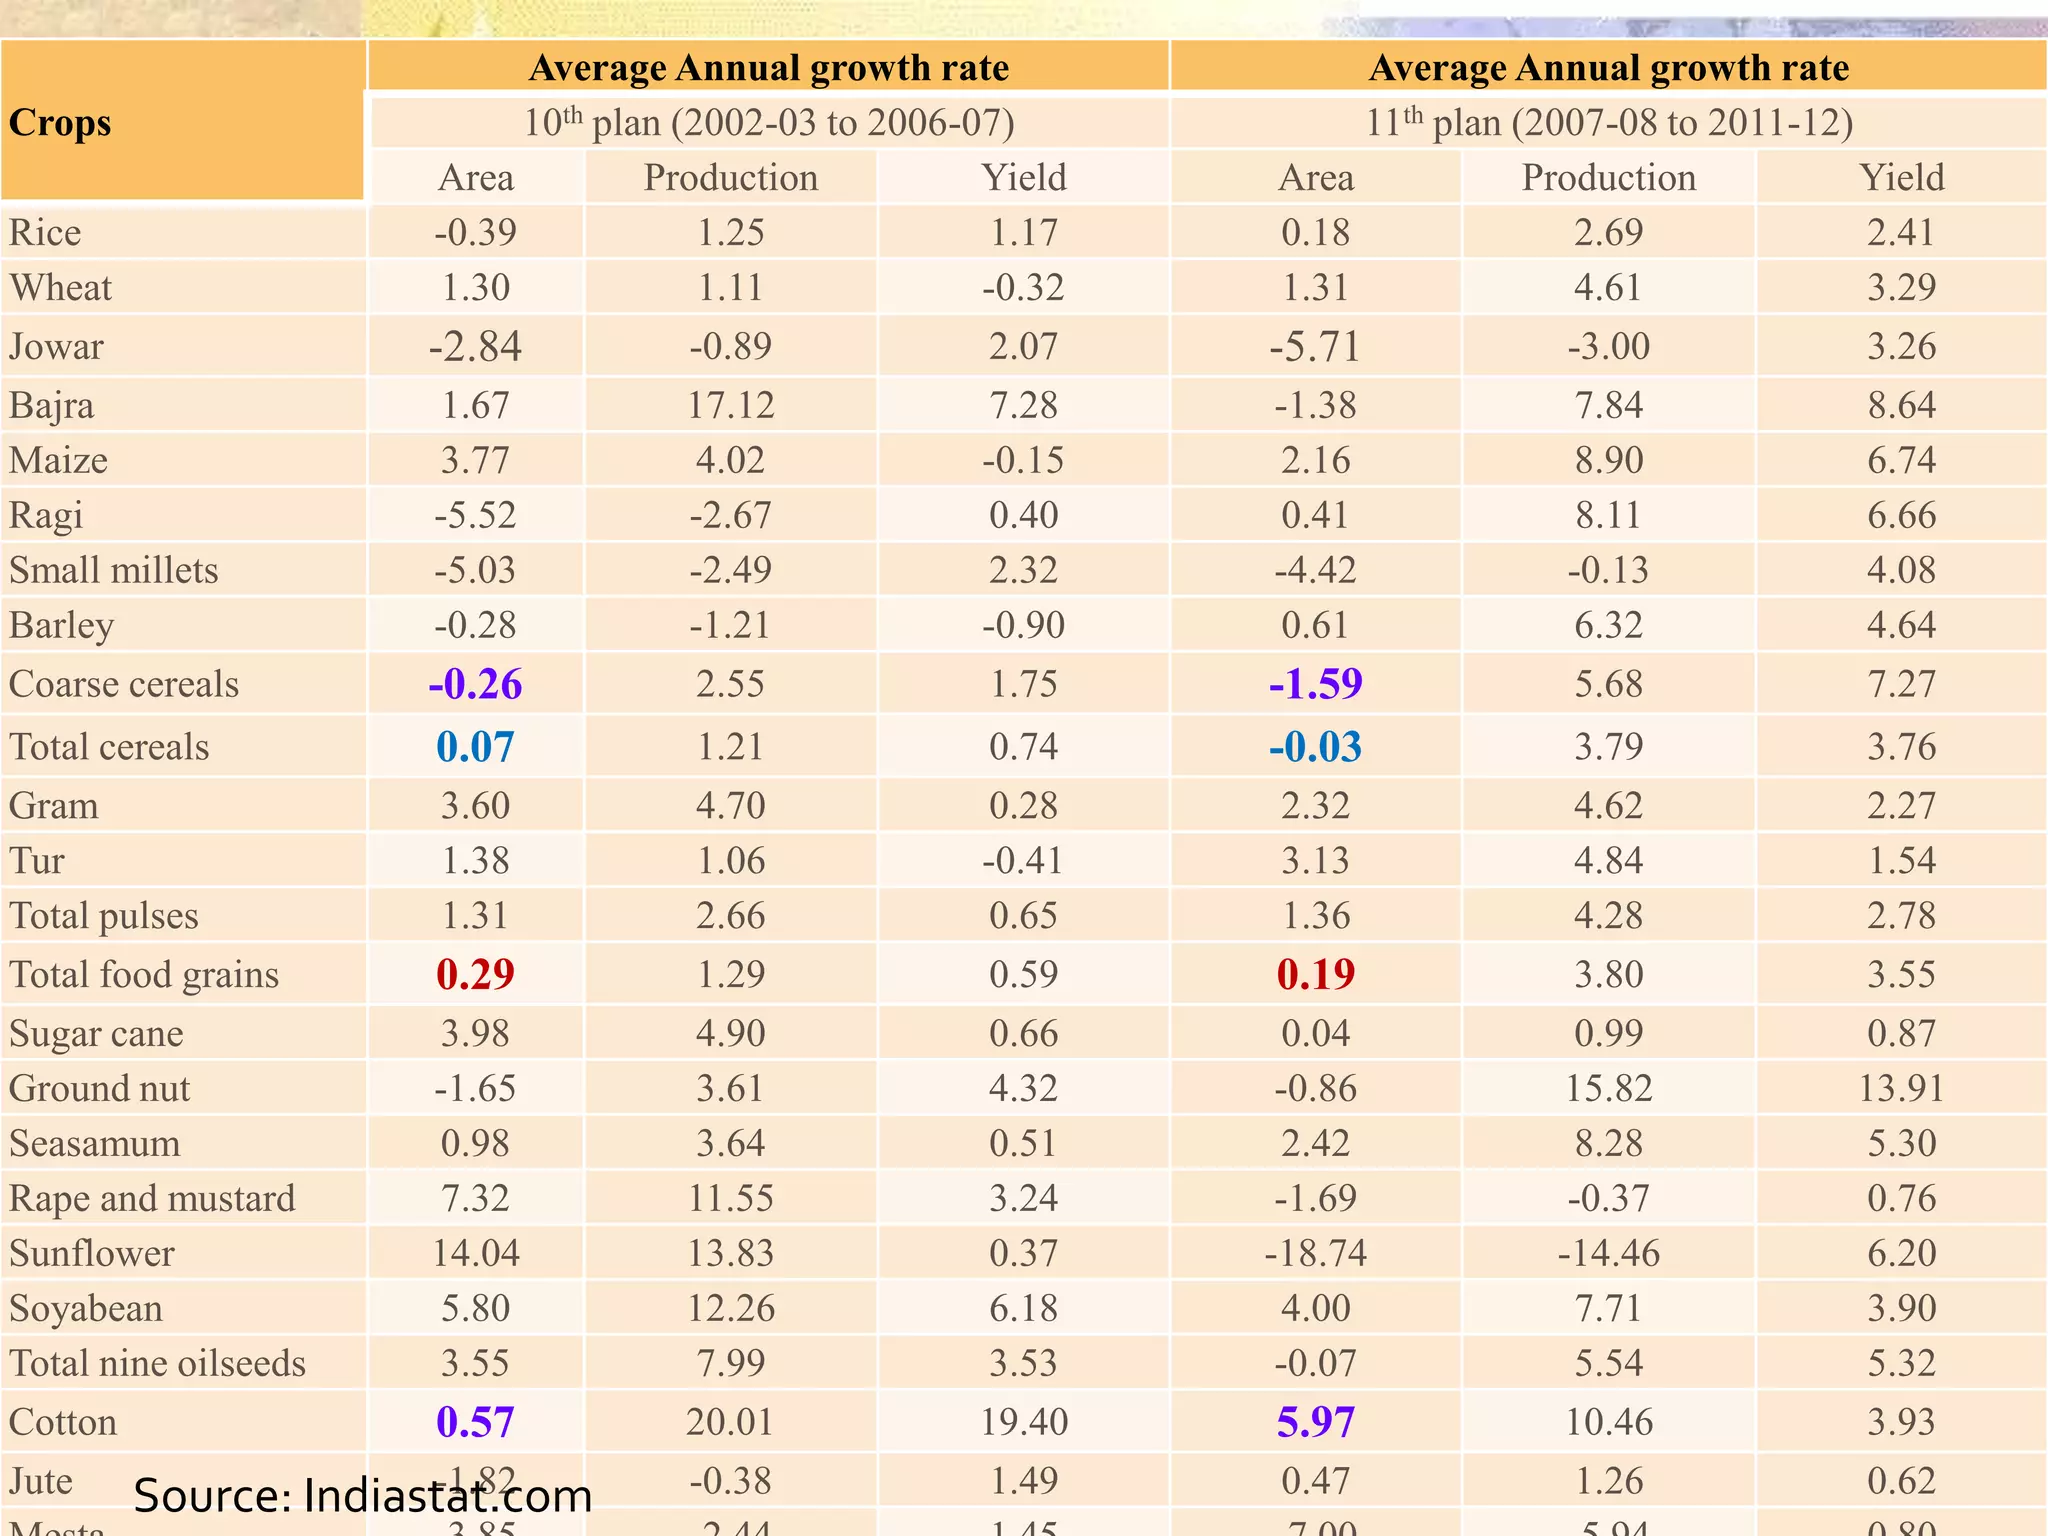
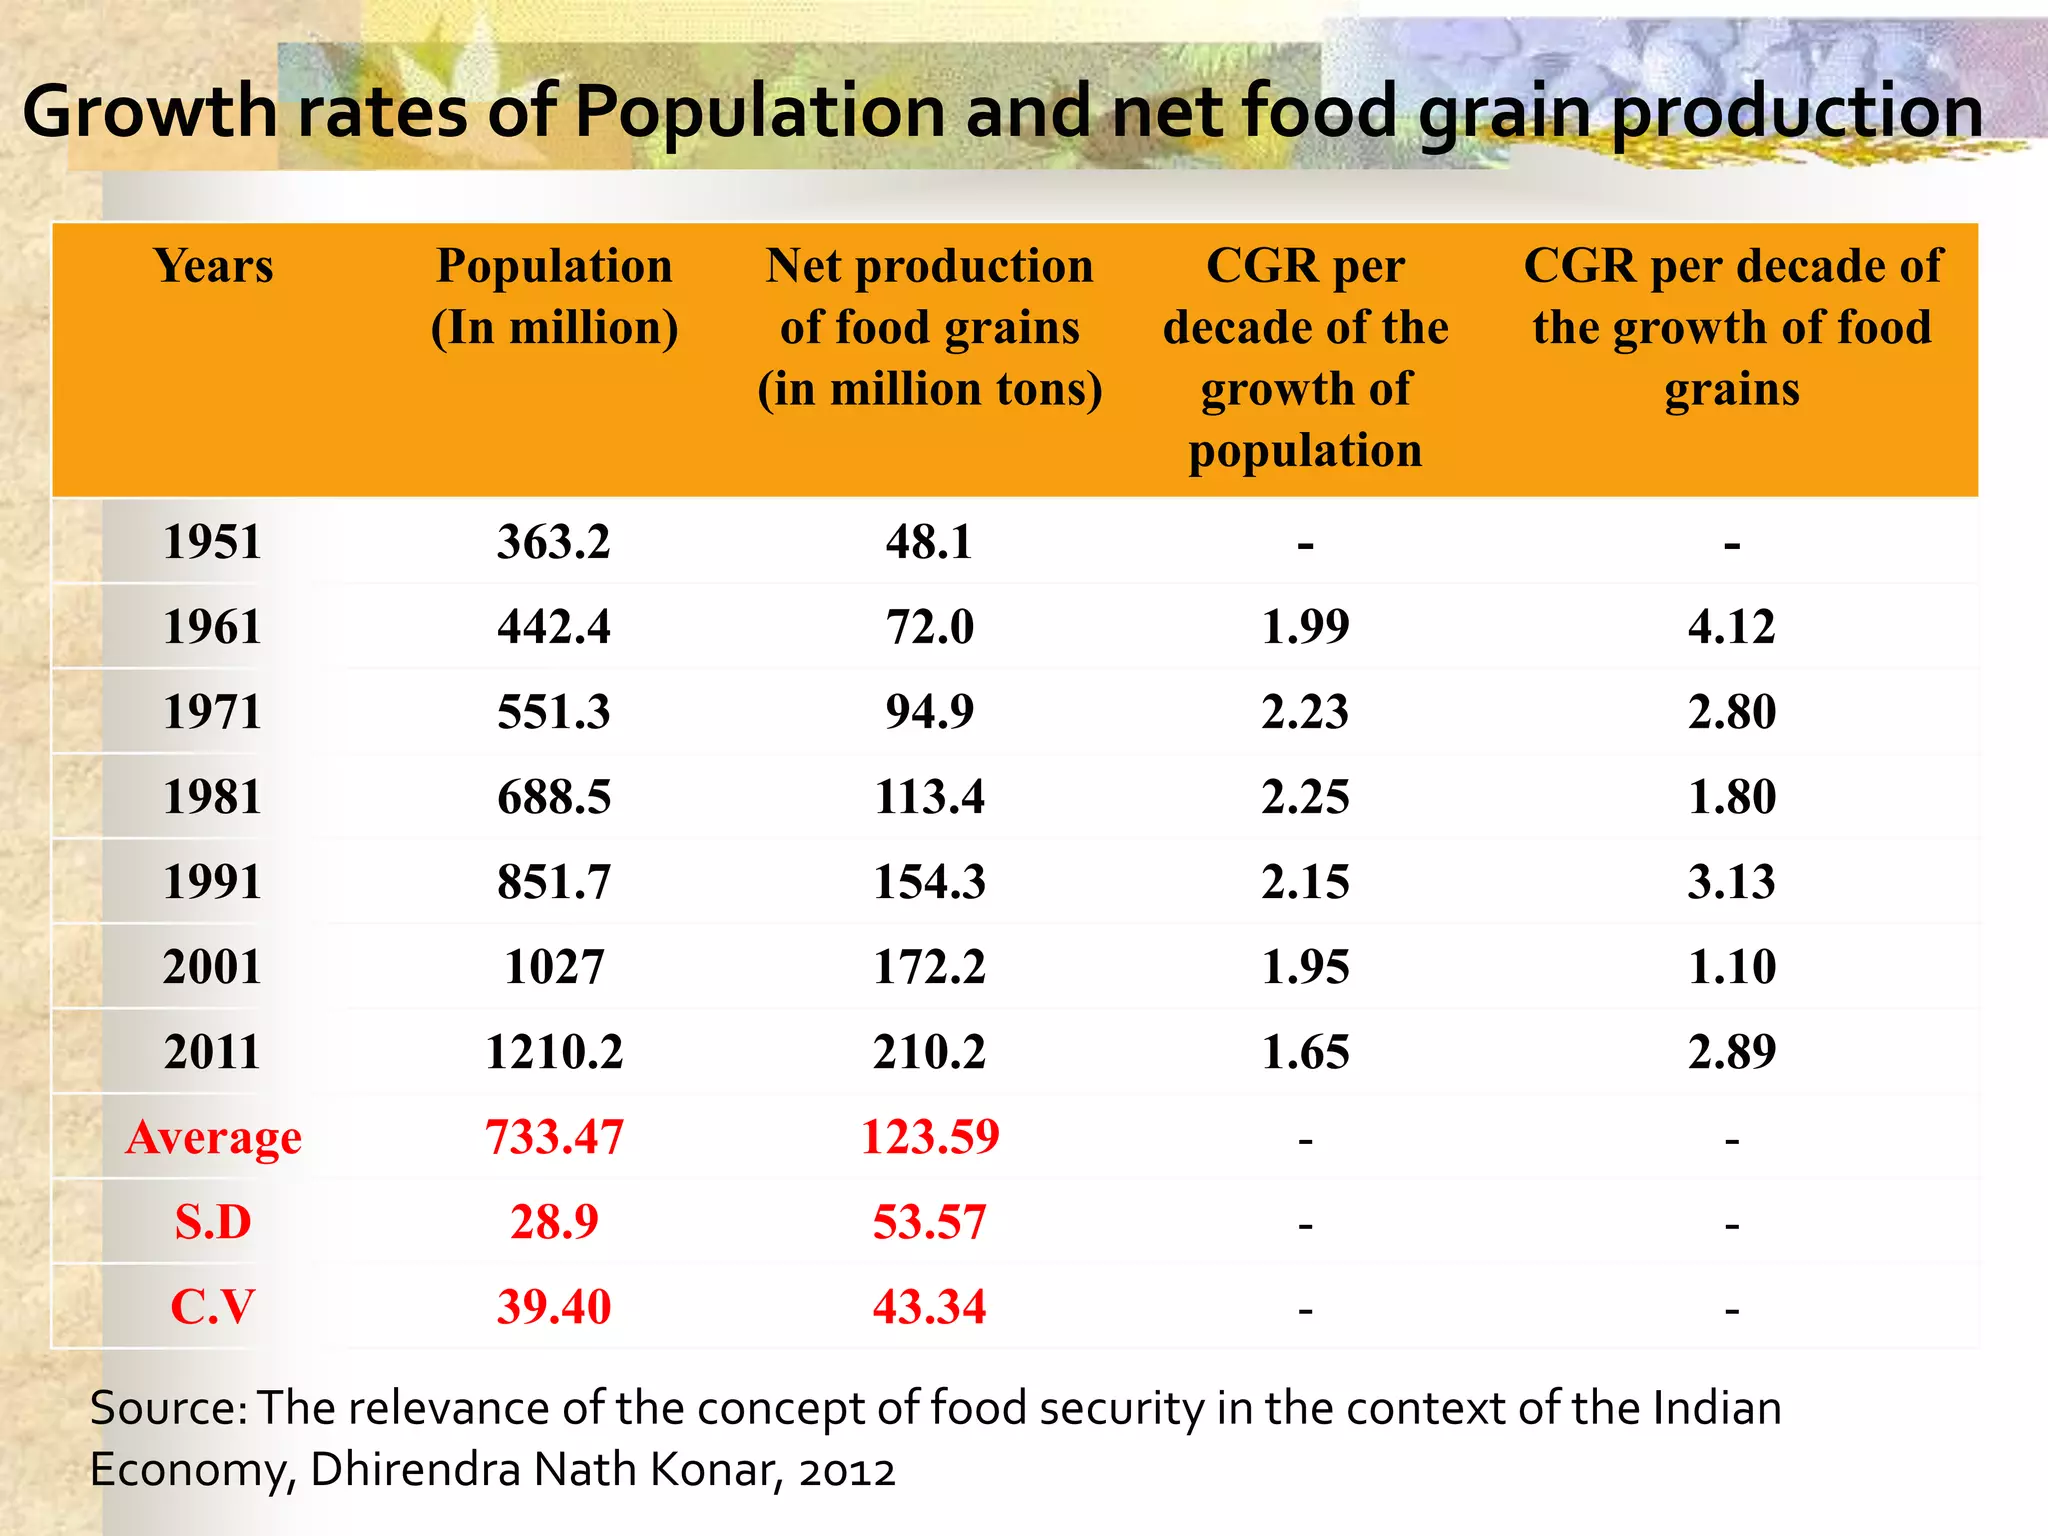
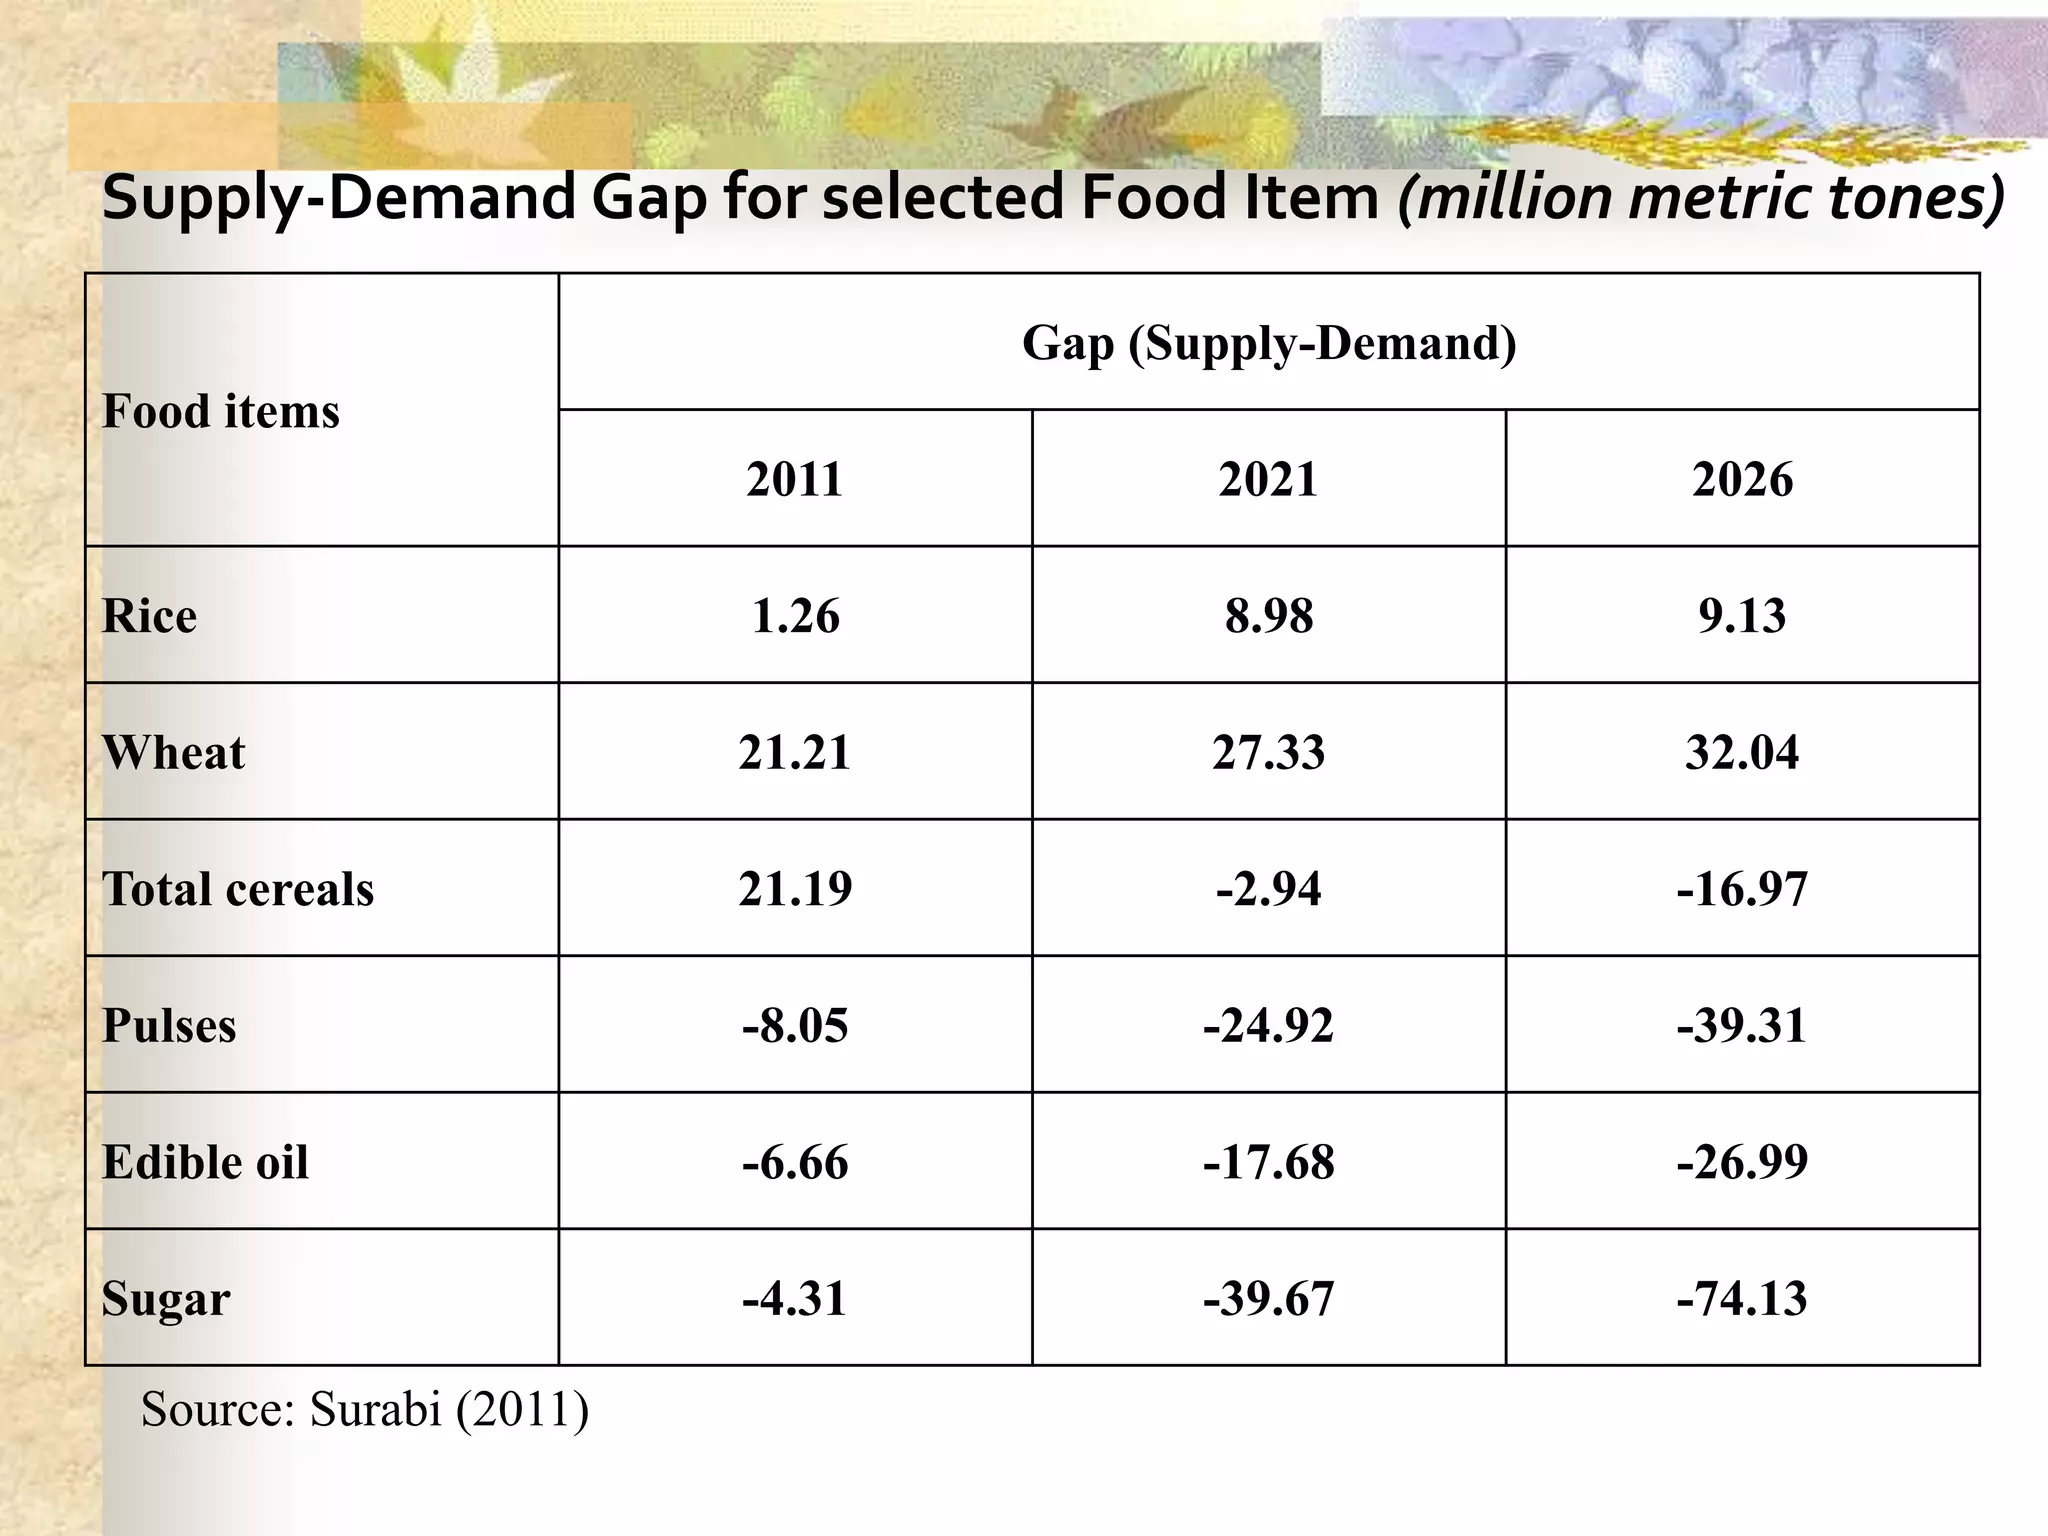
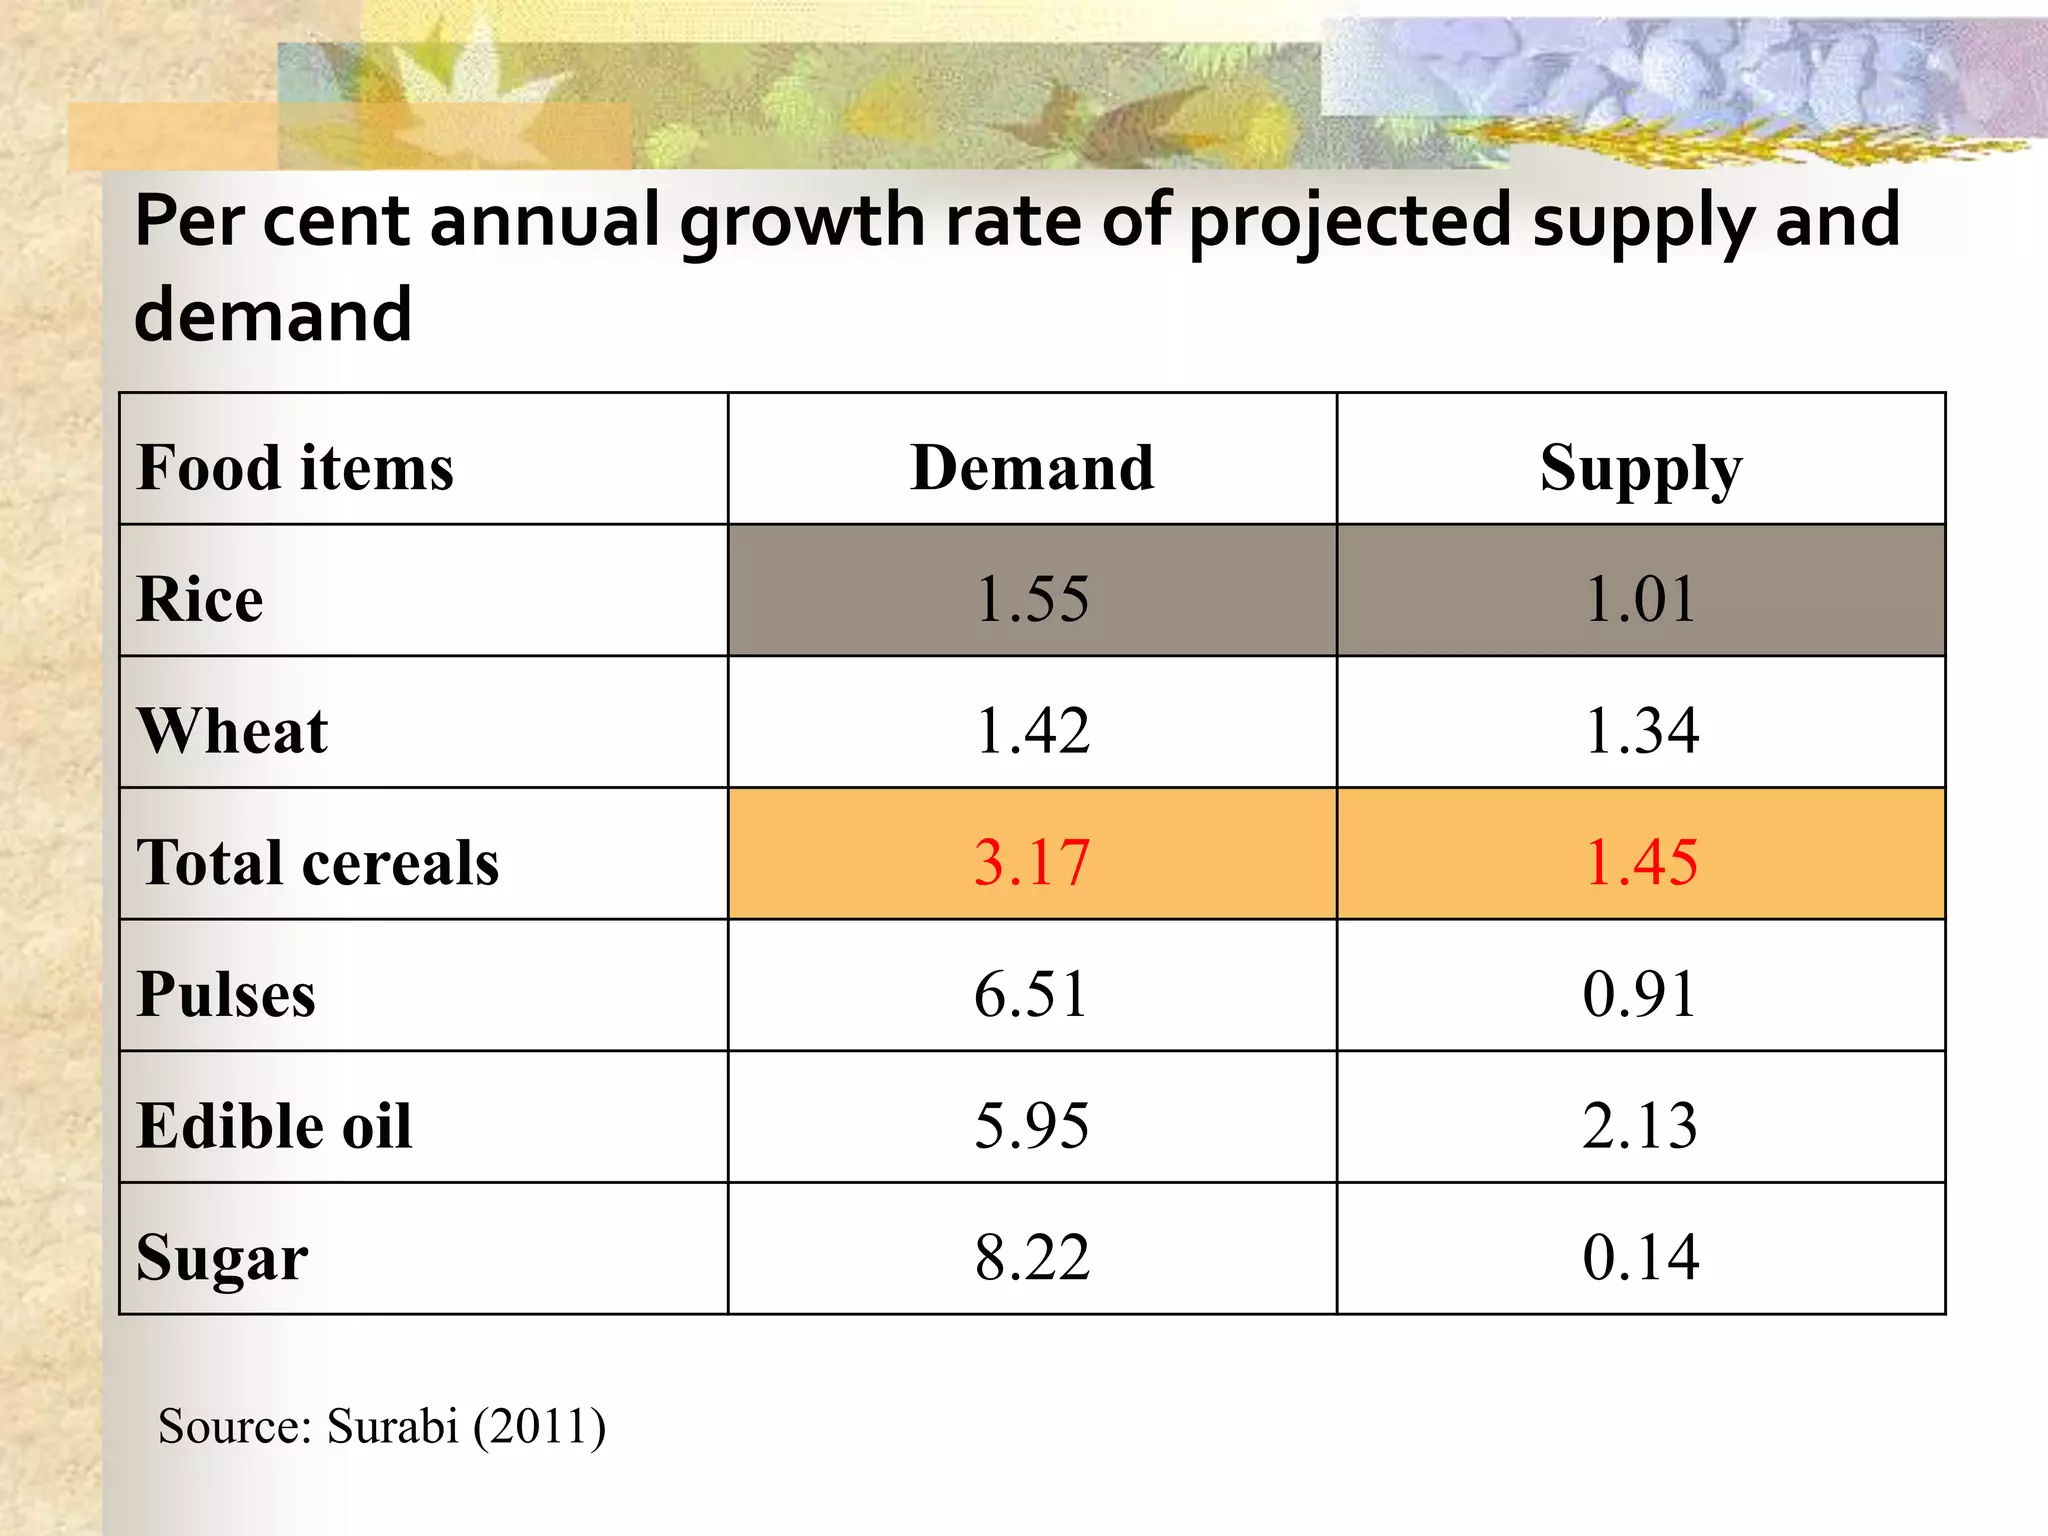
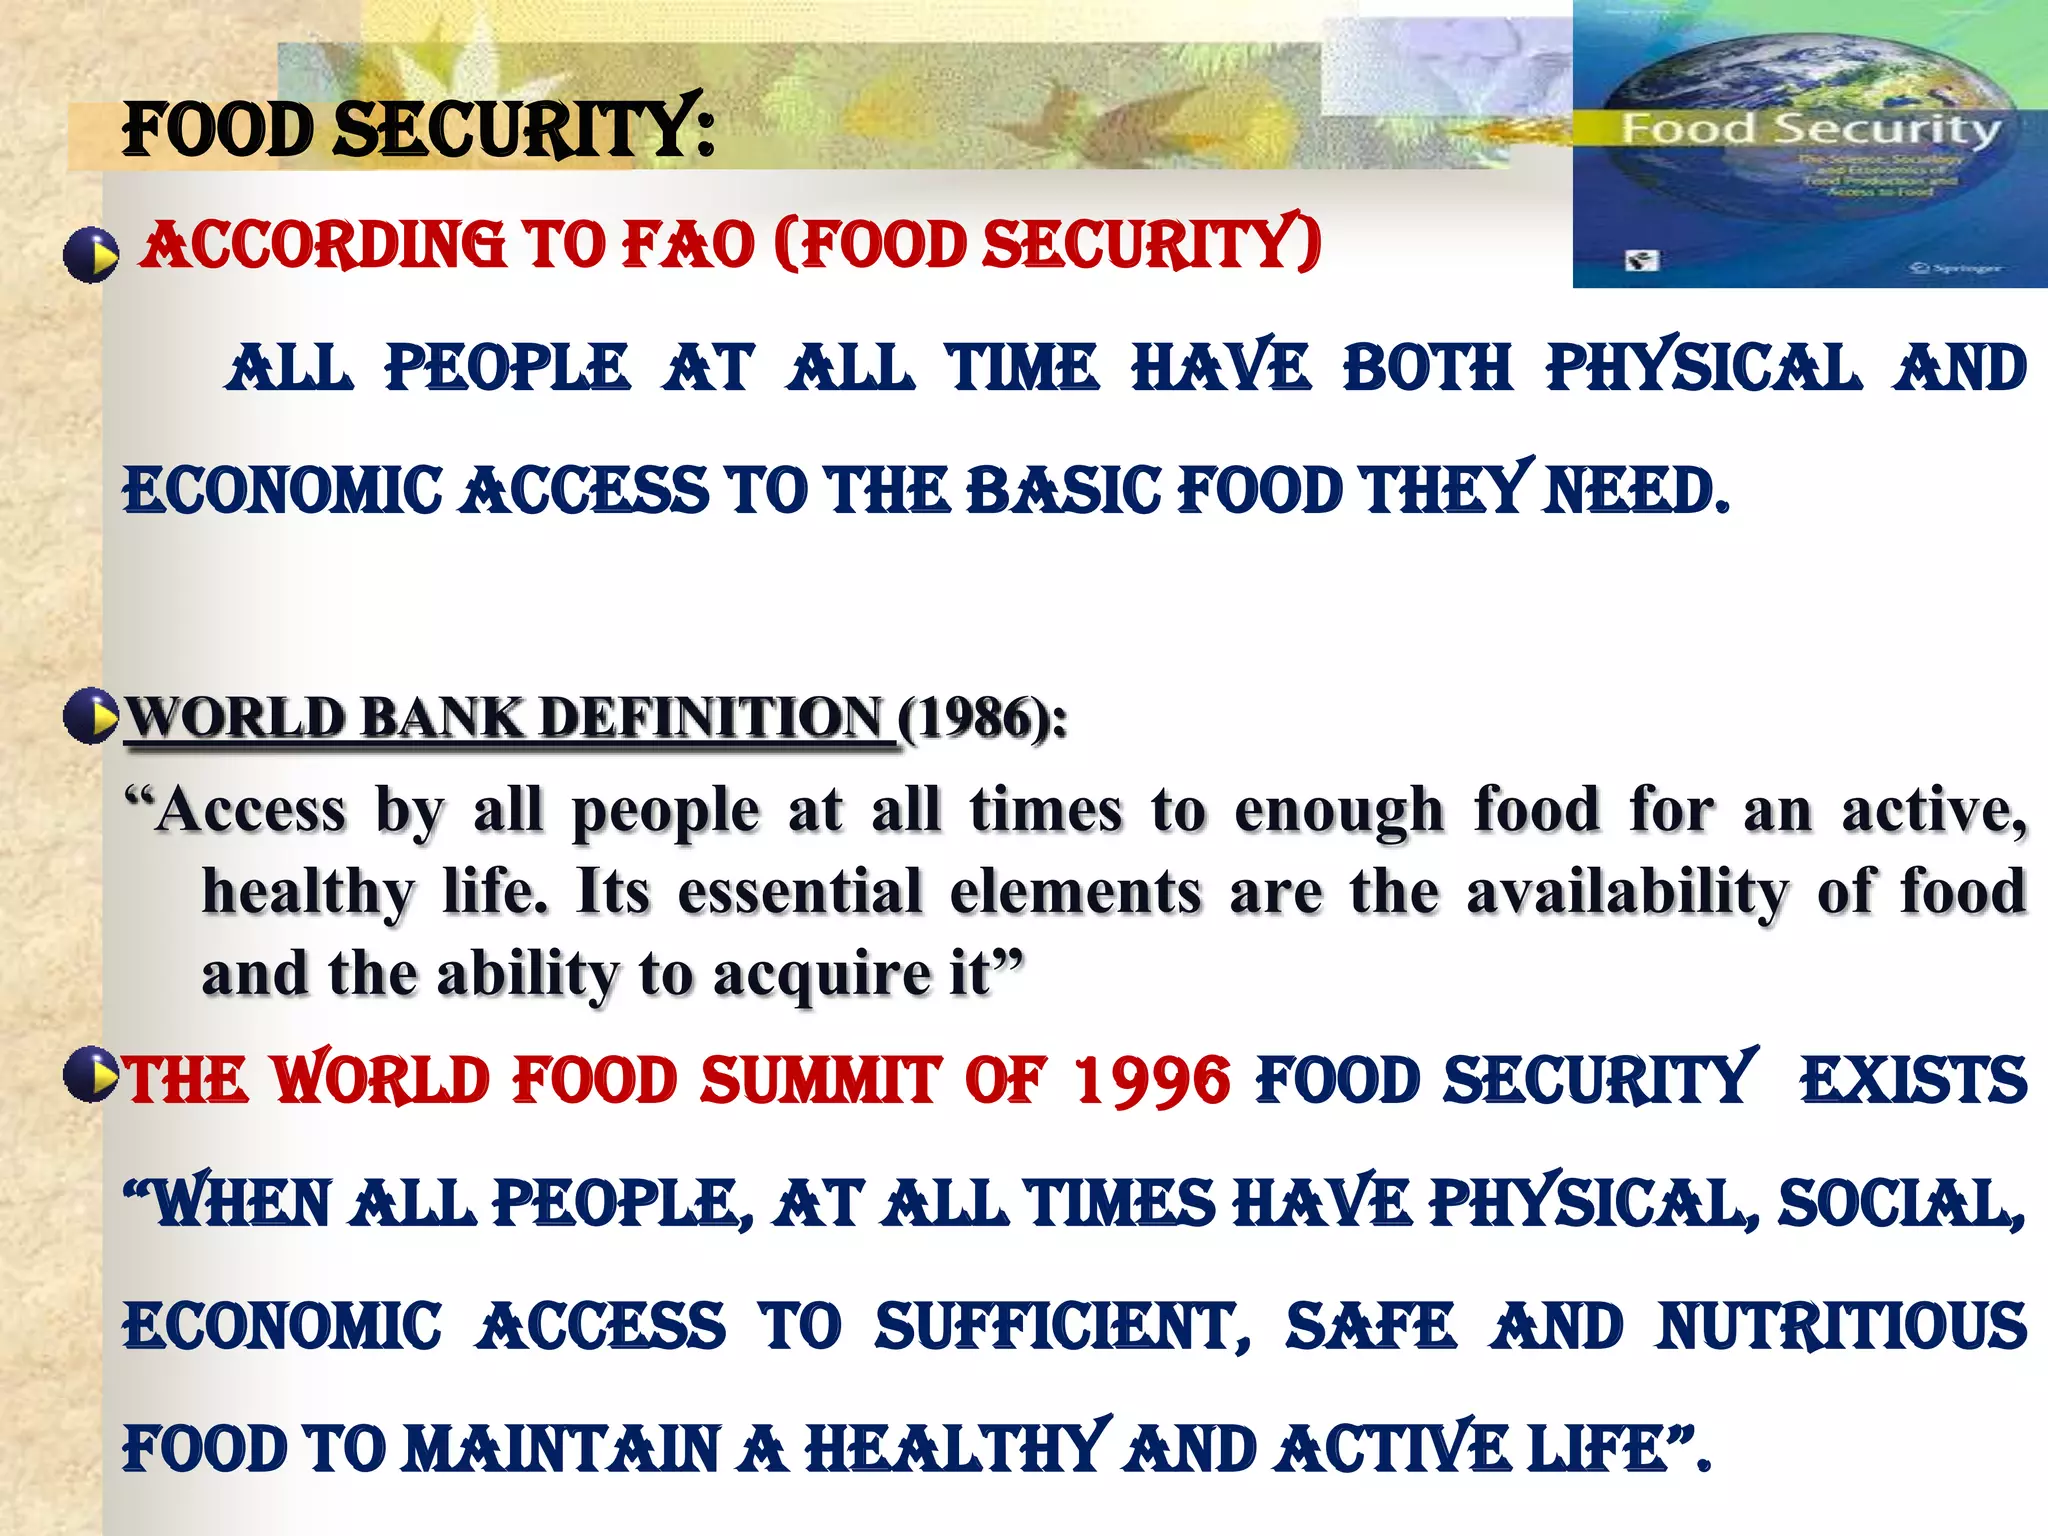
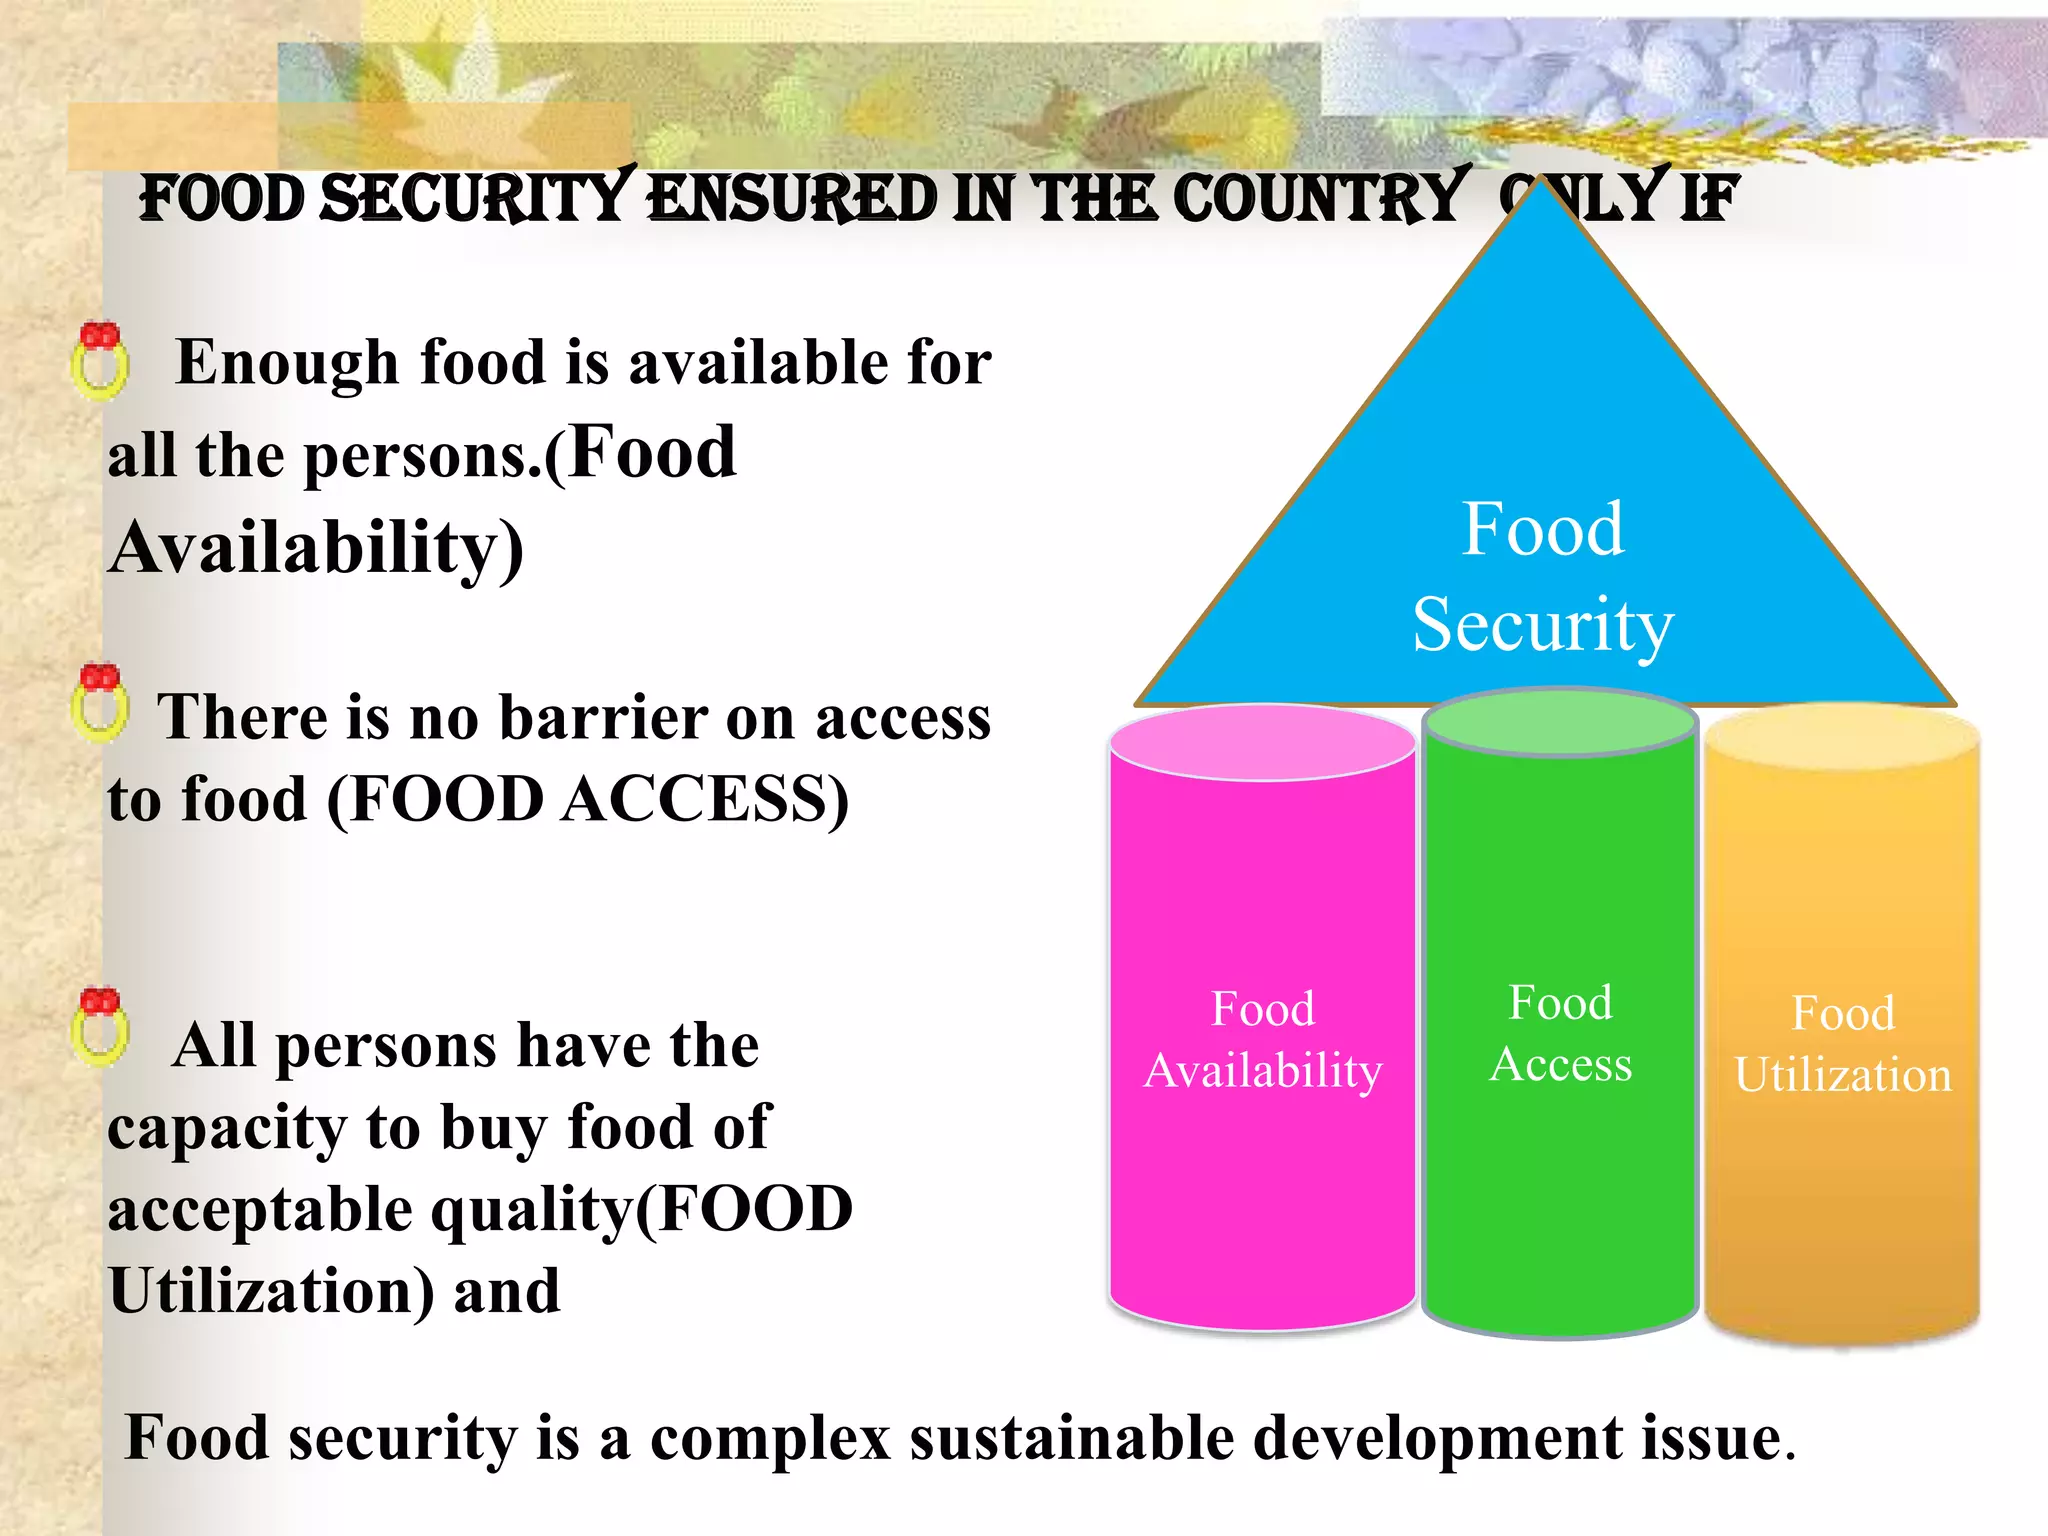
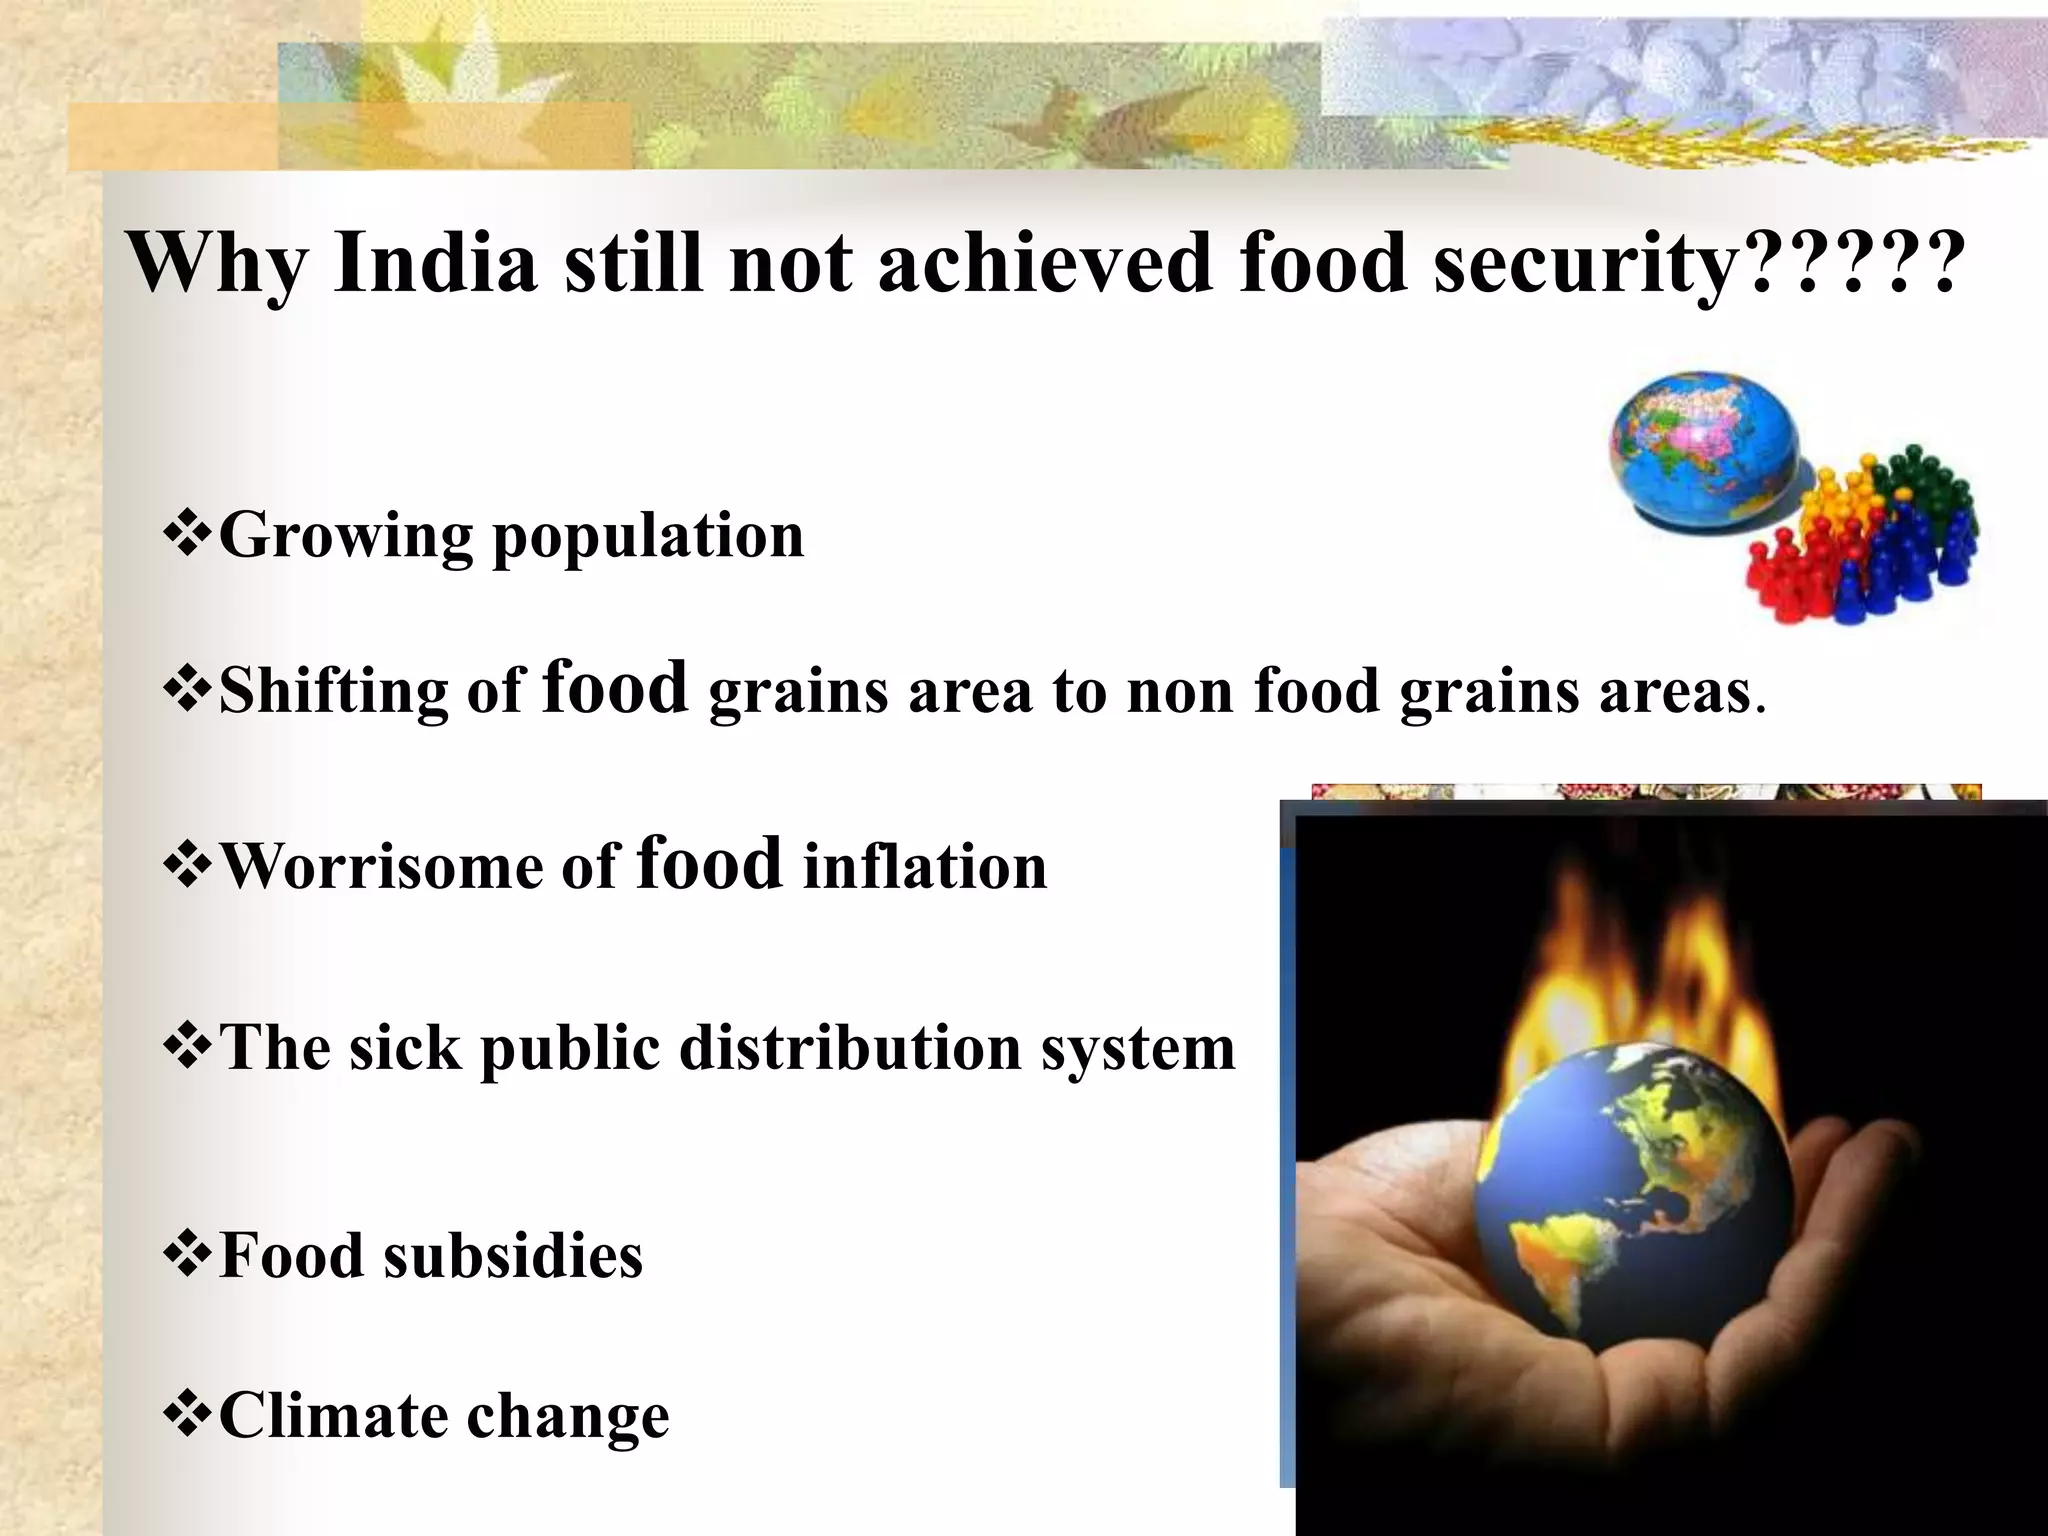
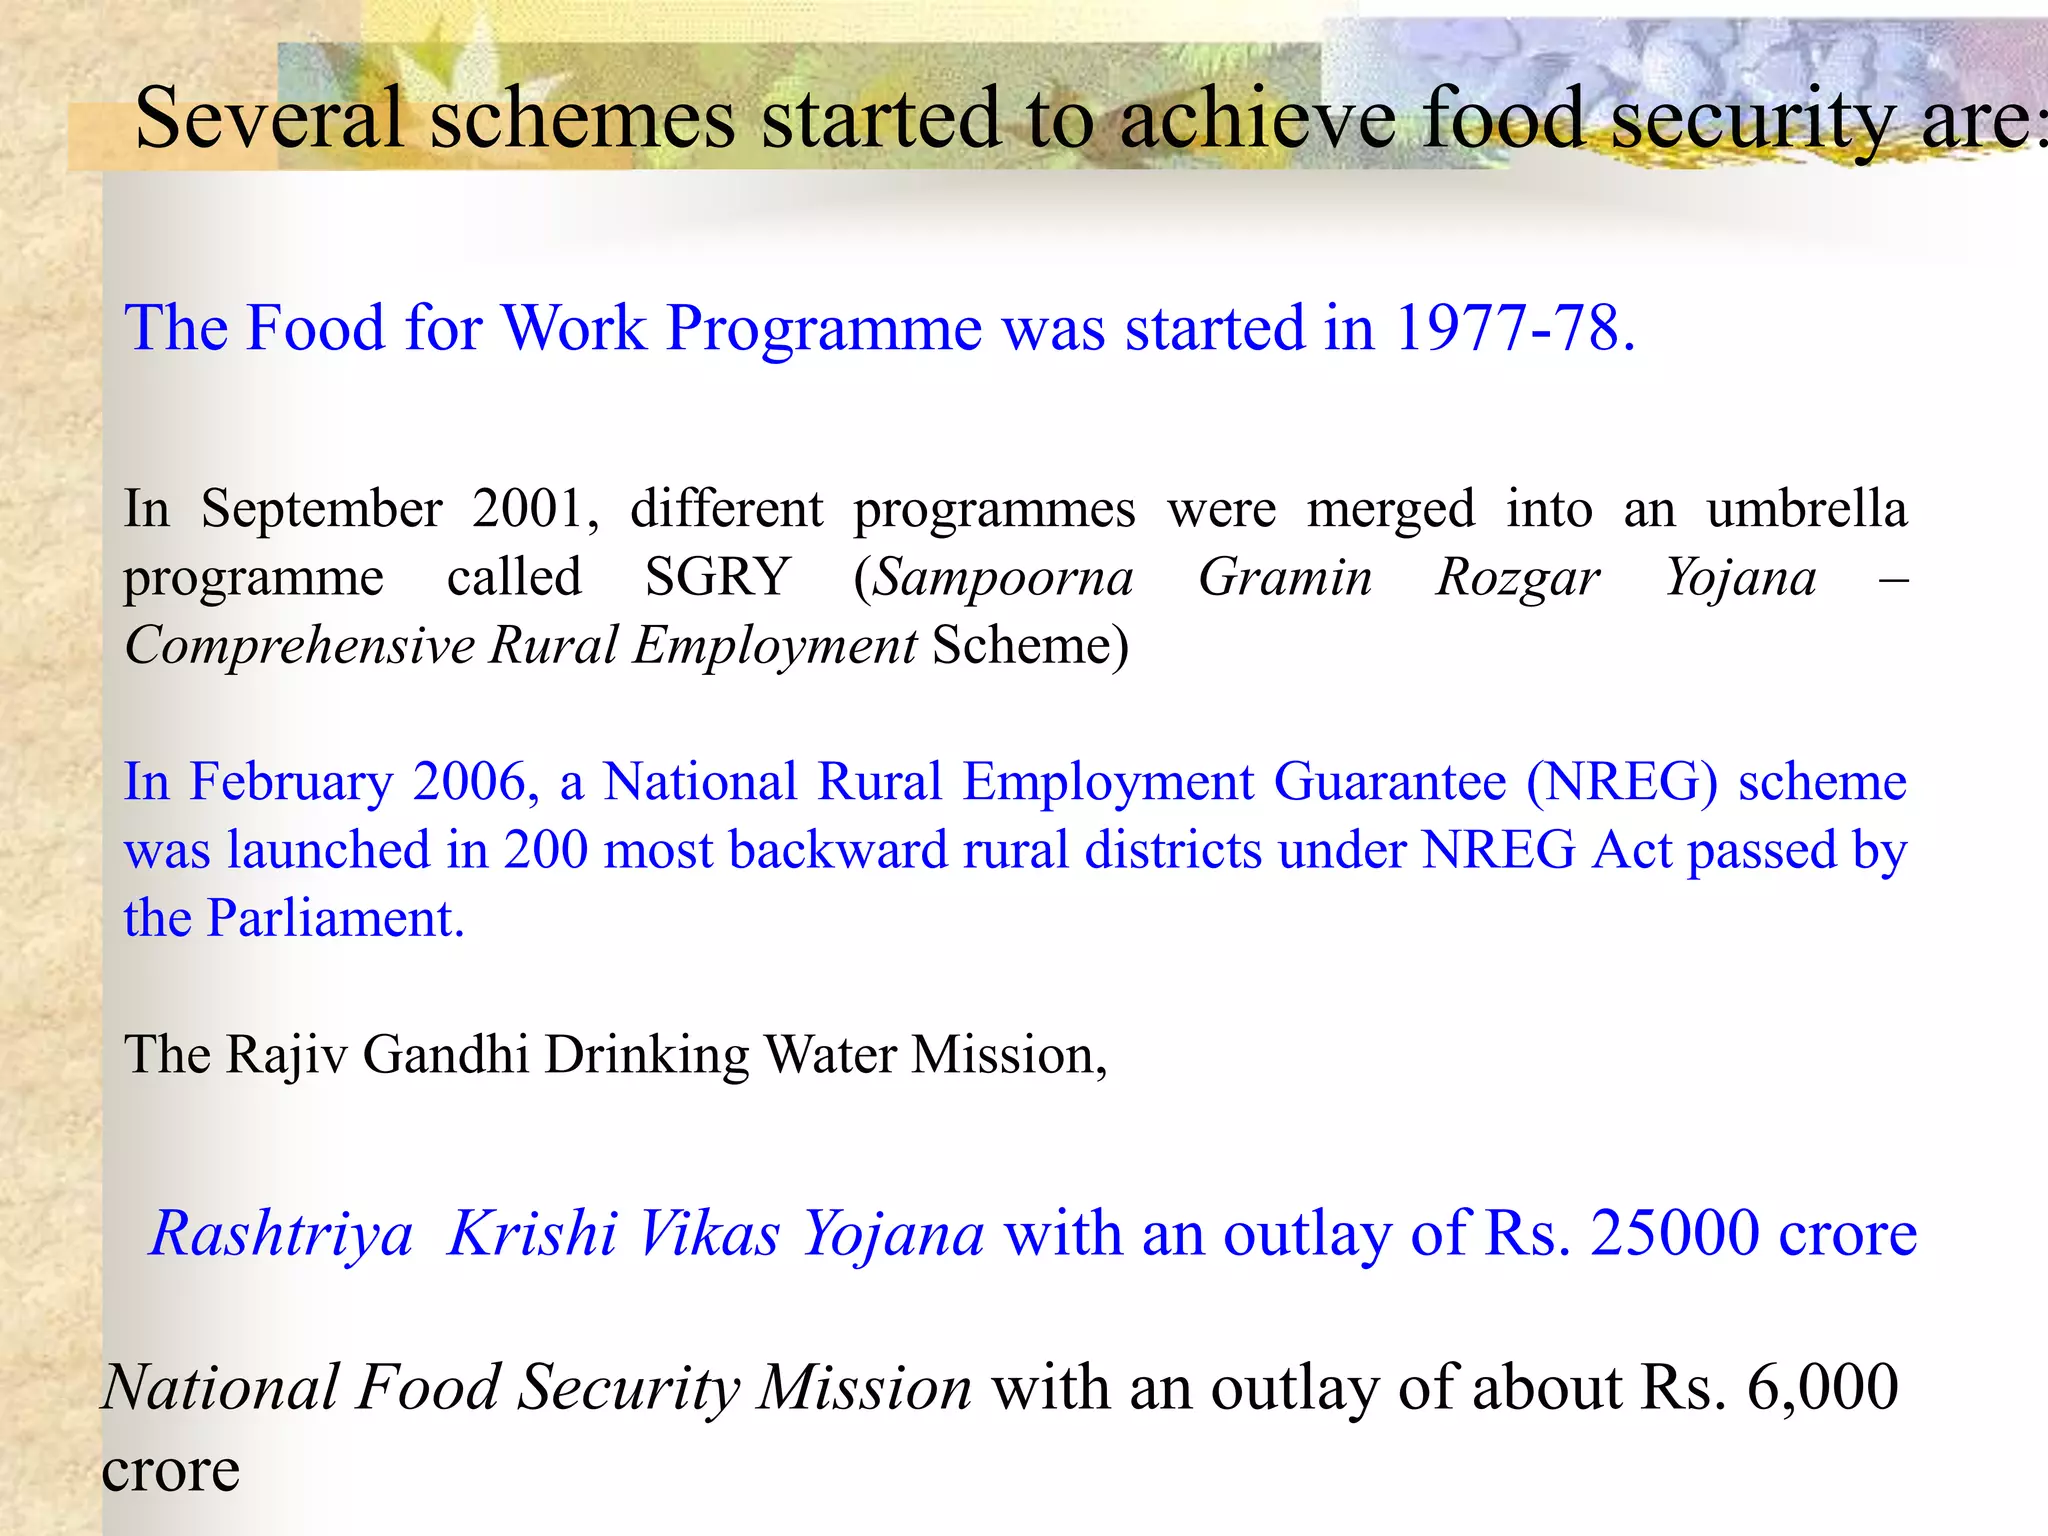
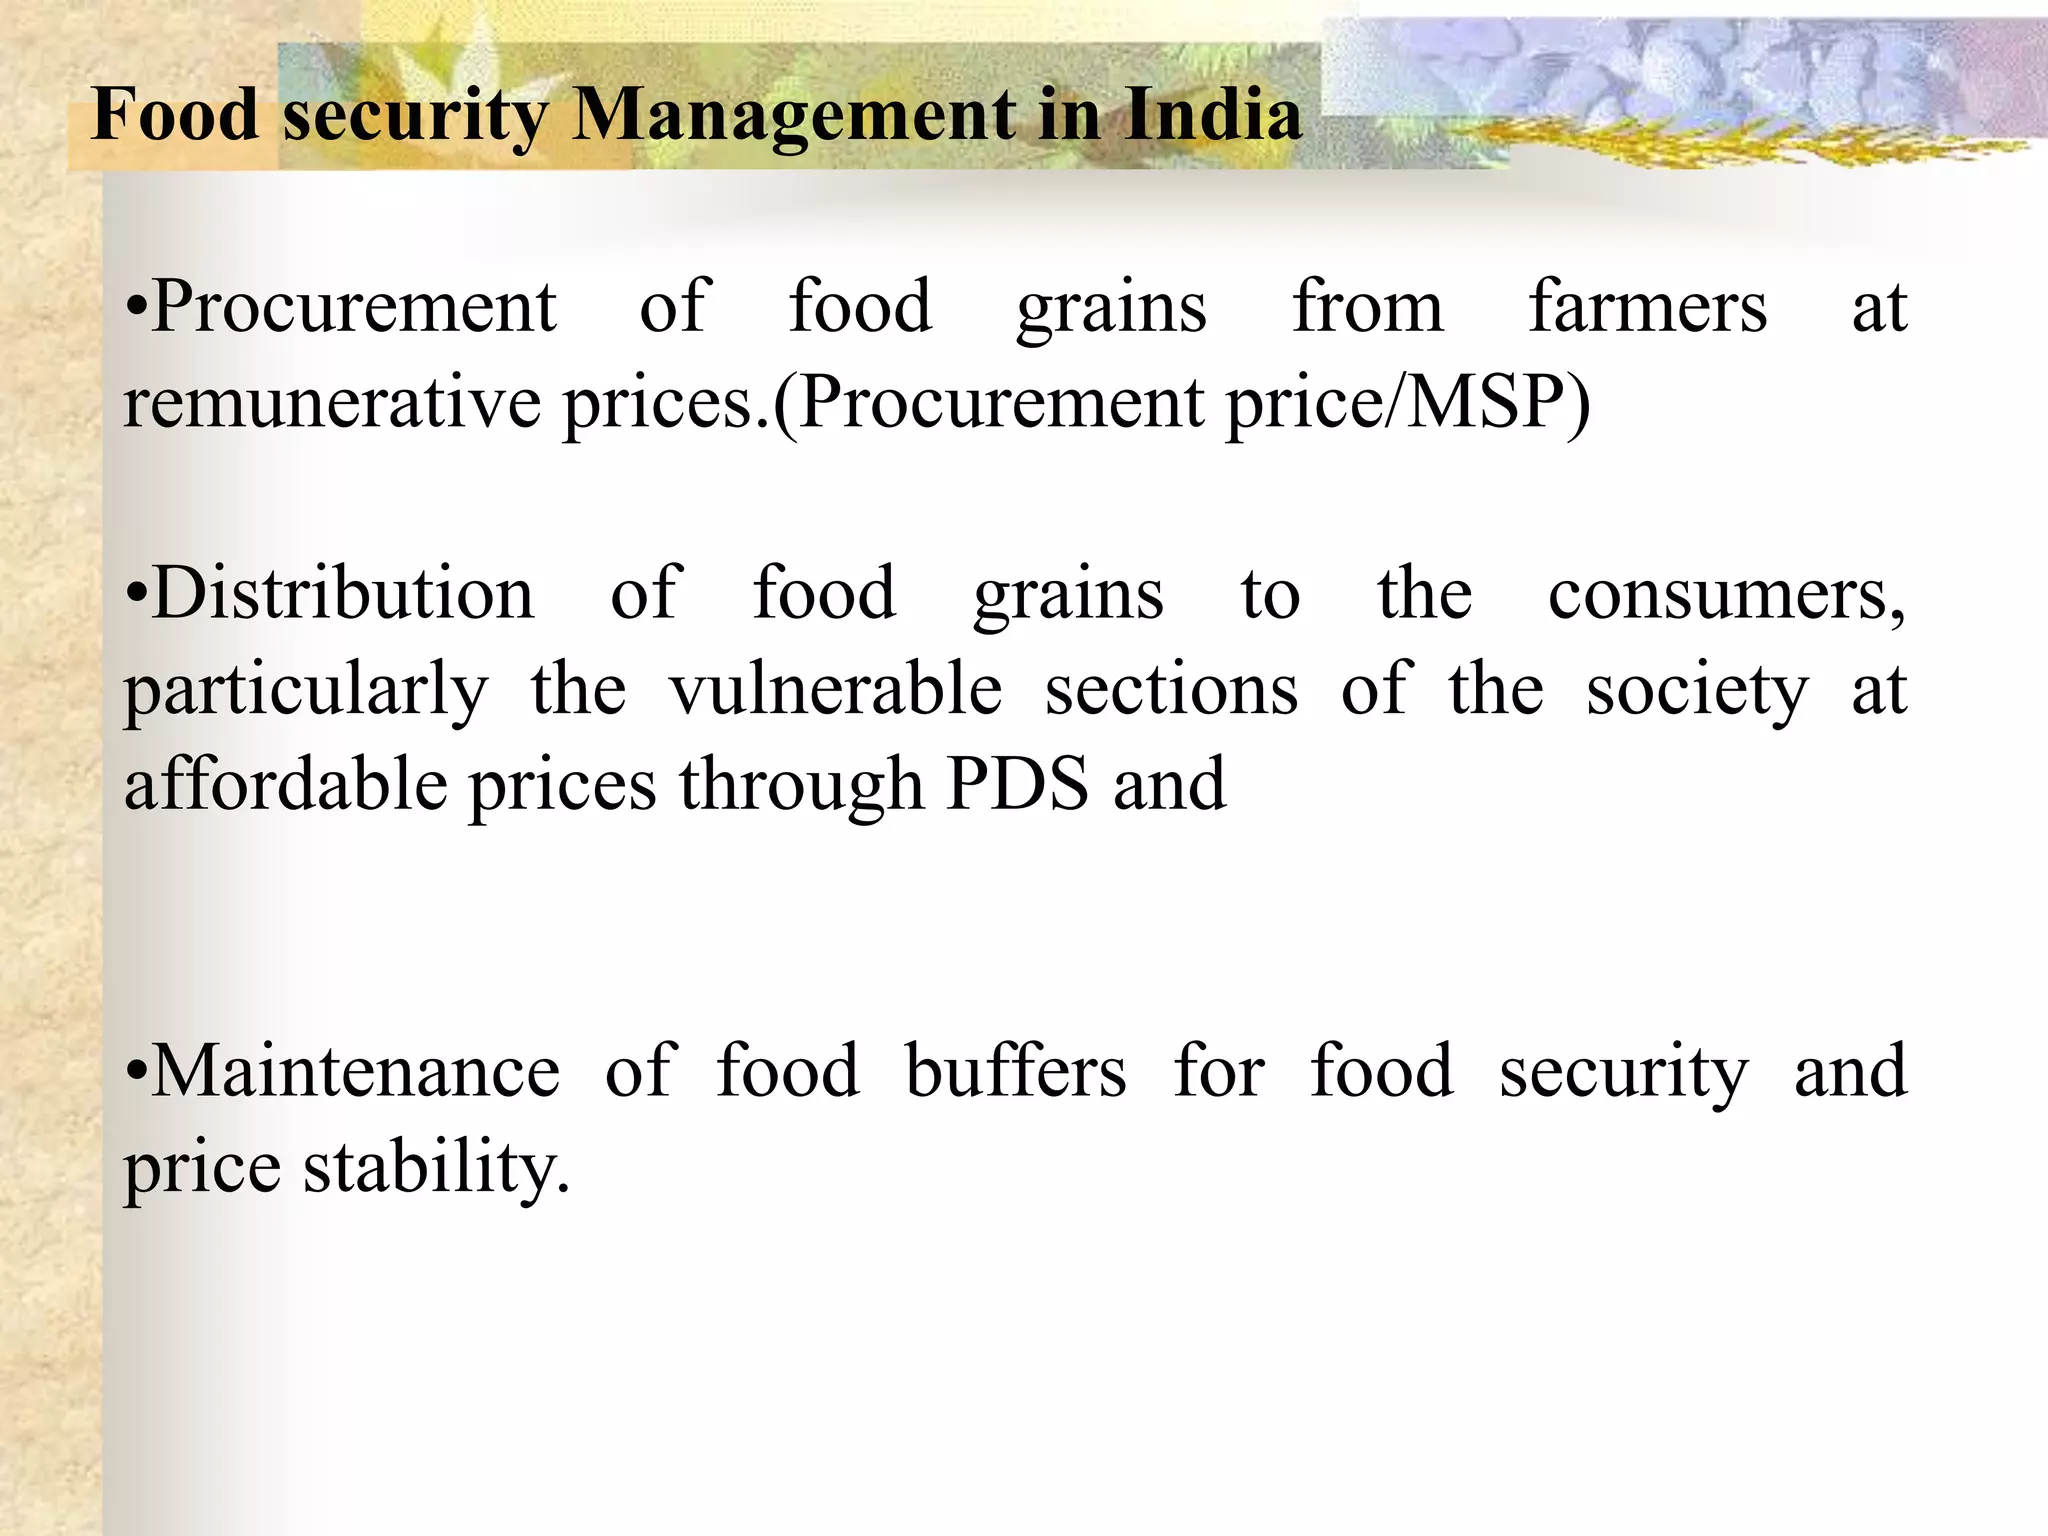
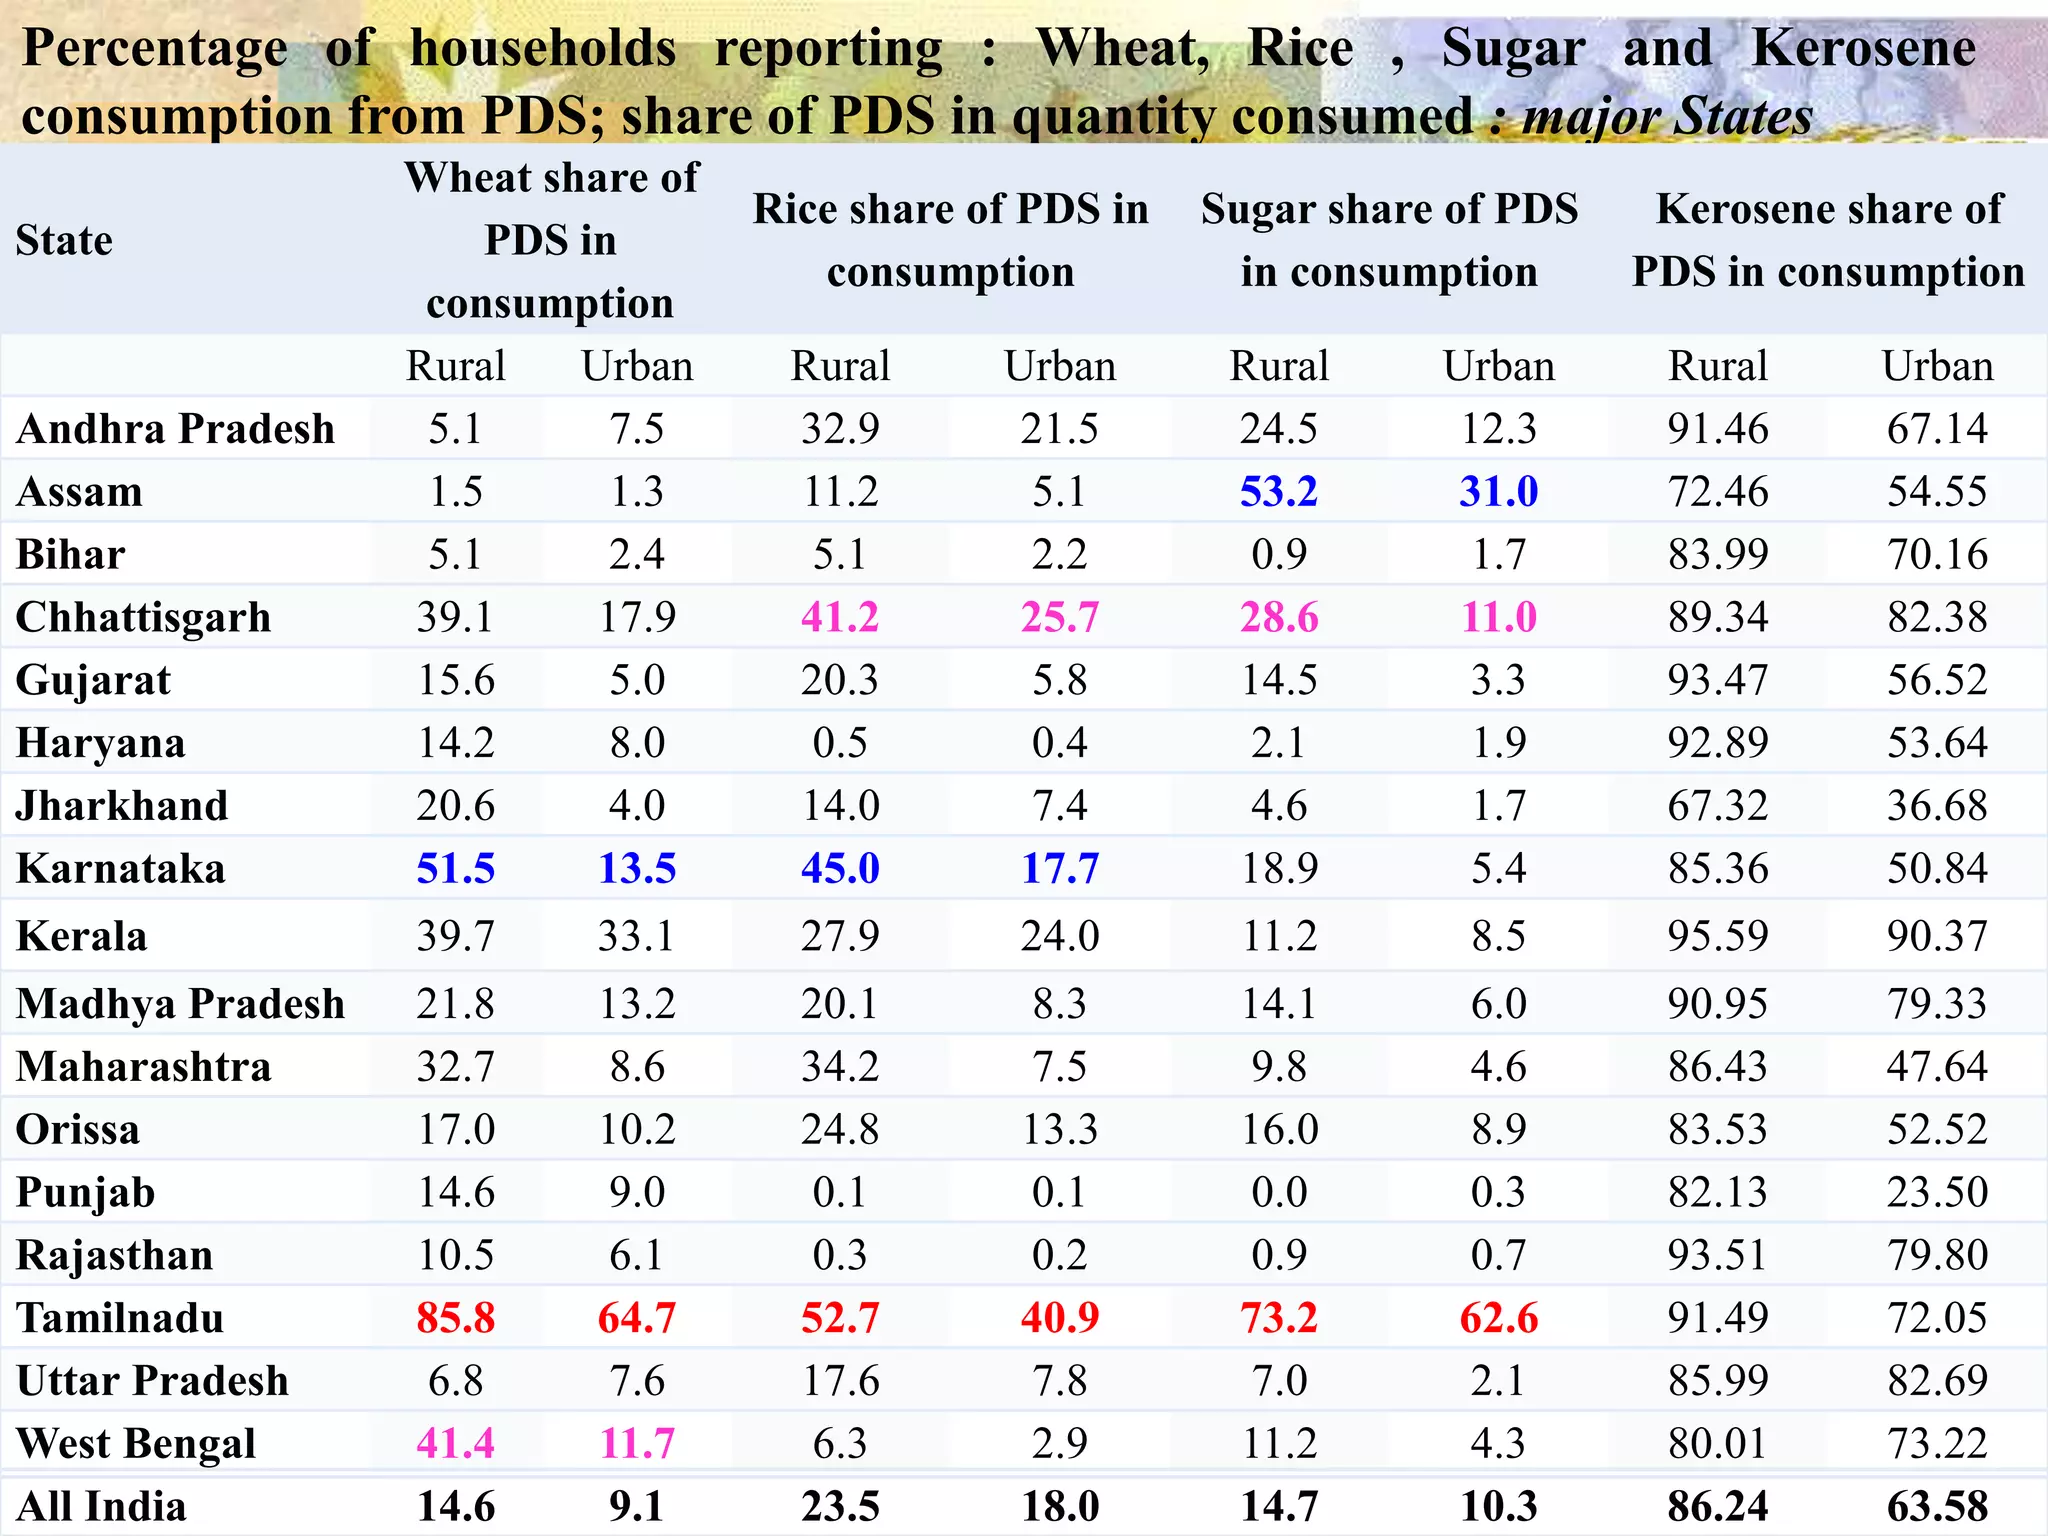
SlideShare a Scribd company logo
1 of 59
Seminar - I
Agriculture Performance- Food Security
and Public Distribution System (PDS)

Major advisor
Dr. H. Basavaraja

By
Najath Paraveen Navalur
PGS12AGR5750
UAS Dharwad
Flow of Presentation
Introduction
Agriculture performance in India
Food security - Dimensions of food security
Projected demand & supply of food- food gap
Public distribution system (pds)
Case study
conclusion
INTRODUCTION
India’s population is 1.25 billion.
India’s food grain
tonnes.

production 259 million

India achieved national food self -sufficiency 35
years ago,
Yet about 35% of its population remains food
insecure.
Low incomes and high food prices prevent
individual food security.
Another aspect of India’s food insecurity
situation is that even after over three
decades of operation, Public Distribution
System (PDS) meets less than 10% of
consumption of grains by the poor.
Indian Agriculture Sector
Agriculture is the backbone of the Indian economy.
Around 58%
Agriculture.

population

of

India

depends

on

Produces 51 major Crops.
India ranks second worldwide in farm output.

India is the leading producer of Jute, pulses
mangoes, bananas, cashew nuts and ginger..
Second largest producer of wheat,
, sugar, cotton, fruits and vegetables.

paddy

Agriculture accounts for 10% of the total exports
earning and provide raw material to a large
number of industries.
India ranks among world’s 5 largest producers of
over 80% of agriculture commodity viz
coffee, cotton, livestock and poultry meat.
Contributes 16% to GDP.
Success story of Indian Agriculture……
Prior mid-1960s India relied on imports (PL-480).

Punjab led India's green revolution.

A hectare of Indian wheat farms that produced an average of 0.8
tonnes in 1948, produced 4.7 tonnes of wheat in 1975 from the
same land.

By 2000, Indian farms adopted wheat varieties capable of yielding 6
tonnes of wheat per hectare.
Agriculture productivity in India, growth in average
yields from 1970 to 2010
Average YIELD,
1970-1971

Average YIELD,
1990-1991

Average YIELD,
2010–2011

Kg/ha

Kg/ha

Kg/ha

Rice

1123

1740

2240

Wheat

1307

2281

2938

Pulses

524

578

689

Oilseeds

579

771

1325

Sugarcane

48322

65395

68596

Tea

1182

1652

1669

Cotton

106

225

510

Crop
Mile Stones in Agricultural Development
Special programmes were undertaken to improve food
cash crops supply

and

Grow more food campaign (1940).

Integrated production
and cash crops.

programmes (1950) focused on food

Five year plans of India- oriented towards agriculture
development.

Land reclamation, land development, mechanization,
electrification, use of fertilizers, chemicals.
Green revolution(1960).
Yellow revolution (1986-1990).
Operation Flood(1970-1996).
Blue revolution (1973-2002).
Total Output in last five years
155

Agriculture Output in USD(b)

150
Growth only 2 %

145
140
135
130
125

120
115
FY07

FY08

FY09

FY10

Value In USD (b)
Source: Ministry of Agriculture

FY11

FY12
Agriculture contribution to GDP
Contribution to GDP in %

14.8%
14.6%
14.4%

14.01

14.2%
14.0%

13.7

13.8%
13.6%
13.4%
13.2%

2009-10

2010-11
Years

Source: Ministry of Agriculture

2011-12

2012-13
India’s food grain (rice, wheat, coarse grains and
pulses) production.
Year

Food production

1950-51

50.8mt

1960-61

82mt

1970-71

108.4mt

1980-81

129.6mt

1990-91

176.4mt

2000-01

196.8mt

2011-12

259mt

2012-13

255mt

Source: Ministry of Agriculture, India
Food grain production in India

(million tones)

Year

Rice

Wheat

Other cereals

Pulses

Total food
grains

Increase per
year

2000-01

84.98

69.68

31.07

11.08

196.81

-

2001-02

93.34

72.77

33.37

13.37

212.85

8.1

2002-03

71.82

65.76

26.06

11.13

174.77

-17.8

2003-04

88.53

72.16

37.59

14.91

213.19

21.98

2004-05

83.13

68.64

33.46

13.13

198.36

-6.95

2005-06

91.79

69.35

34.08

13.38

208.60

5.2

2006-07

93.36

75.81

33.91

14.20

217.28

4.2

2007-08

96.69

78.57

40.76

14.76

230.78

6.2

2008-09

99.18

80.68

40.04

14.57

234.47

1.6

2009-10

89.09

80.80

33.56

14.66

218.11

-7.0

2010-11

95.98

86.87

43.4

18.24

244.49

12.2

2011-12

105.30

94.88

42.02

17.09

259.29

6.1

2012-13

104.40

92.46

40.05

18.45

255.36

-1.5

Source: Economic survey, 2011-12
Crops
Rice
Wheat
Jowar
Bajra
Maize
Ragi
Small millets
Barley
Coarse cereals

Average Annual growth rate
10th plan (2002-03 to 2006-07)
Area
Production
Yield
-0.39
1.25
1.17
1.30
1.11
-0.32
-0.89
2.07
-2.84
1.67
17.12
7.28
3.77
4.02
-0.15
-5.52
-2.67
0.40
-5.03
-2.49
2.32
-0.28
-1.21
-0.90
2.55
1.75
-0.26

Total cereals
0.07
Gram
3.60
Tur
1.38
Total pulses
1.31
Total food grains
0.29
Sugar cane
3.98
Ground nut
-1.65
Seasamum
0.98
Rape and mustard
7.32
Sunflower
14.04
Soyabean
5.80
Total nine oilseeds
3.55
Cotton
0.57
Jute Source: Indiastat.com
-1.82

1.21
4.70
1.06
2.66
1.29
4.90
3.61
3.64
11.55
13.83
12.26
7.99
20.01
-0.38

0.74
0.28
-0.41
0.65
0.59
0.66
4.32
0.51
3.24
0.37
6.18
3.53
19.40
1.49

Average Annual growth rate
11th plan (2007-08 to 2011-12)
Area
Production
Yield
0.18
2.69
2.41
1.31
4.61
3.29
-3.00
3.26
-5.71
-1.38
7.84
8.64
2.16
8.90
6.74
0.41
8.11
6.66
-4.42
-0.13
4.08
0.61
6.32
4.64
5.68
7.27
-1.59

-0.03
2.32
3.13
1.36

0.19
0.04
-0.86
2.42
-1.69
-18.74
4.00
-0.07

5.97
0.47

3.79
4.62
4.84
4.28
3.80
0.99
15.82
8.28
-0.37
-14.46
7.71
5.54
10.46
1.26

3.76
2.27
1.54
2.78
3.55
0.87
13.91
5.30
0.76
6.20
3.90
5.32
3.93
0.62
Growth rates of Population and net food grain production
Years

Population
(In million)

Net production
of food grains
(in million tons)

CGR per
decade of the
growth of
population

CGR per decade of
the growth of food
grains

1951

363.2

48.1

-

-

1961

442.4

72.0

1.99

4.12

1971

551.3

94.9

2.23

2.80

1981

688.5

113.4

2.25

1.80

1991

851.7

154.3

2.15

3.13

2001

1027

172.2

1.95

1.10

2011

1210.2

210.2

1.65

2.89

Average

733.47

123.59

-

-

S.D

28.9

53.57

-

-

C.V

39.40

43.34

-

-

Source: The relevance of the concept of food security in the context of the Indian
Economy, Dhirendra Nath Konar, 2012
Supply-Demand Gap for selected Food Item (million metric tones)
Gap (Supply-Demand)
Food items
2011

2021

2026

Rice

1.26

8.98

9.13

Wheat

21.21

27.33

32.04

Total cereals

21.19

-2.94

-16.97

Pulses

-8.05

-24.92

-39.31

Edible oil

-6.66

-17.68

-26.99

Sugar

-4.31

-39.67

-74.13

Source: Surabi (2011)
Per cent annual growth rate of projected supply and
demand
Food items

Demand

Supply

Rice

1.55

1.01

Wheat

1.42

1.34

Total cereals

3.17

1.45

Pulses

6.51

0.91

Edible oil

5.95

2.13

Sugar

8.22

0.14

Source: Surabi (2011)
Food Security:
According to FAO (Food security)
All people at all time have both physical and
economic access to the basic food they need.
WORLD BANK DEFINITION (1986):

“Access by all people at all times to enough food for an active,
healthy life. Its essential elements are the availability of food
and the ability to acquire it”
The World Food Summit of 1996 food security exists
“when all people, at all times have physical, social,
economic access to sufficient, safe and nutritious
food to maintain a healthy and active life”.
Food Security ensured in the country only if
Enough food is available for
all the persons.(Food

Food
Security

Availability)
There is no barrier on access
to food (FOOD ACCESS)

All persons have the
capacity to buy food of
acceptable quality(FOOD
Utilization) and

Food
Availability

Food
Access

Food
Utilization

Food security is a complex sustainable development issue.
Why India still not achieved food security?????
Growing population
Shifting of food grains area to non food grains areas.

Worrisome of food inflation
The sick public distribution system

Food subsidies
Climate change
18
Why food security is needed?
Ever growing population.
0

For the poor section of the society.
Natural disasters or natural calamity like
earthquake, flood and tsunami.
Wide spread of crop failure due to drought.
Stark realities of India
 India

has 872.9 (29%) million
undernourished people(FAO)
 49% of the world's underweight
children(WHO)
 34% of the world's stunted
children (WHO)
over 46% undernourished children
(WHO).
According to latest GHI report 2012
from IFPRI, India ranks 65 behind
china (2nd) and Pakistan (57th).
major States at hunger index and the underlying components
State

Punjab
Kerala
AP
Assam
Haryana
Tamilnadu
Rajasthan
West Bengal
UP
Maharashtra
Karnataka
Orissa
Gujarat
Chhattisgarh
Bihar
Jharkhand
MP
India

Prevalence of calorie
Under weight
undernourishment (%) children below 5
years (%)
11.1
28.6
19.6
14.6
15.1
29.1
14.0
18.5
14.5
27.0
28.1
21.4
23.3
23.3
17.3
19.6
23.4
20.0

24.6
22.7
32.7
36.4
39.7
30
40.4
38.5
42.3
36.7
37.6
40.9
44.7
47.6
56.1
57.1
59.8
42.5

Under 5
mortality rates
(deaths per
hundred Lives)
5.2
1.6
6.3
8.5
5.2
3.5
8.5
5.9
9.6
4.7
5.5
9.1
6.1
9.0
8.5
9.3
9.4
7.4

Indian state
hunger index
rank
1
2
3
4
5
6
7
8
9
10
11
12
13
14
15
16
17
Food insecurity will result in
Starvation
Famines and starvation deaths in India
Bengal famine 1943- killed 1.5 million to 3 million people.
Bihar famine 1966-67 – 2353 deaths due to starvation

Starvation deaths have also been reported in

1. Kalahandi and Kashipur in Orissa
2. Baran district of Rajasthan.

3. Palamau district of Jharkhand
According to report of the Food and Agricultural
Organization (FAO) of the United Nations, number of
hungry people in India had been:

1979-81: 261.5 million (38%)
1990-92: 215.6 million (25%)
1998-2000: 233.3 million (24%)

2000-2012: 300 million (30%)

26
Several schemes started to achieve food security are:
The Food for Work Programme was started in 1977-78.
In September 2001, different programmes were merged into an umbrella
programme called SGRY (Sampoorna Gramin Rozgar Yojana –
Comprehensive Rural Employment Scheme)
In February 2006, a National Rural Employment Guarantee (NREG) scheme
was launched in 200 most backward rural districts under NREG Act passed by
the Parliament.
The Rajiv Gandhi Drinking Water Mission,

Rashtriya Krishi Vikas Yojana with an outlay of Rs. 25000 crore
National Food Security Mission with an outlay of about Rs. 6,000
crore
Food security Management in India
•Procurement of food grains from farmers
remunerative prices.(Procurement price/MSP)

at

•Distribution of food grains to the consumers,
particularly the vulnerable sections of the society at
affordable prices through PDS and
•Maintenance of food buffers for food security and
price stability.
Public Distribution System (PDS)
Definition: Public distribution system is a government-sponsored
chain of shops (Fair price shops) entrusted with the work of
distributing basic food and non-food commodities to the needy
sections of the society at very cheap prices.

The Indian PDS is a national food security system that distributed
subsidized food to India’s poor. PDS means distribution of
essential commodities to a large number of people through a
network of Fair Price Shops (FPS) on recurring basis.
The commodities distributed are as follows:
Wheat
Rice
Sugar
Kerosene
In India there are about 4.5 lakh Fair price Shops distributing food
grains to about 16 crore families spending more than Rs.30,000 crore.

Each shop covers about 2000 people. PDS in India perhaps
the largest distribution network of its type in the world.
PDS Evolution in India
At the time of world war II British government introduced the first
structured public distribution of cereals in India through the
rationing system in Bombay and Calcutta.

In 1943 India abolished the rationing system.

After independence in 1950 due to inflationary pressure in the
economy, India reintroduced rationing .

Due to the ineffectiveness of Rationing System to reach the poor.
Contd……
Revamped Public distribution System (RPDS) was launched on
Jan 1 1992 and made effective from June 1, 1992, in selected
blocks (1775 blocks).

In June, 1997, Targeted Public distribution system (TPDS) was
launched. To target the needy people and provide them an assured
supply of food grains.

In TPDS the main aim was to target the “poor in all areas”. The
distribution of food grains operated under two tier system of
delivery to households
Below poverty line (BPL)
Above poverty line (APL)
In December 2000, Antyodaya Anna Yojana
Annapurna Scheme

In August 2001, Sampoorna Grameen Rozgar Yojana (integrated
rural employment scheme) - five million tons

Mid day meal scheme , wheat based nutrition programmes, scheme
for supply of food grains to SC/ST.
India’s Food Security System
Buffer
Stock

Food
Security
system of
India
Public
Distribution
System
How Public Distribution works:
Consumer

Farmers or
Producers

Grains

Distributes
Grains

MSP

Allocates Grains
FCI
(Maintains
Buffer
Stocks)

States

Central Issue Price
Stock position of food grains in the central pool vis-à-vis minimum buffer
norms
(Lakh tones)
Wheat

Rice

Total

As On

Actual
stock

Minimum
Buffer
norms

Actual
stock

Minimum
Buffer
norms

Actual
stock

Minimum
Buffer
norms

1.4.2010

161.25

70

267.13

142

428.38

212

1.7.2010

335.84

201

242.66

118

578.50

319

1.10.2010

277.77

140

184.44

72

462.21

212

1.1.2011

215.40

112

255.80

138

471.20

250

1.4.2011

153.64

70

288.20

142

441.84

212

1.7.2011

371.79

201

268.57

118

640.36

319

1.10.2011

314.26

140

203.59

72

517.85

212

1.1.2012

256.76

112

297.18

138

553.94

250

1.4.2012

199.52

70

333.50

142

533.02

212

1.7.2012

498.08

201

307.08

118

805.16

319

1.10.2012

431.53

140

233.73

72

665.26

212

1.1.2013

343.83

112

322.21

138

666.04

250

Source: Food, Civil supplies and consumer affairs
Quantum of food subsidies released by government of India
% of Total Govt

Year

Amount(crore)

2001-02

17,494.00

3.61

2002-03

24,176.45

4.83

2003-04

25,160.00

5.17

2004-05

25,746.45

6.21

2005-06

23,071.00

7.02

2006-07

23,827.00

7.90

2007-08

31,259.68

8.46

2008-09

43,668.08

9.60

2009-10

58,242.45

10.42

2010-11

62,929.56

13.20

2011-12

72,370.00

14.12

Source: Department of food and public distribution.

Expenditure
Allocation and off take of rice and wheat for the year 2012-13 under TPDS (in tones)
Allotment

States

Off take

BPL

AAY

APL

TOTAL

BPL

AAY

APL

TOTAL

AP
Arunachal Pradesh
Assam
Bihar
Chhattisgarh
Delhi
Goa
Gujarat
Haryana
HP
J&K
Jharkhand

175.348
4.254
79.204
281.562
80.948
18.166
0.922
91.728
34.762
22.190
33.616
103.328

109.048
2.664
49.282
175.070
50.324
10.514
1.018
56.680
20.470
13.790
17.898
64.254

352.740
10.010
185.990
160.680
76.080
71.190
8.566
199.110
70.770
52.010
74.620
58.860

637.136
16.926
314.476
617.312
207.352
99.820
10.506
347.518
126.002
87.990
126.134
226.442

219.00
4.336
77.737
301.501
78.519
21.927
0.922
98.389
34.960
20.854
34.894
98.235

138.263
2.631
48.242
204.842
50.324
8.942
1.018
65.084
18.152
13.769
19.055
62.575

245.779
9.367
150.401
33.378
66.516
79.010
9.927
119.022
35.658
52.876
82.199
0.955

603.142
16.604
276.380
539.721
195.359
109.879
11.867
282.495
88.770
87.509
136.148
161.766

Karnataka

139.410

79.635

189.242

408.288

150.498

85.486

196.331

457.315

136.680
167.340
335.790
16.870
18.620
6.930
12.466
83.214
105.240
193.080
4.340
280.076
29.890
463.890
52.470
280.322
4.480
5.400
0.540
0.662
2.560
affairs
4.200

245.448
456.085
793.174
28.492
31.430
11.690
21.146
365.996
137.995
363.250
7.380
620.472
50.540

77.780
170.136
299.549
7.531
8.271
2.790
6.775
194.262
12.568
101.948
2.340
229.266
13.056
455.633
23.119
279.755
0.679
0.313
0.840
0.202
0
4.296

46.998
92.999
181.040
4.524
5.187
1.720
4.524
84.429
6.032
64.014
1.156
150.537
8.559
301.191
12.054
85.637
0.210
0.010
0.355
0.137
0
2.379

155.214
71.309
188.614
19.914
19.661
6.691
15.156
70.652
68.956
196.184
4.409
261.334
31.670
360.256
54.534
266.953
1.772
5.214
0.540
0.654
1.100
3.513

279.992
337.445

Kerala
MP
Maharashtra
Manipur
Meghalaya
Mizoram
Nagaland
Orissa
Punjab
Rajasthan
Sikkim
TN
Tripura
UP
Uttarakand
West Bengal
A & N islands
Chandigarh
D & N haveli
Damen and Diu
Lakshadweep
Source:.
Pondicherry

Food,

67.058
178.036
284.904
7.168
7.896
2.940
5.352
194.262
20.196
104.922
1.884
209.872
12.730
460.950
21.498
258.930
0.890
0.626
0.838
0.174
0.126
Civil supplies
3.594

41.710
110.710
172.480
4.454
4.914
1.820
3.328
88.520
12.560
65.248
1.159
130.524
7.920
286.580
13.364
103.614
0.300
0.104
0.366
0.106
0.084
and consumer
2.258

1211.420
87.332
642.855
5.670
6.130
1.744
0.942
2.770
10.052

669.203
31.959
33.119
11.201
26.455
349.343
87.556
362.146
7.905
641.137
53.285

1117.080
89.707
632.345
2.661
5.537
1.746
0.993
1.100
10.188
Status of PDS in Karnataka
In Karnataka there are about 21026 active fair price shops.
Exclusion Error

Inclusion Error

Due to miss
classification

Due to
maladministration

Due to mis
classification

Due to
maladministration

4.2 lakh household

1.6 lakh household

52.3 lakh household

6.6 lakh household

Karnataka issued 1.6 crore ration card but the present total number of
family in the state is only 1.2 crore. that means 40 lakh ghost cards.

Karnataka’s PDS system occur an monthly leakage of Rs. 144.8crore.

Currently Karnataka food bill is issued under this Anna Bhagya
Scheme was introduced spending about Rs 460 crore a year.
Magnitude of loss at different levels of PDS in
Karnataka.

Source: Dr.R.Balasubramaniam, 2012
Off take of Rice and wheat during 2012-13 by Karnataka
In Tonnes
Scheme
(A)TPDS
AAY
BPL
APL
Sub Total
Special/Adhoc
Poorest districts
Sub Total (A)
(B) Welfare Schemes
MDM
WBNP
EFP
Hostels/Welfare Institutions
Annapurna
other
Sub total (B)
(C) other schemes
WEF, RELIEF,DEFENCE etc
Open sale/tender sale/export
Sub total(C)
Grand total (A+B+C)

Rice

Wheat

Total

51.31
86.82
52.95
191.08
14.38
13.06
218.52

25.34
49.82
74.81
150.01
7.76
6.71
164.44

76.65
136.64
127.75
341.08
22.14
19.77
382.95

15.33
1.88
0.13
1.78
0.39
0.19
19.70

3.27
6.31
0.00
0.22
0.10
0.47
10.39

18.60
8.19
0.13
2.00
0.49
0.66
30.09

1.53
0.46
1.99
240.21

0.10
56.42
56.52
231.35

1.63
56.88
58.51
471.56

Source: Karnataka Food, Civil supplies and consumer affairs
Leakages from PDS
Type of
leakage

>70 %

Bihar and Punjab

Very high leakage

25-50%

Assam, Gujarat, Himachal Pradesh,
Karnataka, Maharashtra and Rajasthan

<25 %

AP, Kerala, Orissa, TN and west Bengal

Very high leakages

>50%

Bihar, Haryana and Punjab

High leakage

25-50%

UP & Rajasthan

Moderate
leakage

10-25 %

Bihar, Gujarat, KTK, Maharashtra,Orissa,TN
and West Bengal

<10%

Assam,HP,MP, Orissa,TN & West Bengal.

Very high Leakage

>30%

Assam,HP &MP.

High leakage

10-50%

Bihar, Gujarat,Ktk,Maharashtra, Orissa,
Uttarpradesh and west Bengal

Moderate leakage

Leakage
through
ghost
card

Abnormal leakage

Low leakage

Leakage
at fair
price
shop

States

Low leakage

Total
leakage

Percent

<10%

AP,Haryana,Kerala,Punjab, Rajasthan and TN

Source: Food Security in India: Biswajit Chaterjee,2012
Diversion of Food grains
State

(kg/BPL Family/annum)

Off take by States

Off-take by identified BPL families

Food Grains not reaching
the poor house hold

AP

466.16

197.62

268.51

Assam

490.76

227.32

263.44

Bihar

138.13

12.24

125.89

Gujarat

320.24

169.47

150.77

Haryana

416.16

138.79

277.37

HP

492.22

266.14

226.08

KTK

480.80

139.91

340.89

Kerala

407.58

248.58

159.00

MP

365.57

124.04

241.53

Maharashtra

347.29

227.27

120.02

Orissa

276.37

175.88

100.49

Punjab

364.24

38.25

326.00

Rajasthan

366.53

238.43

128.10

TN

525.95

181.14

344.81

UP

285.16

92.73

192.43

West Bengal

336.78

246.19

90.59

16 states total

380.00

160.25

219.75
The Major reasons for leakage are:
Inclusion Error
Ghost Cards

Shadow Ownership
Non-accountability of FPS
Fallouts of P.D.S.
Inferior quality food grains.
Deceitful dealers replace good supplies received from
the F.C.I(Food Corporation of India) with inferior stock and sell FCI
stock in the black market.
Illicit fair price shop owners have been found to create large number
of bogus cards to sell food grains in the open market.
Many FPS dealers resort to malpractice, illegal diversions of
commodities, hoarding and black marketing due to the minimal
salary received by them.
Regional allocation and coverage of FPS are unsatisfactory and the
core objective of price stabilization of essential commodities has not
met.
Aadhaar and PDS: The Primary Focus
What is Aadhaar?
Demographic features like Name, Address, Gender and
Date of birth
Unique
identification
called Aadhaar

Biometric features

Iris

Finger print
Aadhaar can be a potent tool for the government in
making the PDS effective in these identified area in the
following manner:
One Aadhaar one beneficiary
Aadhaar as sufficient Proof of Identity(POI) and Proof of Address
(POA), these individuals can provided with ration cards.

Portability in Identification
Address the issues of leakages and proxy withdrawals.

Flexibility
Aadhaar in Karnataka
In Karnataka about 103 Biometric
Machines are introduced
Each machine costs about 46,000

Karnataka in total spending about
97 crore to install biometric
machine in all fair price shops
Bio-metric machine
Case Study
Case study I

Role and Effectiveness of Public
Distribution
System in providing Food Security in
India
Ms. Gurdeep kaur Ghumaan and Dr.
Pawan Kumar Dhiman
June 2013
Objective of the study:
1. To study the performance and challenges of food security in India.
2. Role and Effectiveness of Public Distribution System in providing
Food security in India.

Nature of Data
Secondary data were collected from NSSO( National Sample Survey
Organisation) . Information on purchases of rice, wheat, sugar, and
kerosene from fair price shops were also collected.

Study area
The study was conducted all over India.
Per capita consumption and percentage of households reporting
consumption from PDS of rice, wheat/atta, sugar and kerosene in
2004-05 and 2009-10, all-India

Sector Item

2009-10
Per capita
consumption(kg) % share of
PDS in qty.
PDS
Other consumed

2004-05
Per capita
consumption(kg)

3

4

5

6

Rice

1.408

4.594

23.5

0.839

Wheat/atta

0.619

3.625

14.6

Sugar

0.097

0.563

Kerosene

0.511

Rice

1

Other
source
7

2

PDS

% of hhs reporting
% share of
consn. From PDS
PDS in
during 30 days
qty.
consumed 2009-10 2004-05

8

9

10

5.537

13.2

39.1

24.4

0.307

3.885

7.3

27.6

11.0

14.7

0.062

0.587

9.6

27.6

15.9

0.081

86.3

0.477

0.142

77.1

81.8

72.8

0.814

3.706

18.0

0.530

4.181

11.3

20.5

13.1

Wheat/atta

0.371

3.706

9.1

0.167

4.192

3.8

17.6

5.8

Sugar

0.080

0.700

10.3

0.054

0.763

6.6

18.7

11.5

Kerosene

0.295

0.169

63.6

0.350

0.268

56.6

33.0

32.8

Rural

Urban
Percentage of households reporting : Wheat, Rice , Sugar and Kerosene
consumption from PDS; share of PDS in quantity consumed : major States
State

Andhra Pradesh
Assam
Bihar
Chhattisgarh
Gujarat
Haryana
Jharkhand
Karnataka
Kerala
Madhya Pradesh
Maharashtra
Orissa
Punjab
Rajasthan
Tamilnadu
Uttar Pradesh
West Bengal
All India

Wheat share of
PDS in
consumption
Rural
Urban
5.1
7.5
1.5
1.3
5.1
2.4
39.1
17.9
15.6
5.0
14.2
8.0
20.6
4.0
51.5
13.5
39.7
33.1
21.8
13.2
32.7
8.6
17.0
10.2
14.6
9.0
10.5
6.1
85.8
64.7
6.8
7.6
41.4
11.7
14.6
9.1

Rice share of PDS in
consumption
Rural
32.9
11.2
5.1
41.2
20.3
0.5
14.0
45.0
27.9
20.1
34.2
24.8
0.1
0.3
52.7
17.6
6.3
23.5

Urban
21.5
5.1
2.2
25.7
5.8
0.4
7.4
17.7
24.0
8.3
7.5
13.3
0.1
0.2
40.9
7.8
2.9
18.0

Sugar share of PDS
in consumption
Rural
24.5
53.2
0.9
28.6
14.5
2.1
4.6
18.9
11.2
14.1
9.8
16.0
0.0
0.9
73.2
7.0
11.2
14.7

Urban
12.3
31.0
1.7
11.0
3.3
1.9
1.7
5.4
8.5
6.0
4.6
8.9
0.3
0.7
62.6
2.1
4.3
10.3

Kerosene share of
PDS in consumption
Rural
91.46
72.46
83.99
89.34
93.47
92.89
67.32
85.36
95.59
90.95
86.43
83.53
82.13
93.51
91.49
85.99
80.01
86.24

Urban
67.14
54.55
70.16
82.38
56.52
53.64
36.68
50.84
90.37
79.33
47.64
52.52
23.50
79.80
72.05
82.69
73.22
63.58
Conclusion
Thank
you……

More Related Content

What's hot

STATUS OF PULSES ECONOMY IN INDIA: A LONG TERM VISION FOR PROMOTION OF PULSES
STATUS OF PULSES ECONOMY IN INDIA: A LONG TERM VISION FOR  PROMOTION OF PULSES STATUS OF PULSES ECONOMY IN INDIA: A LONG TERM VISION FOR  PROMOTION OF PULSES
STATUS OF PULSES ECONOMY IN INDIA: A LONG TERM VISION FOR PROMOTION OF PULSES Dr. Avinash S Naik
 
INDONESIAN AGRICULTURAL RESEARCH AND DEVELOPMENT TOWARDS 2030: AGRICULTURAL B...
INDONESIAN AGRICULTURAL RESEARCH AND DEVELOPMENT TOWARDS 2030: AGRICULTURAL B...INDONESIAN AGRICULTURAL RESEARCH AND DEVELOPMENT TOWARDS 2030: AGRICULTURAL B...
INDONESIAN AGRICULTURAL RESEARCH AND DEVELOPMENT TOWARDS 2030: AGRICULTURAL B...Hermanto .
 
Production and marketing of pulses
Production and marketing of pulsesProduction and marketing of pulses
Production and marketing of pulsesIndrajaPuram
 
Current Status and Future Perpectives of Agricultural Development: The Case o...
Current Status and Future Perpectives of Agricultural Development: The Case o...Current Status and Future Perpectives of Agricultural Development: The Case o...
Current Status and Future Perpectives of Agricultural Development: The Case o...Hermanto .
 
Food Science, Food Processing & Nutritional Security in India : An Overview
Food Science, Food Processing & Nutritional Security in India : An OverviewFood Science, Food Processing & Nutritional Security in India : An Overview
Food Science, Food Processing & Nutritional Security in India : An OverviewKaushik Khamrui
 
Overview of International Livestock Research (ILRI) activities in Ethiopia
Overview of International Livestock Research (ILRI) activities in EthiopiaOverview of International Livestock Research (ILRI) activities in Ethiopia
Overview of International Livestock Research (ILRI) activities in EthiopiaILRI
 
Value Chain of Corn in Indonesia (Based of Secondary Data)
Value Chain of Corn in Indonesia (Based of Secondary Data)Value Chain of Corn in Indonesia (Based of Secondary Data)
Value Chain of Corn in Indonesia (Based of Secondary Data)Muhamad Ahsan
 
assessing food and nutritional security
assessing food and nutritional securityassessing food and nutritional security
assessing food and nutritional securitysana l acharya
 
Future challenges of agriculture and food systems
Future challenges of agriculture and food systemsFuture challenges of agriculture and food systems
Future challenges of agriculture and food systemsVIJAY SARDANA
 
Food Policy to add Nutrition to rice for public health in Bangladesh
Food Policy to add Nutrition to rice for public health in BangladeshFood Policy to add Nutrition to rice for public health in Bangladesh
Food Policy to add Nutrition to rice for public health in BangladeshMd. Nazim Uddin Mondal
 
Insights from the transformation of dairy in India
Insights from the transformation of dairy in IndiaInsights from the transformation of dairy in India
Insights from the transformation of dairy in IndiaILRI
 
Livestock -Backbone of Rural India
Livestock -Backbone of Rural IndiaLivestock -Backbone of Rural India
Livestock -Backbone of Rural IndiaAYSHA NADA
 
Rice trade and industry november 5 2013
Rice trade and industry november 5 2013Rice trade and industry november 5 2013
Rice trade and industry november 5 2013Somporn Isvilanonda
 
ILRI’s Future in the Emerging Global Context: What are the critical outcomes ...
ILRI’s Future in the Emerging Global Context: What are the critical outcomes ...ILRI’s Future in the Emerging Global Context: What are the critical outcomes ...
ILRI’s Future in the Emerging Global Context: What are the critical outcomes ...ILRI
 
Food security
Food securityFood security
Food securityvishnugud
 

What's hot (20)

Food Security in Afghanistan
Food Security in AfghanistanFood Security in Afghanistan
Food Security in Afghanistan
 
STATUS OF PULSES ECONOMY IN INDIA: A LONG TERM VISION FOR PROMOTION OF PULSES
STATUS OF PULSES ECONOMY IN INDIA: A LONG TERM VISION FOR  PROMOTION OF PULSES STATUS OF PULSES ECONOMY IN INDIA: A LONG TERM VISION FOR  PROMOTION OF PULSES
STATUS OF PULSES ECONOMY IN INDIA: A LONG TERM VISION FOR PROMOTION OF PULSES
 
INDONESIAN AGRICULTURAL RESEARCH AND DEVELOPMENT TOWARDS 2030: AGRICULTURAL B...
INDONESIAN AGRICULTURAL RESEARCH AND DEVELOPMENT TOWARDS 2030: AGRICULTURAL B...INDONESIAN AGRICULTURAL RESEARCH AND DEVELOPMENT TOWARDS 2030: AGRICULTURAL B...
INDONESIAN AGRICULTURAL RESEARCH AND DEVELOPMENT TOWARDS 2030: AGRICULTURAL B...
 
IFPRI- dynamics of pulses production
IFPRI-  dynamics of pulses productionIFPRI-  dynamics of pulses production
IFPRI- dynamics of pulses production
 
Production and marketing of pulses
Production and marketing of pulsesProduction and marketing of pulses
Production and marketing of pulses
 
Current Status and Future Perpectives of Agricultural Development: The Case o...
Current Status and Future Perpectives of Agricultural Development: The Case o...Current Status and Future Perpectives of Agricultural Development: The Case o...
Current Status and Future Perpectives of Agricultural Development: The Case o...
 
Food Science, Food Processing & Nutritional Security in India : An Overview
Food Science, Food Processing & Nutritional Security in India : An OverviewFood Science, Food Processing & Nutritional Security in India : An Overview
Food Science, Food Processing & Nutritional Security in India : An Overview
 
Overview of International Livestock Research (ILRI) activities in Ethiopia
Overview of International Livestock Research (ILRI) activities in EthiopiaOverview of International Livestock Research (ILRI) activities in Ethiopia
Overview of International Livestock Research (ILRI) activities in Ethiopia
 
Value Chain of Corn in Indonesia (Based of Secondary Data)
Value Chain of Corn in Indonesia (Based of Secondary Data)Value Chain of Corn in Indonesia (Based of Secondary Data)
Value Chain of Corn in Indonesia (Based of Secondary Data)
 
assessing food and nutritional security
assessing food and nutritional securityassessing food and nutritional security
assessing food and nutritional security
 
Future challenges of agriculture and food systems
Future challenges of agriculture and food systemsFuture challenges of agriculture and food systems
Future challenges of agriculture and food systems
 
Food Policy to add Nutrition to rice for public health in Bangladesh
Food Policy to add Nutrition to rice for public health in BangladeshFood Policy to add Nutrition to rice for public health in Bangladesh
Food Policy to add Nutrition to rice for public health in Bangladesh
 
Global pulses consumption, production and trade scenario: Trends and Outlook
Global pulses consumption, production and trade scenario: Trends and OutlookGlobal pulses consumption, production and trade scenario: Trends and Outlook
Global pulses consumption, production and trade scenario: Trends and Outlook
 
Insights from the transformation of dairy in India
Insights from the transformation of dairy in IndiaInsights from the transformation of dairy in India
Insights from the transformation of dairy in India
 
Livestock -Backbone of Rural India
Livestock -Backbone of Rural IndiaLivestock -Backbone of Rural India
Livestock -Backbone of Rural India
 
Rice trade and industry november 5 2013
Rice trade and industry november 5 2013Rice trade and industry november 5 2013
Rice trade and industry november 5 2013
 
IFPRI- Pulses - An Integral Component for Mitigation and Adaptation under Cli...
IFPRI- Pulses - An Integral Component for Mitigation and Adaptation under Cli...IFPRI- Pulses - An Integral Component for Mitigation and Adaptation under Cli...
IFPRI- Pulses - An Integral Component for Mitigation and Adaptation under Cli...
 
ILRI’s Future in the Emerging Global Context: What are the critical outcomes ...
ILRI’s Future in the Emerging Global Context: What are the critical outcomes ...ILRI’s Future in the Emerging Global Context: What are the critical outcomes ...
ILRI’s Future in the Emerging Global Context: What are the critical outcomes ...
 
Food security
Food securityFood security
Food security
 
IFPRI - Export of Pulses from Canada, Gordon Bacon, Pulse Canada
IFPRI - Export of Pulses from Canada, Gordon Bacon, Pulse CanadaIFPRI - Export of Pulses from Canada, Gordon Bacon, Pulse Canada
IFPRI - Export of Pulses from Canada, Gordon Bacon, Pulse Canada
 

Similar to Agriculture performance food security and public distristribution system.

Food security and public distribution system
Food security and public distribution systemFood security and public distribution system
Food security and public distribution systemshivalika sood
 
202317812-national-food-security-act-2013.pdf
202317812-national-food-security-act-2013.pdf202317812-national-food-security-act-2013.pdf
202317812-national-food-security-act-2013.pdfRoyalSamara
 
An overview on ‘Agricultural Development in indeveloping India’
An overview on ‘Agricultural Development in indeveloping India’An overview on ‘Agricultural Development in indeveloping India’
An overview on ‘Agricultural Development in indeveloping India’RHIMRJ Journal
 
Ppt on food security issues and challenges beofe india
Ppt on food security issues and challenges beofe indiaPpt on food security issues and challenges beofe india
Ppt on food security issues and challenges beofe indiaDr. Mohmed Amin Mir
 
Food security as a challenge to the food
Food security as a challenge to the foodFood security as a challenge to the food
Food security as a challenge to the foodHamza Riaz
 
Food security
Food securityFood security
Food securityntsh0809
 
Food security in_india
Food security in_indiaFood security in_india
Food security in_indiaPoonam Singh
 
Seminar food security
Seminar food securitySeminar food security
Seminar food securityJagriti Rohit
 
Food security with reference to PDS in India
Food security with reference to PDS in IndiaFood security with reference to PDS in India
Food security with reference to PDS in IndiaNamami Gohain
 
status of india in agriculture production
status of india in  agriculture production status of india in  agriculture production
status of india in agriculture production mehtagoldy456
 
Iiste hybrad rice and con rice
Iiste hybrad rice and con riceIiste hybrad rice and con rice
Iiste hybrad rice and con ricesanaullah noonari
 
Performance of Hybrid and Conventional Rice Varieties in Sindh
Performance of Hybrid and Conventional Rice Varieties in SindhPerformance of Hybrid and Conventional Rice Varieties in Sindh
Performance of Hybrid and Conventional Rice Varieties in Sindhsanaullah noonari
 
Micronutrient initiative of India: Policy considerations and contribution of ...
Micronutrient initiative of India: Policy considerations and contribution of ...Micronutrient initiative of India: Policy considerations and contribution of ...
Micronutrient initiative of India: Policy considerations and contribution of ...ILRI
 
Growth and performance of agriculture and its future challenges
Growth and performance of agriculture and its future challengesGrowth and performance of agriculture and its future challenges
Growth and performance of agriculture and its future challengesMohit Chauhan
 
Role and contribution of working equines in India
Role and contribution of working equines in IndiaRole and contribution of working equines in India
Role and contribution of working equines in IndiaILRI
 

Similar to Agriculture performance food security and public distristribution system. (20)

Food security and public distribution system
Food security and public distribution systemFood security and public distribution system
Food security and public distribution system
 
202317812-national-food-security-act-2013.pdf
202317812-national-food-security-act-2013.pdf202317812-national-food-security-act-2013.pdf
202317812-national-food-security-act-2013.pdf
 
An overview on ‘Agricultural Development in indeveloping India’
An overview on ‘Agricultural Development in indeveloping India’An overview on ‘Agricultural Development in indeveloping India’
An overview on ‘Agricultural Development in indeveloping India’
 
Dr. r.b.singh
Dr. r.b.singhDr. r.b.singh
Dr. r.b.singh
 
Ppt on food security issues and challenges beofe india
Ppt on food security issues and challenges beofe indiaPpt on food security issues and challenges beofe india
Ppt on food security issues and challenges beofe india
 
Food security as a challenge to the food
Food security as a challenge to the foodFood security as a challenge to the food
Food security as a challenge to the food
 
Food security
Food securityFood security
Food security
 
Food security in_india
Food security in_indiaFood security in_india
Food security in_india
 
Seminar food security
Seminar food securitySeminar food security
Seminar food security
 
Food security with reference to PDS in India
Food security with reference to PDS in IndiaFood security with reference to PDS in India
Food security with reference to PDS in India
 
The right to food in india
The right to food in indiaThe right to food in india
The right to food in india
 
status of india in agriculture production
status of india in  agriculture production status of india in  agriculture production
status of india in agriculture production
 
Food Security & Challenges 2010
Food Security & Challenges 2010Food Security & Challenges 2010
Food Security & Challenges 2010
 
Iiste hybrad rice and con rice
Iiste hybrad rice and con riceIiste hybrad rice and con rice
Iiste hybrad rice and con rice
 
Performance of Hybrid and Conventional Rice Varieties in Sindh
Performance of Hybrid and Conventional Rice Varieties in SindhPerformance of Hybrid and Conventional Rice Varieties in Sindh
Performance of Hybrid and Conventional Rice Varieties in Sindh
 
Food Problem In India
Food Problem In IndiaFood Problem In India
Food Problem In India
 
Food security
Food securityFood security
Food security
 
Micronutrient initiative of India: Policy considerations and contribution of ...
Micronutrient initiative of India: Policy considerations and contribution of ...Micronutrient initiative of India: Policy considerations and contribution of ...
Micronutrient initiative of India: Policy considerations and contribution of ...
 
Growth and performance of agriculture and its future challenges
Growth and performance of agriculture and its future challengesGrowth and performance of agriculture and its future challenges
Growth and performance of agriculture and its future challenges
 
Role and contribution of working equines in India
Role and contribution of working equines in IndiaRole and contribution of working equines in India
Role and contribution of working equines in India
 

Recently uploaded

SIEMENS: RAPUNZEL – A Tale About Knowledge Graph
SIEMENS: RAPUNZEL – A Tale About Knowledge GraphSIEMENS: RAPUNZEL – A Tale About Knowledge Graph
SIEMENS: RAPUNZEL – A Tale About Knowledge GraphNeo4j
 
Build your next Gen AI Breakthrough - April 2024
Build your next Gen AI Breakthrough - April 2024Build your next Gen AI Breakthrough - April 2024
Build your next Gen AI Breakthrough - April 2024Neo4j
 
Unleash Your Potential - Namagunga Girls Coding Club
Unleash Your Potential - Namagunga Girls Coding ClubUnleash Your Potential - Namagunga Girls Coding Club
Unleash Your Potential - Namagunga Girls Coding ClubKalema Edgar
 
Kotlin Multiplatform & Compose Multiplatform - Starter kit for pragmatics
Kotlin Multiplatform & Compose Multiplatform - Starter kit for pragmaticsKotlin Multiplatform & Compose Multiplatform - Starter kit for pragmatics
Kotlin Multiplatform & Compose Multiplatform - Starter kit for pragmaticscarlostorres15106
 
"LLMs for Python Engineers: Advanced Data Analysis and Semantic Kernel",Oleks...
"LLMs for Python Engineers: Advanced Data Analysis and Semantic Kernel",Oleks..."LLMs for Python Engineers: Advanced Data Analysis and Semantic Kernel",Oleks...
"LLMs for Python Engineers: Advanced Data Analysis and Semantic Kernel",Oleks...Fwdays
 
Bun (KitWorks Team Study 노별마루 발표 2024.4.22)
Bun (KitWorks Team Study 노별마루 발표 2024.4.22)Bun (KitWorks Team Study 노별마루 발표 2024.4.22)
Bun (KitWorks Team Study 노별마루 발표 2024.4.22)Wonjun Hwang
 
Understanding the Laravel MVC Architecture
Understanding the Laravel MVC ArchitectureUnderstanding the Laravel MVC Architecture
Understanding the Laravel MVC ArchitecturePixlogix Infotech
 
costume and set research powerpoint presentation
costume and set research powerpoint presentationcostume and set research powerpoint presentation
costume and set research powerpoint presentationphoebematthew05
 
Enhancing Worker Digital Experience: A Hands-on Workshop for Partners
Enhancing Worker Digital Experience: A Hands-on Workshop for PartnersEnhancing Worker Digital Experience: A Hands-on Workshop for Partners
Enhancing Worker Digital Experience: A Hands-on Workshop for PartnersThousandEyes
 
Swan(sea) Song – personal research during my six years at Swansea ... and bey...
Swan(sea) Song – personal research during my six years at Swansea ... and bey...Swan(sea) Song – personal research during my six years at Swansea ... and bey...
Swan(sea) Song – personal research during my six years at Swansea ... and bey...Alan Dix
 
My Hashitalk Indonesia April 2024 Presentation
My Hashitalk Indonesia April 2024 PresentationMy Hashitalk Indonesia April 2024 Presentation
My Hashitalk Indonesia April 2024 PresentationRidwan Fadjar
 
APIForce Zurich 5 April Automation LPDG
APIForce Zurich 5 April  Automation LPDGAPIForce Zurich 5 April  Automation LPDG
APIForce Zurich 5 April Automation LPDGMarianaLemus7
 
Snow Chain-Integrated Tire for a Safe Drive on Winter Roads
Snow Chain-Integrated Tire for a Safe Drive on Winter RoadsSnow Chain-Integrated Tire for a Safe Drive on Winter Roads
Snow Chain-Integrated Tire for a Safe Drive on Winter RoadsHyundai Motor Group
 
CloudStudio User manual (basic edition):
CloudStudio User manual (basic edition):CloudStudio User manual (basic edition):
CloudStudio User manual (basic edition):comworks
 
Science&tech:THE INFORMATION AGE STS.pdf
Science&tech:THE INFORMATION AGE STS.pdfScience&tech:THE INFORMATION AGE STS.pdf
Science&tech:THE INFORMATION AGE STS.pdfjimielynbastida
 
Connect Wave/ connectwave Pitch Deck Presentation
Connect Wave/ connectwave Pitch Deck PresentationConnect Wave/ connectwave Pitch Deck Presentation
Connect Wave/ connectwave Pitch Deck PresentationSlibray Presentation
 
Transcript: New from BookNet Canada for 2024: BNC BiblioShare - Tech Forum 2024
Transcript: New from BookNet Canada for 2024: BNC BiblioShare - Tech Forum 2024Transcript: New from BookNet Canada for 2024: BNC BiblioShare - Tech Forum 2024
Transcript: New from BookNet Canada for 2024: BNC BiblioShare - Tech Forum 2024BookNet Canada
 

Recently uploaded (20)

SIEMENS: RAPUNZEL – A Tale About Knowledge Graph
SIEMENS: RAPUNZEL – A Tale About Knowledge GraphSIEMENS: RAPUNZEL – A Tale About Knowledge Graph
SIEMENS: RAPUNZEL – A Tale About Knowledge Graph
 
The transition to renewables in India.pdf
The transition to renewables in India.pdfThe transition to renewables in India.pdf
The transition to renewables in India.pdf
 
Build your next Gen AI Breakthrough - April 2024
Build your next Gen AI Breakthrough - April 2024Build your next Gen AI Breakthrough - April 2024
Build your next Gen AI Breakthrough - April 2024
 
Unleash Your Potential - Namagunga Girls Coding Club
Unleash Your Potential - Namagunga Girls Coding ClubUnleash Your Potential - Namagunga Girls Coding Club
Unleash Your Potential - Namagunga Girls Coding Club
 
Kotlin Multiplatform & Compose Multiplatform - Starter kit for pragmatics
Kotlin Multiplatform & Compose Multiplatform - Starter kit for pragmaticsKotlin Multiplatform & Compose Multiplatform - Starter kit for pragmatics
Kotlin Multiplatform & Compose Multiplatform - Starter kit for pragmatics
 
"LLMs for Python Engineers: Advanced Data Analysis and Semantic Kernel",Oleks...
"LLMs for Python Engineers: Advanced Data Analysis and Semantic Kernel",Oleks..."LLMs for Python Engineers: Advanced Data Analysis and Semantic Kernel",Oleks...
"LLMs for Python Engineers: Advanced Data Analysis and Semantic Kernel",Oleks...
 
Bun (KitWorks Team Study 노별마루 발표 2024.4.22)
Bun (KitWorks Team Study 노별마루 발표 2024.4.22)Bun (KitWorks Team Study 노별마루 발표 2024.4.22)
Bun (KitWorks Team Study 노별마루 발표 2024.4.22)
 
Understanding the Laravel MVC Architecture
Understanding the Laravel MVC ArchitectureUnderstanding the Laravel MVC Architecture
Understanding the Laravel MVC Architecture
 
costume and set research powerpoint presentation
costume and set research powerpoint presentationcostume and set research powerpoint presentation
costume and set research powerpoint presentation
 
Enhancing Worker Digital Experience: A Hands-on Workshop for Partners
Enhancing Worker Digital Experience: A Hands-on Workshop for PartnersEnhancing Worker Digital Experience: A Hands-on Workshop for Partners
Enhancing Worker Digital Experience: A Hands-on Workshop for Partners
 
Swan(sea) Song – personal research during my six years at Swansea ... and bey...
Swan(sea) Song – personal research during my six years at Swansea ... and bey...Swan(sea) Song – personal research during my six years at Swansea ... and bey...
Swan(sea) Song – personal research during my six years at Swansea ... and bey...
 
E-Vehicle_Hacking_by_Parul Sharma_null_owasp.pptx
E-Vehicle_Hacking_by_Parul Sharma_null_owasp.pptxE-Vehicle_Hacking_by_Parul Sharma_null_owasp.pptx
E-Vehicle_Hacking_by_Parul Sharma_null_owasp.pptx
 
My Hashitalk Indonesia April 2024 Presentation
My Hashitalk Indonesia April 2024 PresentationMy Hashitalk Indonesia April 2024 Presentation
My Hashitalk Indonesia April 2024 Presentation
 
APIForce Zurich 5 April Automation LPDG
APIForce Zurich 5 April  Automation LPDGAPIForce Zurich 5 April  Automation LPDG
APIForce Zurich 5 April Automation LPDG
 
Snow Chain-Integrated Tire for a Safe Drive on Winter Roads
Snow Chain-Integrated Tire for a Safe Drive on Winter RoadsSnow Chain-Integrated Tire for a Safe Drive on Winter Roads
Snow Chain-Integrated Tire for a Safe Drive on Winter Roads
 
CloudStudio User manual (basic edition):
CloudStudio User manual (basic edition):CloudStudio User manual (basic edition):
CloudStudio User manual (basic edition):
 
Science&tech:THE INFORMATION AGE STS.pdf
Science&tech:THE INFORMATION AGE STS.pdfScience&tech:THE INFORMATION AGE STS.pdf
Science&tech:THE INFORMATION AGE STS.pdf
 
Connect Wave/ connectwave Pitch Deck Presentation
Connect Wave/ connectwave Pitch Deck PresentationConnect Wave/ connectwave Pitch Deck Presentation
Connect Wave/ connectwave Pitch Deck Presentation
 
Hot Sexy call girls in Panjabi Bagh 🔝 9953056974 🔝 Delhi escort Service
Hot Sexy call girls in Panjabi Bagh 🔝 9953056974 🔝 Delhi escort ServiceHot Sexy call girls in Panjabi Bagh 🔝 9953056974 🔝 Delhi escort Service
Hot Sexy call girls in Panjabi Bagh 🔝 9953056974 🔝 Delhi escort Service
 
Transcript: New from BookNet Canada for 2024: BNC BiblioShare - Tech Forum 2024
Transcript: New from BookNet Canada for 2024: BNC BiblioShare - Tech Forum 2024Transcript: New from BookNet Canada for 2024: BNC BiblioShare - Tech Forum 2024
Transcript: New from BookNet Canada for 2024: BNC BiblioShare - Tech Forum 2024
 

Agriculture performance food security and public distristribution system.

  • 1.
  • 2. Seminar - I Agriculture Performance- Food Security and Public Distribution System (PDS) Major advisor Dr. H. Basavaraja By Najath Paraveen Navalur PGS12AGR5750 UAS Dharwad
  • 3. Flow of Presentation Introduction Agriculture performance in India Food security - Dimensions of food security Projected demand & supply of food- food gap Public distribution system (pds) Case study conclusion
  • 5. India’s population is 1.25 billion. India’s food grain tonnes. production 259 million India achieved national food self -sufficiency 35 years ago, Yet about 35% of its population remains food insecure. Low incomes and high food prices prevent individual food security. Another aspect of India’s food insecurity situation is that even after over three decades of operation, Public Distribution System (PDS) meets less than 10% of consumption of grains by the poor.
  • 6. Indian Agriculture Sector Agriculture is the backbone of the Indian economy. Around 58% Agriculture. population of India depends on Produces 51 major Crops. India ranks second worldwide in farm output. India is the leading producer of Jute, pulses mangoes, bananas, cashew nuts and ginger..
  • 7. Second largest producer of wheat, , sugar, cotton, fruits and vegetables. paddy Agriculture accounts for 10% of the total exports earning and provide raw material to a large number of industries. India ranks among world’s 5 largest producers of over 80% of agriculture commodity viz coffee, cotton, livestock and poultry meat. Contributes 16% to GDP.
  • 8. Success story of Indian Agriculture…… Prior mid-1960s India relied on imports (PL-480). Punjab led India's green revolution. A hectare of Indian wheat farms that produced an average of 0.8 tonnes in 1948, produced 4.7 tonnes of wheat in 1975 from the same land. By 2000, Indian farms adopted wheat varieties capable of yielding 6 tonnes of wheat per hectare.
  • 9. Agriculture productivity in India, growth in average yields from 1970 to 2010 Average YIELD, 1970-1971 Average YIELD, 1990-1991 Average YIELD, 2010–2011 Kg/ha Kg/ha Kg/ha Rice 1123 1740 2240 Wheat 1307 2281 2938 Pulses 524 578 689 Oilseeds 579 771 1325 Sugarcane 48322 65395 68596 Tea 1182 1652 1669 Cotton 106 225 510 Crop
  • 10. Mile Stones in Agricultural Development Special programmes were undertaken to improve food cash crops supply and Grow more food campaign (1940). Integrated production and cash crops. programmes (1950) focused on food Five year plans of India- oriented towards agriculture development. Land reclamation, land development, mechanization, electrification, use of fertilizers, chemicals. Green revolution(1960). Yellow revolution (1986-1990). Operation Flood(1970-1996). Blue revolution (1973-2002).
  • 11. Total Output in last five years 155 Agriculture Output in USD(b) 150 Growth only 2 % 145 140 135 130 125 120 115 FY07 FY08 FY09 FY10 Value In USD (b) Source: Ministry of Agriculture FY11 FY12
  • 12. Agriculture contribution to GDP Contribution to GDP in % 14.8% 14.6% 14.4% 14.01 14.2% 14.0% 13.7 13.8% 13.6% 13.4% 13.2% 2009-10 2010-11 Years Source: Ministry of Agriculture 2011-12 2012-13
  • 13. India’s food grain (rice, wheat, coarse grains and pulses) production. Year Food production 1950-51 50.8mt 1960-61 82mt 1970-71 108.4mt 1980-81 129.6mt 1990-91 176.4mt 2000-01 196.8mt 2011-12 259mt 2012-13 255mt Source: Ministry of Agriculture, India
  • 14. Food grain production in India (million tones) Year Rice Wheat Other cereals Pulses Total food grains Increase per year 2000-01 84.98 69.68 31.07 11.08 196.81 - 2001-02 93.34 72.77 33.37 13.37 212.85 8.1 2002-03 71.82 65.76 26.06 11.13 174.77 -17.8 2003-04 88.53 72.16 37.59 14.91 213.19 21.98 2004-05 83.13 68.64 33.46 13.13 198.36 -6.95 2005-06 91.79 69.35 34.08 13.38 208.60 5.2 2006-07 93.36 75.81 33.91 14.20 217.28 4.2 2007-08 96.69 78.57 40.76 14.76 230.78 6.2 2008-09 99.18 80.68 40.04 14.57 234.47 1.6 2009-10 89.09 80.80 33.56 14.66 218.11 -7.0 2010-11 95.98 86.87 43.4 18.24 244.49 12.2 2011-12 105.30 94.88 42.02 17.09 259.29 6.1 2012-13 104.40 92.46 40.05 18.45 255.36 -1.5 Source: Economic survey, 2011-12
  • 15. Crops Rice Wheat Jowar Bajra Maize Ragi Small millets Barley Coarse cereals Average Annual growth rate 10th plan (2002-03 to 2006-07) Area Production Yield -0.39 1.25 1.17 1.30 1.11 -0.32 -0.89 2.07 -2.84 1.67 17.12 7.28 3.77 4.02 -0.15 -5.52 -2.67 0.40 -5.03 -2.49 2.32 -0.28 -1.21 -0.90 2.55 1.75 -0.26 Total cereals 0.07 Gram 3.60 Tur 1.38 Total pulses 1.31 Total food grains 0.29 Sugar cane 3.98 Ground nut -1.65 Seasamum 0.98 Rape and mustard 7.32 Sunflower 14.04 Soyabean 5.80 Total nine oilseeds 3.55 Cotton 0.57 Jute Source: Indiastat.com -1.82 1.21 4.70 1.06 2.66 1.29 4.90 3.61 3.64 11.55 13.83 12.26 7.99 20.01 -0.38 0.74 0.28 -0.41 0.65 0.59 0.66 4.32 0.51 3.24 0.37 6.18 3.53 19.40 1.49 Average Annual growth rate 11th plan (2007-08 to 2011-12) Area Production Yield 0.18 2.69 2.41 1.31 4.61 3.29 -3.00 3.26 -5.71 -1.38 7.84 8.64 2.16 8.90 6.74 0.41 8.11 6.66 -4.42 -0.13 4.08 0.61 6.32 4.64 5.68 7.27 -1.59 -0.03 2.32 3.13 1.36 0.19 0.04 -0.86 2.42 -1.69 -18.74 4.00 -0.07 5.97 0.47 3.79 4.62 4.84 4.28 3.80 0.99 15.82 8.28 -0.37 -14.46 7.71 5.54 10.46 1.26 3.76 2.27 1.54 2.78 3.55 0.87 13.91 5.30 0.76 6.20 3.90 5.32 3.93 0.62
  • 16. Growth rates of Population and net food grain production Years Population (In million) Net production of food grains (in million tons) CGR per decade of the growth of population CGR per decade of the growth of food grains 1951 363.2 48.1 - - 1961 442.4 72.0 1.99 4.12 1971 551.3 94.9 2.23 2.80 1981 688.5 113.4 2.25 1.80 1991 851.7 154.3 2.15 3.13 2001 1027 172.2 1.95 1.10 2011 1210.2 210.2 1.65 2.89 Average 733.47 123.59 - - S.D 28.9 53.57 - - C.V 39.40 43.34 - - Source: The relevance of the concept of food security in the context of the Indian Economy, Dhirendra Nath Konar, 2012
  • 17. Supply-Demand Gap for selected Food Item (million metric tones) Gap (Supply-Demand) Food items 2011 2021 2026 Rice 1.26 8.98 9.13 Wheat 21.21 27.33 32.04 Total cereals 21.19 -2.94 -16.97 Pulses -8.05 -24.92 -39.31 Edible oil -6.66 -17.68 -26.99 Sugar -4.31 -39.67 -74.13 Source: Surabi (2011)
  • 18. Per cent annual growth rate of projected supply and demand Food items Demand Supply Rice 1.55 1.01 Wheat 1.42 1.34 Total cereals 3.17 1.45 Pulses 6.51 0.91 Edible oil 5.95 2.13 Sugar 8.22 0.14 Source: Surabi (2011)
  • 19. Food Security: According to FAO (Food security) All people at all time have both physical and economic access to the basic food they need. WORLD BANK DEFINITION (1986): “Access by all people at all times to enough food for an active, healthy life. Its essential elements are the availability of food and the ability to acquire it” The World Food Summit of 1996 food security exists “when all people, at all times have physical, social, economic access to sufficient, safe and nutritious food to maintain a healthy and active life”.
  • 20. Food Security ensured in the country only if Enough food is available for all the persons.(Food Food Security Availability) There is no barrier on access to food (FOOD ACCESS) All persons have the capacity to buy food of acceptable quality(FOOD Utilization) and Food Availability Food Access Food Utilization Food security is a complex sustainable development issue.
  • 21. Why India still not achieved food security????? Growing population Shifting of food grains area to non food grains areas. Worrisome of food inflation The sick public distribution system Food subsidies Climate change 18
  • 22. Why food security is needed? Ever growing population. 0 For the poor section of the society. Natural disasters or natural calamity like earthquake, flood and tsunami. Wide spread of crop failure due to drought.
  • 23. Stark realities of India  India has 872.9 (29%) million undernourished people(FAO)  49% of the world's underweight children(WHO)  34% of the world's stunted children (WHO) over 46% undernourished children (WHO). According to latest GHI report 2012 from IFPRI, India ranks 65 behind china (2nd) and Pakistan (57th).
  • 24. major States at hunger index and the underlying components State Punjab Kerala AP Assam Haryana Tamilnadu Rajasthan West Bengal UP Maharashtra Karnataka Orissa Gujarat Chhattisgarh Bihar Jharkhand MP India Prevalence of calorie Under weight undernourishment (%) children below 5 years (%) 11.1 28.6 19.6 14.6 15.1 29.1 14.0 18.5 14.5 27.0 28.1 21.4 23.3 23.3 17.3 19.6 23.4 20.0 24.6 22.7 32.7 36.4 39.7 30 40.4 38.5 42.3 36.7 37.6 40.9 44.7 47.6 56.1 57.1 59.8 42.5 Under 5 mortality rates (deaths per hundred Lives) 5.2 1.6 6.3 8.5 5.2 3.5 8.5 5.9 9.6 4.7 5.5 9.1 6.1 9.0 8.5 9.3 9.4 7.4 Indian state hunger index rank 1 2 3 4 5 6 7 8 9 10 11 12 13 14 15 16 17
  • 25.
  • 26. Food insecurity will result in Starvation Famines and starvation deaths in India Bengal famine 1943- killed 1.5 million to 3 million people. Bihar famine 1966-67 – 2353 deaths due to starvation Starvation deaths have also been reported in 1. Kalahandi and Kashipur in Orissa 2. Baran district of Rajasthan. 3. Palamau district of Jharkhand
  • 27. According to report of the Food and Agricultural Organization (FAO) of the United Nations, number of hungry people in India had been: 1979-81: 261.5 million (38%) 1990-92: 215.6 million (25%) 1998-2000: 233.3 million (24%) 2000-2012: 300 million (30%) 26
  • 28. Several schemes started to achieve food security are: The Food for Work Programme was started in 1977-78. In September 2001, different programmes were merged into an umbrella programme called SGRY (Sampoorna Gramin Rozgar Yojana – Comprehensive Rural Employment Scheme) In February 2006, a National Rural Employment Guarantee (NREG) scheme was launched in 200 most backward rural districts under NREG Act passed by the Parliament. The Rajiv Gandhi Drinking Water Mission, Rashtriya Krishi Vikas Yojana with an outlay of Rs. 25000 crore National Food Security Mission with an outlay of about Rs. 6,000 crore
  • 29. Food security Management in India •Procurement of food grains from farmers remunerative prices.(Procurement price/MSP) at •Distribution of food grains to the consumers, particularly the vulnerable sections of the society at affordable prices through PDS and •Maintenance of food buffers for food security and price stability.
  • 30.
  • 31. Public Distribution System (PDS) Definition: Public distribution system is a government-sponsored chain of shops (Fair price shops) entrusted with the work of distributing basic food and non-food commodities to the needy sections of the society at very cheap prices. The Indian PDS is a national food security system that distributed subsidized food to India’s poor. PDS means distribution of essential commodities to a large number of people through a network of Fair Price Shops (FPS) on recurring basis.
  • 32. The commodities distributed are as follows: Wheat Rice Sugar Kerosene In India there are about 4.5 lakh Fair price Shops distributing food grains to about 16 crore families spending more than Rs.30,000 crore. Each shop covers about 2000 people. PDS in India perhaps the largest distribution network of its type in the world.
  • 33. PDS Evolution in India At the time of world war II British government introduced the first structured public distribution of cereals in India through the rationing system in Bombay and Calcutta. In 1943 India abolished the rationing system. After independence in 1950 due to inflationary pressure in the economy, India reintroduced rationing . Due to the ineffectiveness of Rationing System to reach the poor.
  • 34. Contd…… Revamped Public distribution System (RPDS) was launched on Jan 1 1992 and made effective from June 1, 1992, in selected blocks (1775 blocks). In June, 1997, Targeted Public distribution system (TPDS) was launched. To target the needy people and provide them an assured supply of food grains. In TPDS the main aim was to target the “poor in all areas”. The distribution of food grains operated under two tier system of delivery to households Below poverty line (BPL) Above poverty line (APL)
  • 35. In December 2000, Antyodaya Anna Yojana Annapurna Scheme In August 2001, Sampoorna Grameen Rozgar Yojana (integrated rural employment scheme) - five million tons Mid day meal scheme , wheat based nutrition programmes, scheme for supply of food grains to SC/ST.
  • 36. India’s Food Security System Buffer Stock Food Security system of India Public Distribution System
  • 37. How Public Distribution works: Consumer Farmers or Producers Grains Distributes Grains MSP Allocates Grains FCI (Maintains Buffer Stocks) States Central Issue Price
  • 38. Stock position of food grains in the central pool vis-à-vis minimum buffer norms (Lakh tones) Wheat Rice Total As On Actual stock Minimum Buffer norms Actual stock Minimum Buffer norms Actual stock Minimum Buffer norms 1.4.2010 161.25 70 267.13 142 428.38 212 1.7.2010 335.84 201 242.66 118 578.50 319 1.10.2010 277.77 140 184.44 72 462.21 212 1.1.2011 215.40 112 255.80 138 471.20 250 1.4.2011 153.64 70 288.20 142 441.84 212 1.7.2011 371.79 201 268.57 118 640.36 319 1.10.2011 314.26 140 203.59 72 517.85 212 1.1.2012 256.76 112 297.18 138 553.94 250 1.4.2012 199.52 70 333.50 142 533.02 212 1.7.2012 498.08 201 307.08 118 805.16 319 1.10.2012 431.53 140 233.73 72 665.26 212 1.1.2013 343.83 112 322.21 138 666.04 250 Source: Food, Civil supplies and consumer affairs
  • 39.
  • 40. Quantum of food subsidies released by government of India % of Total Govt Year Amount(crore) 2001-02 17,494.00 3.61 2002-03 24,176.45 4.83 2003-04 25,160.00 5.17 2004-05 25,746.45 6.21 2005-06 23,071.00 7.02 2006-07 23,827.00 7.90 2007-08 31,259.68 8.46 2008-09 43,668.08 9.60 2009-10 58,242.45 10.42 2010-11 62,929.56 13.20 2011-12 72,370.00 14.12 Source: Department of food and public distribution. Expenditure
  • 41. Allocation and off take of rice and wheat for the year 2012-13 under TPDS (in tones) Allotment States Off take BPL AAY APL TOTAL BPL AAY APL TOTAL AP Arunachal Pradesh Assam Bihar Chhattisgarh Delhi Goa Gujarat Haryana HP J&K Jharkhand 175.348 4.254 79.204 281.562 80.948 18.166 0.922 91.728 34.762 22.190 33.616 103.328 109.048 2.664 49.282 175.070 50.324 10.514 1.018 56.680 20.470 13.790 17.898 64.254 352.740 10.010 185.990 160.680 76.080 71.190 8.566 199.110 70.770 52.010 74.620 58.860 637.136 16.926 314.476 617.312 207.352 99.820 10.506 347.518 126.002 87.990 126.134 226.442 219.00 4.336 77.737 301.501 78.519 21.927 0.922 98.389 34.960 20.854 34.894 98.235 138.263 2.631 48.242 204.842 50.324 8.942 1.018 65.084 18.152 13.769 19.055 62.575 245.779 9.367 150.401 33.378 66.516 79.010 9.927 119.022 35.658 52.876 82.199 0.955 603.142 16.604 276.380 539.721 195.359 109.879 11.867 282.495 88.770 87.509 136.148 161.766 Karnataka 139.410 79.635 189.242 408.288 150.498 85.486 196.331 457.315 136.680 167.340 335.790 16.870 18.620 6.930 12.466 83.214 105.240 193.080 4.340 280.076 29.890 463.890 52.470 280.322 4.480 5.400 0.540 0.662 2.560 affairs 4.200 245.448 456.085 793.174 28.492 31.430 11.690 21.146 365.996 137.995 363.250 7.380 620.472 50.540 77.780 170.136 299.549 7.531 8.271 2.790 6.775 194.262 12.568 101.948 2.340 229.266 13.056 455.633 23.119 279.755 0.679 0.313 0.840 0.202 0 4.296 46.998 92.999 181.040 4.524 5.187 1.720 4.524 84.429 6.032 64.014 1.156 150.537 8.559 301.191 12.054 85.637 0.210 0.010 0.355 0.137 0 2.379 155.214 71.309 188.614 19.914 19.661 6.691 15.156 70.652 68.956 196.184 4.409 261.334 31.670 360.256 54.534 266.953 1.772 5.214 0.540 0.654 1.100 3.513 279.992 337.445 Kerala MP Maharashtra Manipur Meghalaya Mizoram Nagaland Orissa Punjab Rajasthan Sikkim TN Tripura UP Uttarakand West Bengal A & N islands Chandigarh D & N haveli Damen and Diu Lakshadweep Source:. Pondicherry Food, 67.058 178.036 284.904 7.168 7.896 2.940 5.352 194.262 20.196 104.922 1.884 209.872 12.730 460.950 21.498 258.930 0.890 0.626 0.838 0.174 0.126 Civil supplies 3.594 41.710 110.710 172.480 4.454 4.914 1.820 3.328 88.520 12.560 65.248 1.159 130.524 7.920 286.580 13.364 103.614 0.300 0.104 0.366 0.106 0.084 and consumer 2.258 1211.420 87.332 642.855 5.670 6.130 1.744 0.942 2.770 10.052 669.203 31.959 33.119 11.201 26.455 349.343 87.556 362.146 7.905 641.137 53.285 1117.080 89.707 632.345 2.661 5.537 1.746 0.993 1.100 10.188
  • 42. Status of PDS in Karnataka In Karnataka there are about 21026 active fair price shops. Exclusion Error Inclusion Error Due to miss classification Due to maladministration Due to mis classification Due to maladministration 4.2 lakh household 1.6 lakh household 52.3 lakh household 6.6 lakh household Karnataka issued 1.6 crore ration card but the present total number of family in the state is only 1.2 crore. that means 40 lakh ghost cards. Karnataka’s PDS system occur an monthly leakage of Rs. 144.8crore. Currently Karnataka food bill is issued under this Anna Bhagya Scheme was introduced spending about Rs 460 crore a year.
  • 43. Magnitude of loss at different levels of PDS in Karnataka. Source: Dr.R.Balasubramaniam, 2012
  • 44. Off take of Rice and wheat during 2012-13 by Karnataka In Tonnes Scheme (A)TPDS AAY BPL APL Sub Total Special/Adhoc Poorest districts Sub Total (A) (B) Welfare Schemes MDM WBNP EFP Hostels/Welfare Institutions Annapurna other Sub total (B) (C) other schemes WEF, RELIEF,DEFENCE etc Open sale/tender sale/export Sub total(C) Grand total (A+B+C) Rice Wheat Total 51.31 86.82 52.95 191.08 14.38 13.06 218.52 25.34 49.82 74.81 150.01 7.76 6.71 164.44 76.65 136.64 127.75 341.08 22.14 19.77 382.95 15.33 1.88 0.13 1.78 0.39 0.19 19.70 3.27 6.31 0.00 0.22 0.10 0.47 10.39 18.60 8.19 0.13 2.00 0.49 0.66 30.09 1.53 0.46 1.99 240.21 0.10 56.42 56.52 231.35 1.63 56.88 58.51 471.56 Source: Karnataka Food, Civil supplies and consumer affairs
  • 45. Leakages from PDS Type of leakage >70 % Bihar and Punjab Very high leakage 25-50% Assam, Gujarat, Himachal Pradesh, Karnataka, Maharashtra and Rajasthan <25 % AP, Kerala, Orissa, TN and west Bengal Very high leakages >50% Bihar, Haryana and Punjab High leakage 25-50% UP & Rajasthan Moderate leakage 10-25 % Bihar, Gujarat, KTK, Maharashtra,Orissa,TN and West Bengal <10% Assam,HP,MP, Orissa,TN & West Bengal. Very high Leakage >30% Assam,HP &MP. High leakage 10-50% Bihar, Gujarat,Ktk,Maharashtra, Orissa, Uttarpradesh and west Bengal Moderate leakage Leakage through ghost card Abnormal leakage Low leakage Leakage at fair price shop States Low leakage Total leakage Percent <10% AP,Haryana,Kerala,Punjab, Rajasthan and TN Source: Food Security in India: Biswajit Chaterjee,2012
  • 46. Diversion of Food grains State (kg/BPL Family/annum) Off take by States Off-take by identified BPL families Food Grains not reaching the poor house hold AP 466.16 197.62 268.51 Assam 490.76 227.32 263.44 Bihar 138.13 12.24 125.89 Gujarat 320.24 169.47 150.77 Haryana 416.16 138.79 277.37 HP 492.22 266.14 226.08 KTK 480.80 139.91 340.89 Kerala 407.58 248.58 159.00 MP 365.57 124.04 241.53 Maharashtra 347.29 227.27 120.02 Orissa 276.37 175.88 100.49 Punjab 364.24 38.25 326.00 Rajasthan 366.53 238.43 128.10 TN 525.95 181.14 344.81 UP 285.16 92.73 192.43 West Bengal 336.78 246.19 90.59 16 states total 380.00 160.25 219.75
  • 47. The Major reasons for leakage are: Inclusion Error Ghost Cards Shadow Ownership Non-accountability of FPS
  • 48. Fallouts of P.D.S. Inferior quality food grains. Deceitful dealers replace good supplies received from the F.C.I(Food Corporation of India) with inferior stock and sell FCI stock in the black market. Illicit fair price shop owners have been found to create large number of bogus cards to sell food grains in the open market. Many FPS dealers resort to malpractice, illegal diversions of commodities, hoarding and black marketing due to the minimal salary received by them. Regional allocation and coverage of FPS are unsatisfactory and the core objective of price stabilization of essential commodities has not met.
  • 49. Aadhaar and PDS: The Primary Focus What is Aadhaar? Demographic features like Name, Address, Gender and Date of birth Unique identification called Aadhaar Biometric features Iris Finger print
  • 50. Aadhaar can be a potent tool for the government in making the PDS effective in these identified area in the following manner: One Aadhaar one beneficiary Aadhaar as sufficient Proof of Identity(POI) and Proof of Address (POA), these individuals can provided with ration cards. Portability in Identification Address the issues of leakages and proxy withdrawals. Flexibility
  • 51. Aadhaar in Karnataka In Karnataka about 103 Biometric Machines are introduced Each machine costs about 46,000 Karnataka in total spending about 97 crore to install biometric machine in all fair price shops Bio-metric machine
  • 53. Case study I Role and Effectiveness of Public Distribution System in providing Food Security in India Ms. Gurdeep kaur Ghumaan and Dr. Pawan Kumar Dhiman June 2013
  • 54. Objective of the study: 1. To study the performance and challenges of food security in India. 2. Role and Effectiveness of Public Distribution System in providing Food security in India. Nature of Data Secondary data were collected from NSSO( National Sample Survey Organisation) . Information on purchases of rice, wheat, sugar, and kerosene from fair price shops were also collected. Study area The study was conducted all over India.
  • 55. Per capita consumption and percentage of households reporting consumption from PDS of rice, wheat/atta, sugar and kerosene in 2004-05 and 2009-10, all-India Sector Item 2009-10 Per capita consumption(kg) % share of PDS in qty. PDS Other consumed 2004-05 Per capita consumption(kg) 3 4 5 6 Rice 1.408 4.594 23.5 0.839 Wheat/atta 0.619 3.625 14.6 Sugar 0.097 0.563 Kerosene 0.511 Rice 1 Other source 7 2 PDS % of hhs reporting % share of consn. From PDS PDS in during 30 days qty. consumed 2009-10 2004-05 8 9 10 5.537 13.2 39.1 24.4 0.307 3.885 7.3 27.6 11.0 14.7 0.062 0.587 9.6 27.6 15.9 0.081 86.3 0.477 0.142 77.1 81.8 72.8 0.814 3.706 18.0 0.530 4.181 11.3 20.5 13.1 Wheat/atta 0.371 3.706 9.1 0.167 4.192 3.8 17.6 5.8 Sugar 0.080 0.700 10.3 0.054 0.763 6.6 18.7 11.5 Kerosene 0.295 0.169 63.6 0.350 0.268 56.6 33.0 32.8 Rural Urban
  • 56. Percentage of households reporting : Wheat, Rice , Sugar and Kerosene consumption from PDS; share of PDS in quantity consumed : major States State Andhra Pradesh Assam Bihar Chhattisgarh Gujarat Haryana Jharkhand Karnataka Kerala Madhya Pradesh Maharashtra Orissa Punjab Rajasthan Tamilnadu Uttar Pradesh West Bengal All India Wheat share of PDS in consumption Rural Urban 5.1 7.5 1.5 1.3 5.1 2.4 39.1 17.9 15.6 5.0 14.2 8.0 20.6 4.0 51.5 13.5 39.7 33.1 21.8 13.2 32.7 8.6 17.0 10.2 14.6 9.0 10.5 6.1 85.8 64.7 6.8 7.6 41.4 11.7 14.6 9.1 Rice share of PDS in consumption Rural 32.9 11.2 5.1 41.2 20.3 0.5 14.0 45.0 27.9 20.1 34.2 24.8 0.1 0.3 52.7 17.6 6.3 23.5 Urban 21.5 5.1 2.2 25.7 5.8 0.4 7.4 17.7 24.0 8.3 7.5 13.3 0.1 0.2 40.9 7.8 2.9 18.0 Sugar share of PDS in consumption Rural 24.5 53.2 0.9 28.6 14.5 2.1 4.6 18.9 11.2 14.1 9.8 16.0 0.0 0.9 73.2 7.0 11.2 14.7 Urban 12.3 31.0 1.7 11.0 3.3 1.9 1.7 5.4 8.5 6.0 4.6 8.9 0.3 0.7 62.6 2.1 4.3 10.3 Kerosene share of PDS in consumption Rural 91.46 72.46 83.99 89.34 93.47 92.89 67.32 85.36 95.59 90.95 86.43 83.53 82.13 93.51 91.49 85.99 80.01 86.24 Urban 67.14 54.55 70.16 82.38 56.52 53.64 36.68 50.84 90.37 79.33 47.64 52.52 23.50 79.80 72.05 82.69 73.22 63.58
  • 58.