Download to read offline
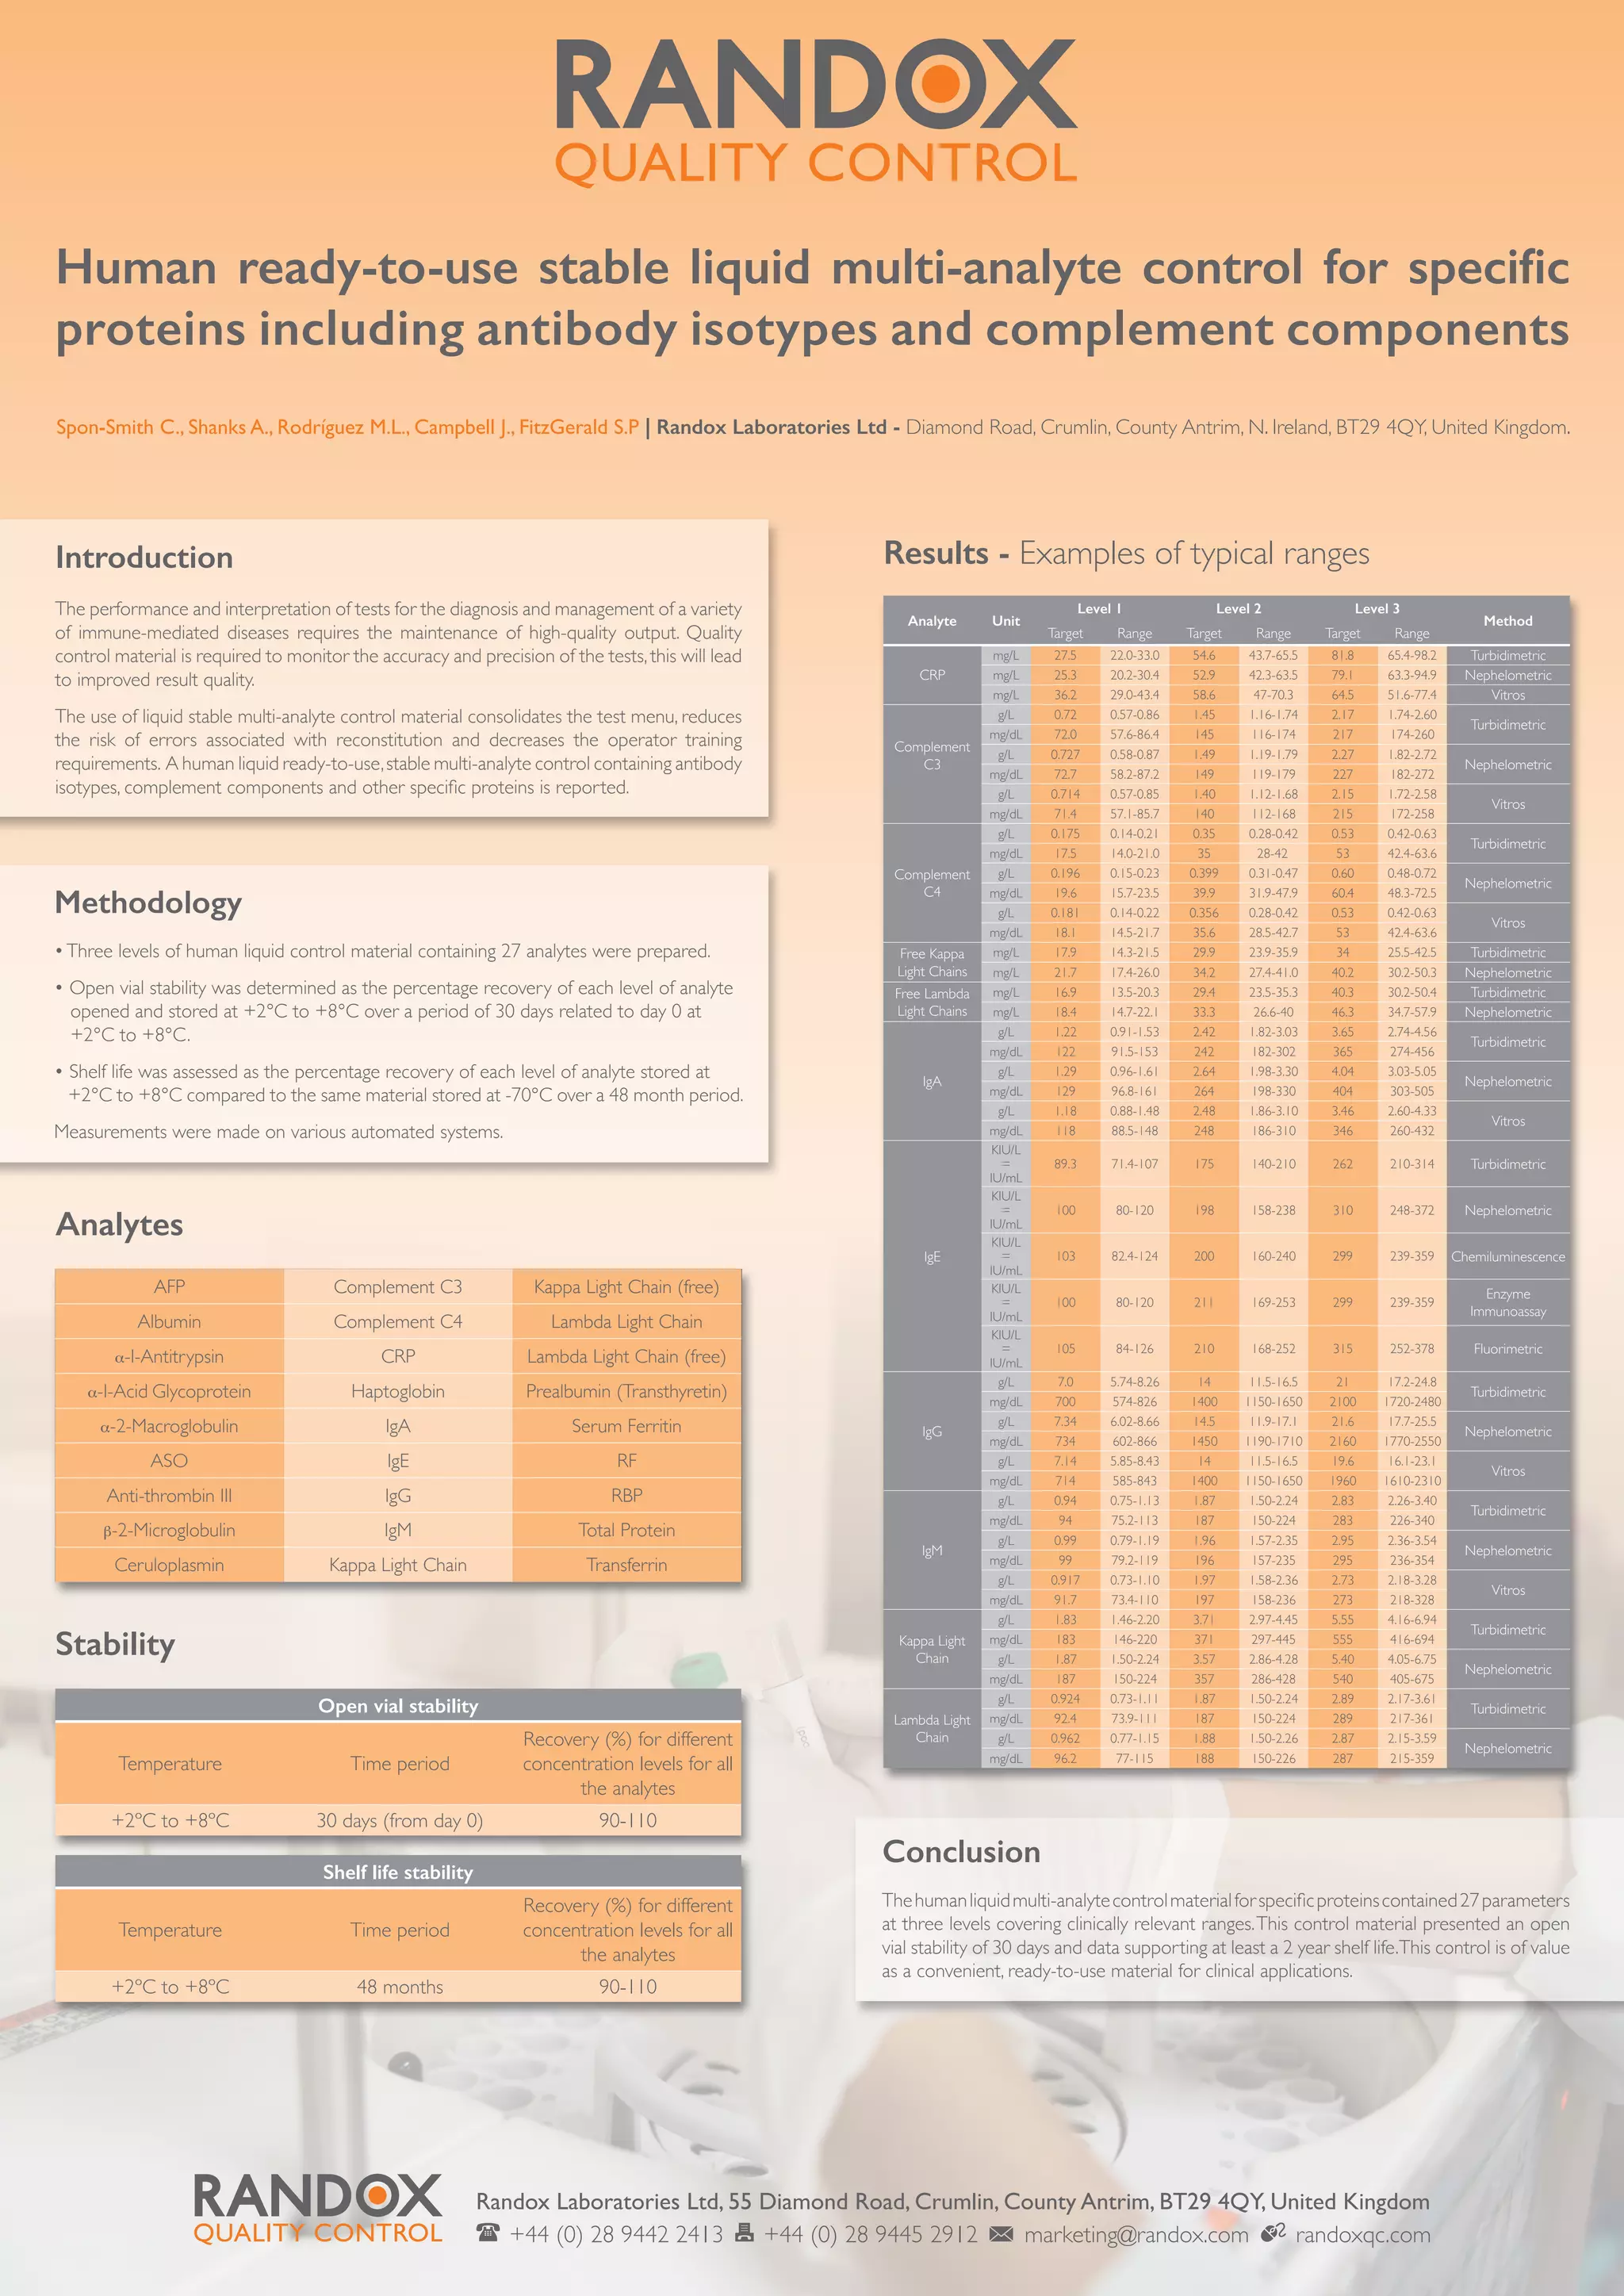

This document describes a human liquid ready-to-use stable multi-analyte control containing 27 different analytes including antibody isotypes, complement components, and other specific proteins. It reports that the control material has an open vial stability of 30 days when stored between 2-8 degrees Celsius and a shelf life stability of at least 2 years under the same storage conditions based on measurements on various automated systems. The control is concluded to be a convenient ready-to-use material for clinical applications that standardizes the test menu and reduces errors.


