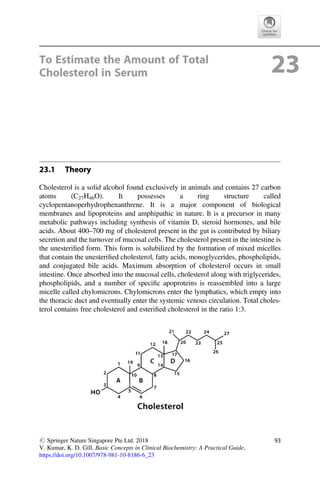
Vijay Kumar •Kiran Dip Gill
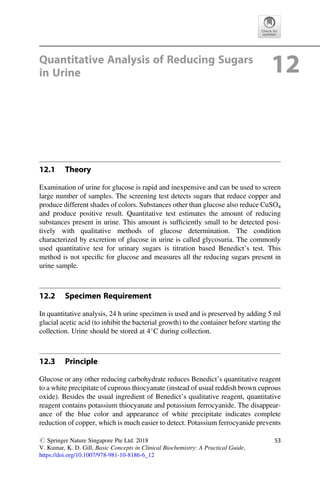
Basic Concepts in Clinical
Biochemistry:
A Practical Guide
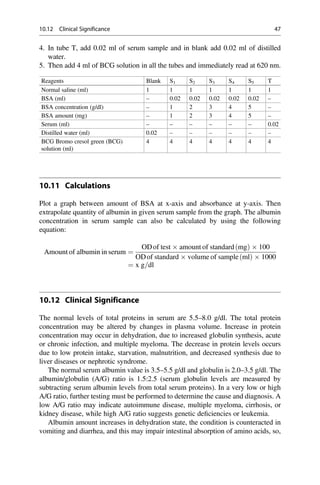
4.
Vijay Kumar
Department ofBiochemistry
Maharshi Dayanand University
Rohtak, Haryana, India
Kiran Dip Gill
Department of Biochemistry
Postgraduate Institute of Medical Education
& Research
Chandigarh, India
ISBN 978-981-10-8185-9 ISBN 978-981-10-8186-6 (eBook)
https://doi.org/10.1007/978-981-10-8186-6
Library of Congress Control Number: 2018935904
# Springer Nature Singapore Pte Ltd. 2018
This work is subject to copyright. All rights are reserved by the Publisher, whether the whole or part
of the material is concerned, specifically the rights of translation, reprinting, reuse of illustrations,
recitation, broadcasting, reproduction on microfilms or in any other physical way, and transmission or
information storage and retrieval, electronic adaptation, computer software, or by similar or dissimilar
methodology now known or hereafter developed.
The use of general descriptive names, registered names, trademarks, service marks, etc. in this
publication does not imply, even in the absence of a specific statement, that such names are exempt
from the relevant protective laws and regulations and therefore free for general use.
The publisher, the authors and the editors are safe to assume that the advice and information in this book
are believed to be true and accurate at the date of publication. Neither the publisher nor the authors or the
editors give a warranty, express or implied, with respect to the material contained herein or for any errors
or omissions that may have been made. The publisher remains neutral with regard to jurisdictional claims
in published maps and institutional affiliations.
Printed on acid-free paper
This Springer imprint is published by the registered company Springer Nature Singapore Pte Ltd.
The registered company address is: 152 Beach Road, #21-01/04 Gateway East, Singapore 189721,
Singapore
5.
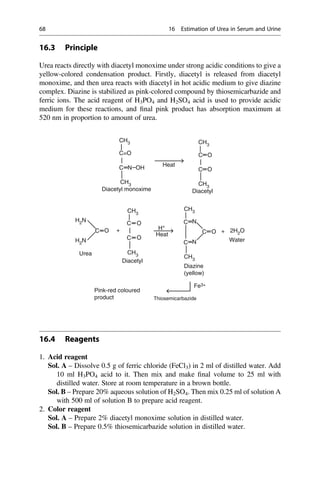
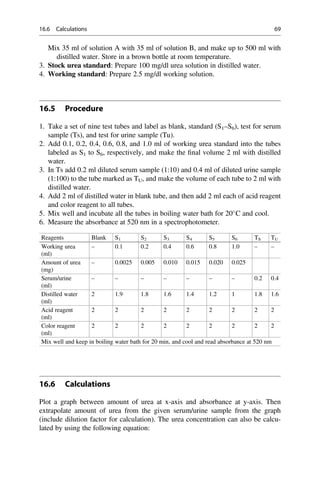
Preface
Biochemistry is oneof the fundamental subjects of life science, and knowledge of its
practical aspects is absolutely essential for students and researchers. Performing a
practical in biochemistry requires adequate facilities and training laboratories for
organizing meaningful practicals both at undergraduate and postgraduate levels.
Clinical biochemistry is a diagnostics subject, which aims to use standard methods,
to monitor disease development and treatment by biochemical methods. Laboratory
investigations pertaining to clinical biochemistry provide useful information to
clinicians, both in the diagnosis of illness and the monitoring of treatment. The
necessity for a practical manual on orientation toward various aspects of clinical
biochemistry is always desired. The present manual is written in simple language
covering various experimental aspects related with clinical biochemistry such as
urinary analysis of bioorganic constituents and estimation of proteins, urea, sugar,
uric acid, bilirubin, etc., in blood which is essential for early diagnosis of a disease
and also assessment of its therapy efficacy.
The book is specifically helpful to BSc, MLT, MSc, and MSc biochemistry
students. Each chapter begins with theoretical aspects of the practical, and the
experiments are further well supported by self-explanatory tables and simple
calculations that will make the students understand protocols very easily. The
manual is also helpful to teachers who are taking clinical biochemistry practicals
to guide students in a simple way.
The authors hope that the manual will meet the requirement of undergraduate and
postgraduate students studying biochemistry and will be glad to accept constructive
criticisms and suggestions from the faculty, students, and readers to make this
manual a better one in the future.
Rohtak, Haryana, India Vijay Kumar
Chandigarh, India Kiran Dip Gill
v
About the Authors
K.D. Gill did her postgraduate in Biochemistry from Punjab Agricultural Univer-
sity, Ludhiana, Punjab, India, in 1969. She completed her doctorate degree from the
same university in 1974 and then joined as lecturer in the Department of Chemistry,
Punjabi University, Patiala, in 1976. Then she joined as postdoctoral fellow, at
Physiological Chemistry Department, Faculty of Medicine, Gottingen,
W. Germany, in 1977. In 1981, she was appointed as lecturer in Biochemistry at
the Department of Biochemistry Postgraduate Institute of Medical Education and
Research, Chandigarh, India, where she served in various capacities such as assistant
professor (1986–1987), associate professor (1987–1991), additional professor
(1991–2001), and professor (2001–2012). She became head of Biochemistry
Department in 2012 and retired in that capacity. She has 32 years of teaching
Biochemistry subject at postgraduate level. She has published more than
125 research papers in journals of international repute. She is fellow of the Society
of Applied Biotechnology and has served as editorial board member and associate
editor for many journals. She has four book chapters to her credit. She has
also supervised clinical Biochemistry labs.
Vijay Kumar did his postgraduate in biochemistry from Maharshi Dayanand Uni-
versity, Haryana, India, in 2002. He then joined the Department of Biochemistry at
Postgraduate Institute of Medical Education and Research, Chandigarh, to pursue his
PhD and obtained his PhD degree in 2009. After getting his degree, he served there
as demonstrator and worked in clinical biochemistry experimentation and also taught
biochemistry to MD students. In 2010, he joined as assistant professor at the
Department of Biochemistry, Maharshi Dayanand University, Haryana. He is
actively engaged in teaching Biochemistry to postgraduate and PhD students.
xix
17.
Abbreviations
α Alpha
& And
ACPAcid phosphatase
ADP Adenosine diphosphate
ALP Alkaline phosphatase
ALT Alanine amino transferase
ANSA 1,2,4-Amino naphthol sulfonic acid
AST Aspartate amino transferase
ATP Adenosine triphosphate
BaCl2 Barium chloride
β Beta
BCG Bromocresol green
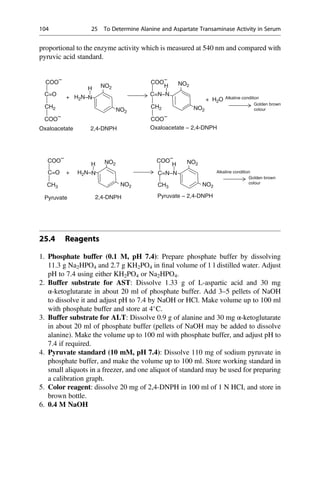
BSA Bovine serum albumin
CK Creatine kinase
Conc Concentrated
CSF Cerebrospinal fluid
CuSO4 Copper sulfate
DNPH 2,4-Dinitrophenylhydrazine
EDTA Ethylenediaminetetraacetic acid
ELISA Enzyme-linked immunosorbent assay
FeCl3 Ferric chloride
γ Gamma
g Gram
GFR Glomerular filtration rate
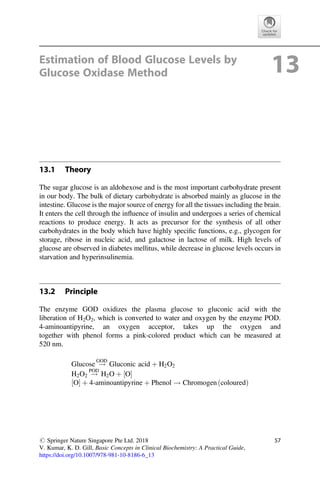
GOD Glucose oxidase
GTT Glucose tolerance test
H2O2 Hydrogen peroxide
H2SO4 Sulfuric acid
H3PO4 Phosphoric acid
HCl Hydrochloric acid
HDL High-density lipoprotein
HNO3 Nitric acid
H3PO4 Phosphoric acid
xxi
18.
h Hour(s)
KCl Potassiumchloride
kDa Kilodalton
L Liter
LDH Lactate dehydrogenase
LDL Low-density lipoprotein
M Molar
mg Milligram (s)
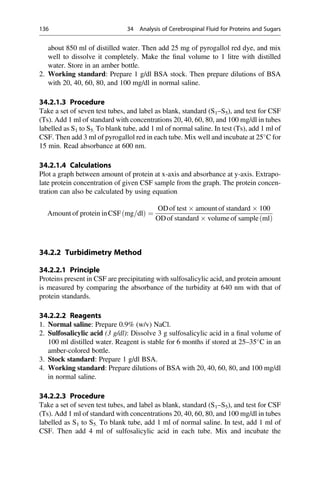
min Minute (s)
mM Millimolar
mol Mole(s)
m mol Millimoles
Na2CO3 Sodium carbonate
Na2HPO4 Disodium hydrogen phosphate
NaCl Sodium chloride
NAD Nicotinamide adenine dinucleotide
NADP Nicotinamide adenine dinucleotide phosphate
NaH2PO4 Sodium dihydrogen phosphate
NaHCO3 Sodium bicarbonate
NaOH Sodium hydroxide
nm Nanometer
OD Optical density
% Percent
pI Isoelectric point
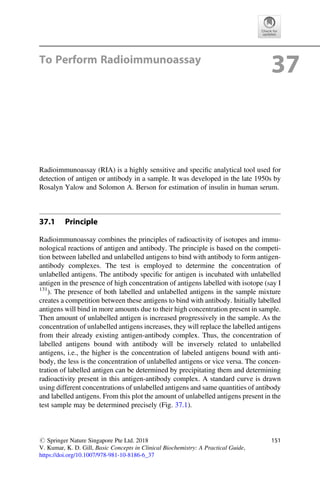
POD Peroxidase
RBCs Red blood cells
RNA Ribonucleic acid
RIA Radioimmunoassay
Sec Second(s)
TCA Trichloroacetic acid
Tris Tris(hydroxymethyl)aminomethane
UV Ultraviolet
VLDL Very-low-density lipoprotein
μM Micromolar
μg Microgram(s)
< Less than
> Greater than
xxii Abbreviations
19.
Common Clinical LaboratoryHazards
and Waste Disposal 1
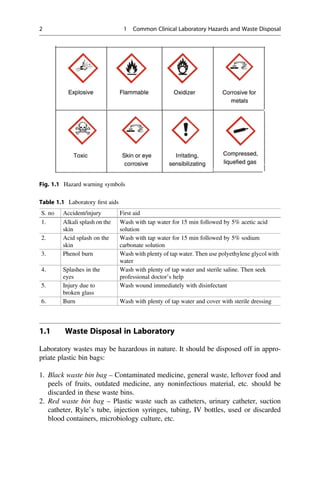
It is very important to protect laboratory worker from hazards. The laboratory
hazards fall into three main categories: chemical hazards, biological hazards, and
physical hazards. The major chemical hazards in laboratories are the cleaning agents,
anesthetic gases, disinfectants, drugs, and solvents. The persons working in labora-
tory are exposed to chemical hazards during their usage or due to improper storage.
Biological hazards involve exposures to infectious samples, animal diseases trans-
missible to humans, and biological agents used during experimental procedures that
include viral vectors, etc. The exposure to physical hazards is associated with
research facilities. The laboratory personnel encounter the physical hazards due to
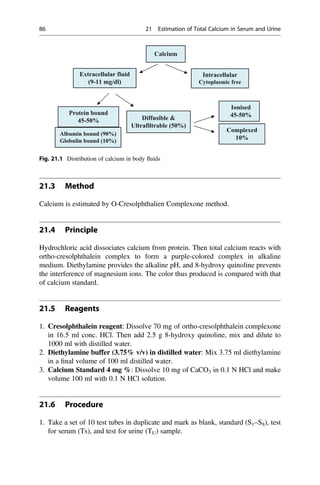
accidental spill of corrosive reagent, broken glassware, etc. (Fig. 1.1).
The major precautions that can be followed while working in laboratory are:
1. Proper labelling of chemicals.
2. The worker should avoid mouth pipetting and should take care not to blow out
pipettes containing potentially infectious material like serum.
3. The gloves, mask, protective eyewear, and gowns must be used while drawing
blood from a patient.
4. Proper installation of fire extinguishers, grounding of electrical wires, etc.
5. The reuse of the syringes should be avoided, and needles should be disposed off
in the containers without touching.
6. Completely incinerate infectious tissues.
7. The discarded tube or infected material should not be kept unattended or
unlabelled.
8. All sharp objects and infectious samples should be disposed off properly.
9. Immediately use laboratory first aid in case of accidental exposure to any hazard
(see Table 1.1).
10. The laboratory workers must be trained for proper handling and disposal of
biohazardous materials including the patient specimens. (Note the hazard warn-
ing symbol on reagents.)
# Springer Nature Singapore Pte Ltd. 2018
V. Kumar, K. D. Gill, Basic Concepts in Clinical Biochemistry: A Practical Guide,
https://doi.org/10.1007/978-981-10-8186-6_1
1
20.
1.1 Waste Disposalin Laboratory
Laboratory wastes may be hazardous in nature. It should be disposed off in appro-
priate plastic bin bags:
1. Black waste bin bag – Contaminated medicine, general waste, leftover food and
peels of fruits, outdated medicine, any noninfectious material, etc. should be
discarded in these waste bins.
2. Red waste bin bag – Plastic waste such as catheters, urinary catheter, suction
catheter, Ryle’s tube, injection syringes, tubing, IV bottles, used or discarded
blood containers, microbiology culture, etc.
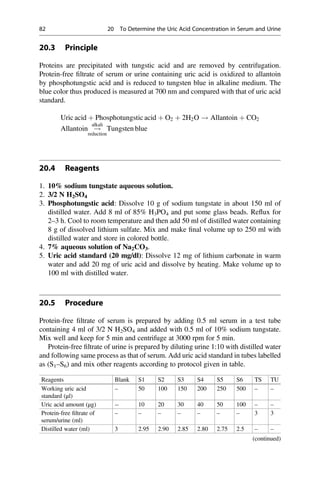
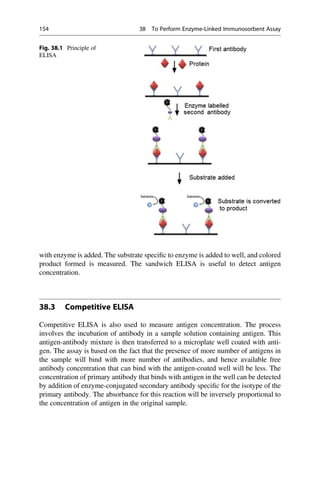
Fig. 1.1 Hazard warning symbols
Table 1.1 Laboratory first aids
S. no Accident/injury First aid
1. Alkali splash on the
skin
Wash with tap water for 15 min followed by 5% acetic acid
solution
2. Acid splash on the
skin
Wash with tap water for 15 min followed by 5% sodium
carbonate solution
3. Phenol burn Wash with plenty of tap water. Then use polyethylene glycol with
water
4. Splashes in the
eyes
Wash with plenty of tap water and sterile saline. Then seek
professional doctor’s help
5. Injury due to
broken glass
Wash wound immediately with disinfectant
6. Burn Wash with plenty of tap water and cover with sterile dressing
2 1 Common Clinical Laboratory Hazards and Waste Disposal
21.
3. Blue wastebin bag – All broken glass bottles and articles, surgical blades, glass
syringes, needles, and any sharp material.
4. Yellow waste bin bag – Empty vials, ampoules, gloves, infectious waste, human
anatomical wastes, organs, body parts, dressing, bandages, gauze, items
contaminated with blood/body fluids, microbiological and biotechnical
wastes, etc.
1.1 Waste Disposal in Laboratory 3
22.
Blood Collection andPreservation
2
2.1 Blood Collection
Blood is a body fluid containing plasma, red blood cells (RBCs), white blood cells,
and platelets. Blood is specialized for performing various functions such as transport
of nutrients and oxygen to various body organs, transportation of antibodies, trans-
port of waste products to kidneys, and regulation of body temperature. Normally,
blood pH is maintained in narrow range of 7.35–7.45. Blood for biochemical
investigations may be drawn from arteries, veins, or capillaries. Venous blood is
commonly used for majority of biochemical investigations. It can be drawn from any
prominent vein. Arterial blood is mostly used for blood gas analysis. Radial,
brachial, or femoral arteries are the most common site for arterial blood. Capillary
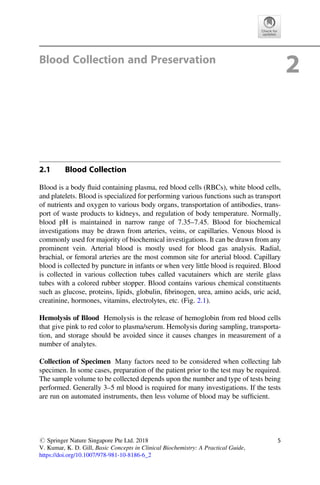
blood is collected by puncture in infants or when very little blood is required. Blood
is collected in various collection tubes called vacutainers which are sterile glass
tubes with a colored rubber stopper. Blood contains various chemical constituents
such as glucose, proteins, lipids, globulin, fibrinogen, urea, amino acids, uric acid,
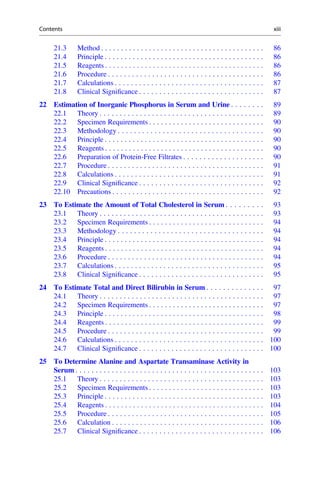
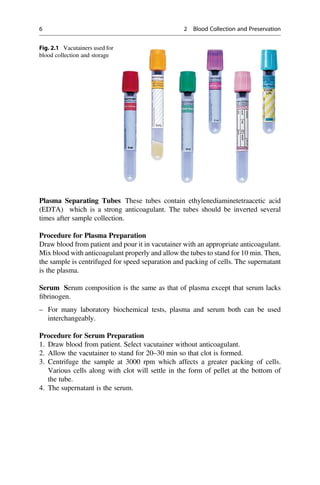
creatinine, hormones, vitamins, electrolytes, etc. (Fig. 2.1).
Hemolysis of Blood Hemolysis is the release of hemoglobin from red blood cells
that give pink to red color to plasma/serum. Hemolysis during sampling, transporta-
tion, and storage should be avoided since it causes changes in measurement of a
number of analytes.
Collection of Specimen Many factors need to be considered when collecting lab
specimen. In some cases, preparation of the patient prior to the test may be required.
The sample volume to be collected depends upon the number and type of tests being
performed. Generally 3–5 ml blood is required for many investigations. If the tests
are run on automated instruments, then less volume of blood may be sufficient.
# Springer Nature Singapore Pte Ltd. 2018
V. Kumar, K. D. Gill, Basic Concepts in Clinical Biochemistry: A Practical Guide,
https://doi.org/10.1007/978-981-10-8186-6_2
5
23.
Plasma Separating TubesThese tubes contain ethylenediaminetetraacetic acid
(EDTA) which is a strong anticoagulant. The tubes should be inverted several
times after sample collection.
Procedure for Plasma Preparation
Draw blood from patient and pour it in vacutainer with an appropriate anticoagulant.
Mix blood with anticoagulant properly and allow the tubes to stand for 10 min. Then,
the sample is centrifuged for speed separation and packing of cells. The supernatant
is the plasma.
Serum Serum composition is the same as that of plasma except that serum lacks
fibrinogen.
– For many laboratory biochemical tests, plasma and serum both can be used
interchangeably.
Procedure for Serum Preparation
1. Draw blood from patient. Select vacutainer without anticoagulant.
2. Allow the vacutainer to stand for 20–30 min so that clot is formed.
3. Centrifuge the sample at 3000 rpm which affects a greater packing of cells.
Various cells along with clot will settle in the form of pellet at the bottom of
the tube.
4. The supernatant is the serum.
Fig. 2.1 Vacutainers used for
blood collection and storage
6 2 Blood Collection and Preservation
24.
Anticoagulants
Whole blood orplasma sample investigations need use of anticoagulants while
collecting sample. Some common anticoagulants are:
(a) Ethylenediaminetetraacetic acid: This anticoagulant is used at a concentra-
tion of 2 mg/dl of blood volume. It removes calcium ions by chelation and
block coagulation. It is used mainly for hematological studies.
(b) Heparin: Heparin inhibits conversion of prothrombin to thrombin. Heparin
is present naturally in blood and hence acts as ideal anticoagulant. It
increases the activity of antithrombin. For every ml of blood sample,
0.2 ml of heparin may be used.
(c) Sodium fluoride: This anticoagulant is considered when glucose estimations
are carried out in blood samples. Sodium fluoride inhibits glycolysis by
inhibiting activity of enolase enzyme and hence preserves blood glucose
levels. It is generally combined with potassium oxalate because of its poor
anticoagulant action.
(d) Sodium or potassium oxalate: Sodium, potassium, and even lithium
oxalates precipitate calcium ions and inhibit blood coagulation. Potassium
oxalate is more water soluble and is used at concentration of 5–10 mg/5 ml
of blood.
2.1 Blood Collection 7
25.
Quality Control inLaboratory
3
The ultimate goal of the clinical biochemistry laboratory is to analyze the substances
in body fluids or tissues both qualitatively and quantitatively for diagnosis and
treatment of disease. The presentation of incorrect laboratory results may lead to
wrong diagnosis and treatment leading to fatal results. Hence, it is very important to
generate the reliable data that depends on strict quality control management.
Quality control is the procedures of corrective responses employed for the
detection and measurement of the sources of variation or errors. In simple words,
we can present that quality control is a representation of precision and accuracy
under varying experimental conditions. The various criteria included for reliable
analytical methods are:
Accuracy It is the degree of agreement between large numbers of measurements on
a sample with the actual quantity of a substance present in the sample. Accuracy
depends upon the methodology used for sample measurement.
Precision Precision refers to the reproducibility between repeated determinations of
an analyte. The precision depends on accuracy of the methods used for sample
analysis.
Specificity It is the ability of an analytical method to discriminate between similar
substances being analyzed.
Sensitivity Sensitivity is the capacity of an analytical method to measure the
minimum quantities of analytes under consideration.
To maintain the criteria for reliability in analysis, calibration is done regularly.
Calibration is performed by using the various standards. A standard is the solution
with known amount of analytes and with which the sample can be compared to
derive the result.
# Springer Nature Singapore Pte Ltd. 2018
V. Kumar, K. D. Gill, Basic Concepts in Clinical Biochemistry: A Practical Guide,
https://doi.org/10.1007/978-981-10-8186-6_3
9
26.
While performing analyticalmeasurements in laboratory, various types of errors
may be encountered.
3.1 Types of Laboratory Errors
There are three major errors that may occur in a laboratory:
1. Random errors: Random errors are the errors that arise due to statistical
fluctuations in the observations and lead to inconsistent measurement value of a
constant attribute. A random error is associated with the fact that when a
measurement is repeated, it will generally provide a measured value that is
different from the previous value. Random errors are caused by uncontrollable
variables, which cannot be defined or eliminated. These are errors that may arise
due to bubbles in reagents or reagent lines, instrument instability, temperature
variations, and operator variability, such as variation in pipetting.
2. Systemic errors: Systematic errors cause inaccurate results that are consistently
low or high. This error is reproducible and predictable and can be easily identified
and corrected. These errors are caused by insufficient control on analytical
variables, e.g., impure calibration material, change in reagent lot, change in
calibration, assigning the wrong calibrator values, improperly prepared or
deteriorating reagents, etc. Majorly, systemic errors arise due to three factors:
(a) Instrument errors: Instrument errors are errors associated with instru-
ment functioning. These arise due to power fluctuations, defect in any
parts of the instrument, temperature variation, or when the instrument is
not calibrated. The instrumental errors can be removed by proper cali-
bration or maintenance of instrument.
(b) Method errors: These are errors that arise due to the use of non-ideal
physical or chemical methods. For example, the speed of reaction,
problem associated with sampling, and interference from side reactions
can lead to such errors. The development and use of proper method can
help to correct these errors.
(c) Personal errors: These are caused by an observer’s personal habits or
mental judgment, wrong judgment of dimensional values, color acuity
problems, etc. It may be accidental or systematic. Proper training and
experience can help to eliminate the personal errors effectively.
3. Gross errors or total analytical error: Such errors arise due to equipment failure
or observer’s carelessness.
The laboratory errors may also be grouped into pre-analytical, analytical, or post-
analytical errors according to time of occurrence. Pre-analytical errors arise before
the analysis of sample takes place. Common examples of pre-analytical errors are
mismatch of sample and laboratory data, error in presentation of analyzed results,
and delaying in report generation. The analytical errors occur during analytical
methods and include errors related to expired or spoiled reagents, use of controls or
10 3 Quality Control in Laboratory
27.
calibrators that haveexpired, sampling errors, and changes in analyzer’s measuring
unit. Post-analytical errors arise during transmission of data from analyzers, result
validation, and dispatching/communicating results to physicians or patients. Com-
mon post-analytical errors are loss of the results, inappropriate specimen or antico-
agulant, error in storage of sample, or mistakes in patients’ identification.
3.2 Methods to Minimize the Laboratory Errors
The routinely used methods being performed in a laboratory should be monitored
continuously for any change in precision or accuracy. The quality control techniques
must be used regularly to detect such changes and to follow corrective measures. It is
always desirable that both random and systematic errors must be detected at the
earliest possible stage and preventive measures should be applied to minimize them.
The procedure adopted for the detection of errors consists of specific quality
control methods. Such methods can be divided in two categories:
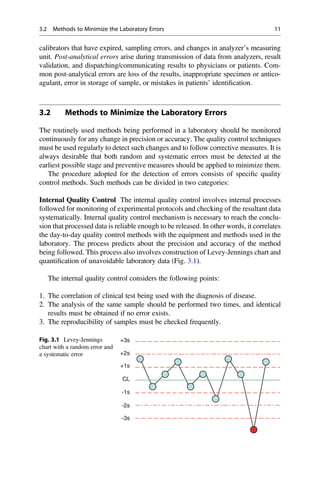
Internal Quality Control The internal quality control involves internal processes
followed for monitoring of experimental protocols and checking of the resultant data
systematically. Internal quality control mechanism is necessary to reach the conclu-
sion that processed data is reliable enough to be released. In other words, it correlates
the day-to-day quality control methods with the equipment and methods used in the
laboratory. The process predicts about the precision and accuracy of the method
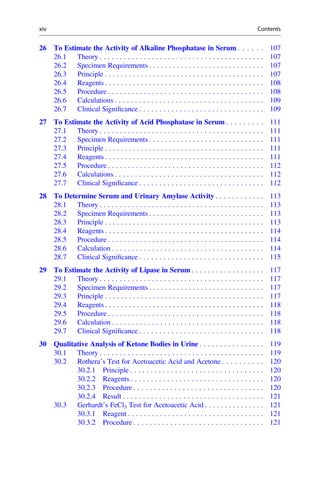
being followed. This process also involves construction of Levey-Jennings chart and
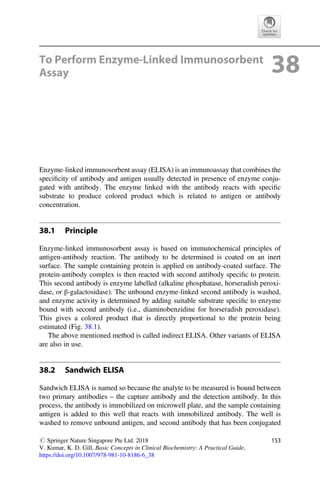
quantification of unavoidable laboratory data (Fig. 3.1).
The internal quality control considers the following points:
1. The correlation of clinical test being used with the diagnosis of disease.
2. The analysis of the same sample should be performed two times, and identical
results must be obtained if no error exists.
3. The reproducibility of samples must be checked frequently.
+3s
+2s
+1s
-1s
-2s
-3s
CL
Fig. 3.1 Levey-Jennings
chart with a random error and
a systematic error
3.2 Methods to Minimize the Laboratory Errors 11
28.
4. If atest is conducted on patient the second time, then the results obtained from
such test may be compared with the previous results. The values may be increased
with progression of disease or vice versa.
External Quality Control The external quality control involves monitoring the
resultant outcome of clinical tests by using controls or reference samples provided
from other sources. Such analysis is done without reference values for analyte under
the conditions of that lab. The quality control methods are performed at regular
intervals by the laboratory personnel by using the controls/standards of an external
referral laboratory, without having any idea of resultant value. It is helpful to check
primarily the accuracy of analytical methods of any laboratory. If the results for any
methods which are followed in a laboratory show deviation from other established
methods, then the methods should be replaced immediately by another after
revaluation of other parameters such as the use of calibration standards, reagents,
pipettes, and instruments used for measurements.
12 3 Quality Control in Laboratory
29.
Automation in ClinicalLaboratory
4
Automation is the use of various control systems for operating equipments and other
applications with minimum human intervention. The use of automation in clinical
laboratory enables to perform many tests by analytical instruments with minute use
of an analyst. The automated instruments have advantages that laboratories can
process more workload with minimum involvement of manpower. Also, automation
minimizes the chances of variability of results and errors that generally can occur
during manual analysis. Although reproducibility has improved due to the use of
automation in recent years, this may not necessarily be associated with more
accuracy of test results. In fact the accuracy is influenced by the analytical methods
used. The automated analyzers are the mechanized versions of basic manual labora-
tory techniques, and recently, many analytical methods with modification of existing
protocols have been developed which are fast and easy to operate. The use of
analyzers with integrated computer hardware and software has made the job very
easy for clinical laboratories as it provides automatic process control and data
processing. In simple words, the credit for significant improvement in the quality
of laboratory tests in progressive years may be attributed to well-designed automated
instrumentation, improved analytical methods, and effective quality assurance
programs. The use of automated analyzer has many advantages including reduction
of workload, less time consumption per sample analysis, more number of tests done
in less time, use of minute amount of sample, decreased chances of human errors,
and high accuracy and reproducibility.
4.1 Types of Autoanalyzers
There are various variants of autoanalyzers.
Semi-autoanalyzer In semi-autoanalyzer, pipetting of samples, reagent mixing and
incubation, etc. are done manually. The ready sample is kept in autoanalyzer to read
# Springer Nature Singapore Pte Ltd. 2018
V. Kumar, K. D. Gill, Basic Concepts in Clinical Biochemistry: A Practical Guide,
https://doi.org/10.1007/978-981-10-8186-6_4
13
30.
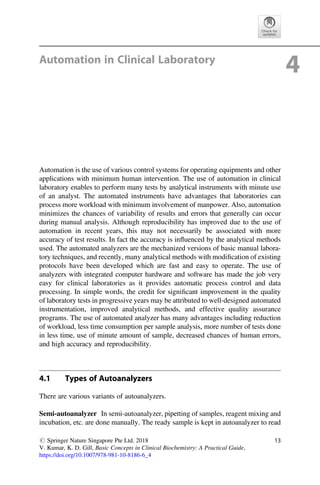
sample. These areusually meant to measure one analyte at a time, but many samples
may be measured rapidly.
Batch Analyzer In batch analyzer, one batch of a specific test is performed at a time
automatically by the analyzer. In these instruments, reagent mixture is prepared and
fed automatically, and one reagent is stored in the machine for running a test.
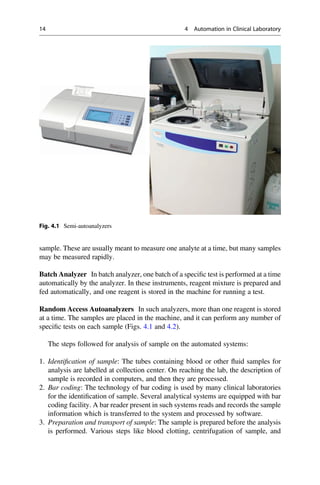
Random Access Autoanalyzers In such analyzers, more than one reagent is stored
at a time. The samples are placed in the machine, and it can perform any number of
specific tests on each sample (Figs. 4.1 and 4.2).
The steps followed for analysis of sample on the automated systems:
1. Identification of sample: The tubes containing blood or other fluid samples for
analysis are labelled at collection center. On reaching the lab, the description of
sample is recorded in computers, and then they are processed.
2. Bar coding: The technology of bar coding is used by many clinical laboratories
for the identification of sample. Several analytical systems are equipped with bar
coding facility. A bar reader present in such systems reads and records the sample
information which is transferred to the system and processed by software.
3. Preparation and transport of sample: The sample is prepared before the analysis
is performed. Various steps like blood clotting, centrifugation of sample, and
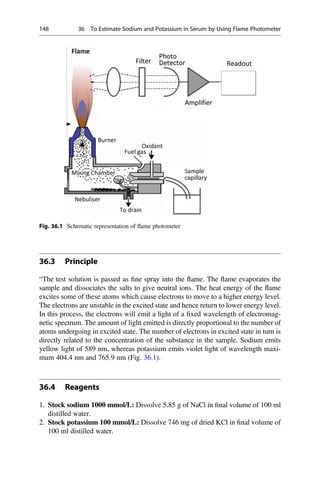
Fig. 4.1 Semi-autoanalyzers
14 4 Automation in Clinical Laboratory
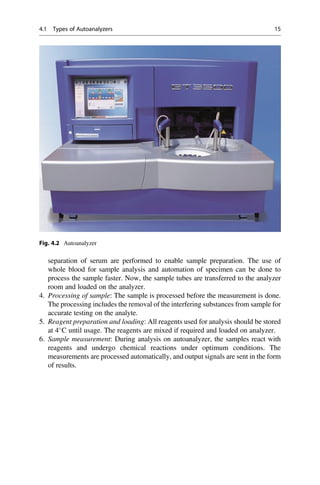
31.
separation of serumare performed to enable sample preparation. The use of
whole blood for sample analysis and automation of specimen can be done to
process the sample faster. Now, the sample tubes are transferred to the analyzer
room and loaded on the analyzer.
4. Processing of sample: The sample is processed before the measurement is done.
The processing includes the removal of the interfering substances from sample for
accurate testing on the analyte.
5. Reagent preparation and loading: All reagents used for analysis should be stored
at 4
C until usage. The reagents are mixed if required and loaded on analyzer.
6. Sample measurement: During analysis on autoanalyzer, the samples react with
reagents and undergo chemical reactions under optimum conditions. The
measurements are processed automatically, and output signals are sent in the form
of results.
Fig. 4.2 Autoanalyzer
4.1 Types of Autoanalyzers 15
32.
Photometry: Colorimeter
and Spectrophotometer5
Photometry deals with the study of phenomenon of light absorption by molecules in
solution. The specificity of a compound to absorb light at a particular wavelength is
useful in quantitative measurements. When a light beam of particular wavelength is
passed through a solution, some amount of light is absorbed by the solution, and
consequently the intensity of light that comes out of solution is diminished. The
phenomenon of absorption of light by a solution follows Beer-Lambert’s law. Beer’s
law states that amount of transmitted light decreases exponentially with increase in
the concentration of absorbing medium. In other words, absorbance is directly
related to the concentration of the absorbing medium. Lambert’s law states that
amount of transmitted light decreases exponentially with increase in thickness of
absorbing medium. The two laws can be combined, hence
I ¼ I0
εcl
where
I ¼ Intensity of transmitted light
I0 ¼ Intensity of incident light
ε ¼ Molar absorption coefficient
c ¼ Concentration of absorbing substance (g/dl)
l ¼ Thickness of absorbing medium or solution
When thickness of absorbing medium is kept constant, then intensity of incident
light depends only upon the concentration of absorbing medium, or we can say that
Beer’s law is operative. The ratio of transmitted light to incident light is called
transmittance, whereas absorbance or optical density can be calculated as
# Springer Nature Singapore Pte Ltd. 2018
V. Kumar, K. D. Gill, Basic Concepts in Clinical Biochemistry: A Practical Guide,
https://doi.org/10.1007/978-981-10-8186-6_5
17
33.
Absorbance ¼ 2 log10 T
¼ 2 log% T
5.1 Colorimeter and Spectrophotometer
Colorimeter and spectrophotometer work on principle of light absorption which is
integral part of a large number of instruments including semi-autoanalyzers and
autoanalyzer. Colorimeter is an instrument used to measure the concentration of
colored substances. It works in visible range of 400–800 nm of electromagnetic
spectrum of light. The working of colorimeter is based on Beer-Lambert law and is
based on the fact that any metabolite or chemical substance that undergoes a reaction
to form a colored product in the cuvette will absorb some amount of light. The
amount of the light absorbance will be proportional to the concentration of the
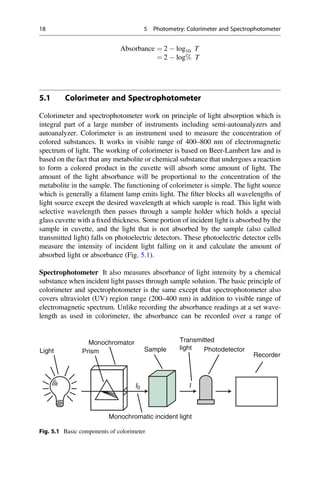
metabolite in the sample. The functioning of colorimeter is simple. The light source
which is generally a filament lamp emits light. The filter blocks all wavelengths of
light source except the desired wavelength at which sample is read. This light with
selective wavelength then passes through a sample holder which holds a special
glass cuvette with a fixed thickness. Some portion of incident light is absorbed by the
sample in cuvette, and the light that is not absorbed by the sample (also called
transmitted light) falls on photoelectric detectors. These photoelectric detector cells
measure the intensity of incident light falling on it and calculate the amount of
absorbed light or absorbance (Fig. 5.1).
Spectrophotometer It also measures absorbance of light intensity by a chemical
substance when incident light passes through sample solution. The basic principle of
colorimeter and spectrophotometer is the same except that spectrophotometer also
covers ultraviolet (UV) region range (200–400 nm) in addition to visible range of
electromagnetic spectrum. Unlike recording the absorbance readings at a set wave-
length as used in colorimeter, the absorbance can be recorded over a range of
Light Prism
Monochromator
Monochromatic incident light
I
I0
Sample Photodetector
Recorder
Transmitted
light
Fig. 5.1 Basic components of colorimeter
18 5 Photometry: Colorimeter and Spectrophotometer
34.
wavelengths in spectrophotometereven at every 5 or 10 nm ranges. It gives a data
spectrum instead of giving a specific absorbance reading.
The spectrophotometers are of two types – single beam and double beam. In
single beam spectrophotometers, there is single beam from light source. The refer-
ence sample also called blank sample is first kept in sample holder, and wavelength
absorption is measured. Then it is removed, and sample under consideration is
placed in sample holder, and absorption of light is measured again. The absorbance
value of reference sample is subtracted from the absorbance value of samples under
consideration. This process removes the additive effects from the solvent and the
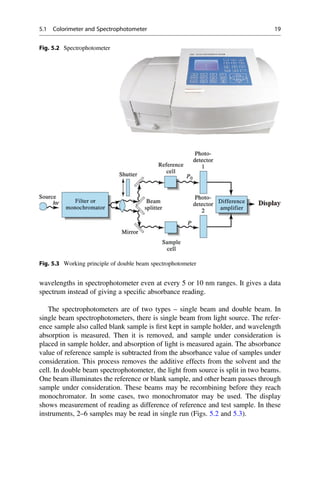
cell. In double beam spectrophotometer, the light from source is split in two beams.
One beam illuminates the reference or blank sample, and other beam passes through
sample under consideration. These beams may be recombining before they reach
monochromator. In some cases, two monochromator may be used. The display
shows measurement of reading as difference of reference and test sample. In these
instruments, 2–6 samples may be read in single run (Figs. 5.2 and 5.3).
Fig. 5.2 Spectrophotometer
Fig. 5.3 Working principle of double beam spectrophotometer
5.1 Colorimeter and Spectrophotometer 19
35.
The sample cuvetteused in spectrophotometer is made of quartz instead of glass
cuvette as in colorimeter. Although glass cuvette can be used for wavelength
measurement in visible range, but only quartz cuvette can be used for wavelength
measurement in UV region since glass absorbs UV light. The light source used is
deuterium lamps for the UV measurement, whereas tungsten or halogen lamp is used
for measurement in visible range of electromagnetic spectrum. These days, xenon
arc lamps are also used which produces light of both UV and visible spectrum.
20 5 Photometry: Colorimeter and Spectrophotometer
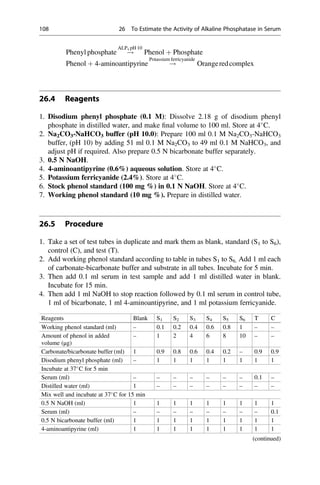
36.
Preparation of GeneralLaboratory
Solutions and Buffers 6
Almost all the experimental techniques in clinical biochemistry require the use of
solutions. A solution is a homogenous mixture of two or more nonreactive
substances. It is made up of two components. The dissolved substance is called
solute, and the medium in which solute is dissolved is called solvent. The solutions
are prepared in terms of concentrations. The concentration of a solution can be
defined as the amount of solute present in a given quantity of solution. Following are
the common ways to express the concentration of a solution:
6.1 Molar Solutions
One molar solution (1 M) contains 1 g molecular weight of solute per liter of
solution. For example, 1 M solution of NaOH contains 40 g of NaOH per liter of
solution.
6.1.1 Molarity (M)
Molarity of a solution, also termed as molar concentration, is the number of moles of
solute dissolved in 1 litre of solution. The molarity of a solution can be calculated
when the number of grams of the substance present or dissolved in the solution,
molecular weight of the dissolved substance, and the volume of the solution are
known.
# Springer Nature Singapore Pte Ltd. 2018
V. Kumar, K. D. Gill, Basic Concepts in Clinical Biochemistry: A Practical Guide,
https://doi.org/10.1007/978-981-10-8186-6_6
21
37.
Molarity M
ð Þ¼
Number of moles of solute
Litre of solution
¼
Weight in gram 1000
Molecular weight volume ml
ð Þ
For example, the molarity of a 1 litre solution containing 4 g of NaOH will be
0.1 M, i.e.,
Molarity ¼
4 1000
40 1000
¼ 0:1M
If we know the molarity of solution to be prepared, then the amount (weight) of
salt that needs to be dissolved for preparation of per liter solution can be calculated.
For example, to prepare 1 litre solution of 0.2 M NaOH,
Molecular weight of NaOH ¼ 40, so
0:2 ¼
Weight in gram 1000
40 1000
Weight in gram ¼ 0.2 40 ¼ 8 g (i.e., 8 g of NaOH is dissolved in 1 litre final
volume of distilled water).
Alternatively, if we directly multiply required molarity with molecular weight, it
will give weight of salt in gram per liter of solution.
For example, to calculate amount of salt to prepare 0.2 M NaOH,
0:2 40 ¼ 8 g=L
Note If required molarity is in mM, then salt amount will be in mg/liter, and if
molarity is in μM, then amount will be in μg/liter.
However, the molarity of conc. solution can be expressed as
M ¼
%purity specific gravity 1000
Molecular weight 100
6.2 Normal Solutions
One normal solution is the solution which contains 1 g equivalent weight of solute
per liter of solution.
22 6 Preparation of General Laboratory Solutions and Buffers
38.
6.2.1 Normality (N)
Normalitycan be defined as the number of equivalents of a solute dissolved in 1 litre
of solution. An equivalent is the molecular mass of the acid or base expressed in
grams divided by the number of moles of hydronium or hydroxyl ions produced by
this amount of acid or base.
N ¼
Molecular mass 1000
Equivalent weight volume ml
ð Þ
The equivalent weight of an acid can be calculated as
Equivalent weight ¼ molecular weight of an acid=basicity
The basicity of an acid is defined as the number of replaceable hydrogen atoms
present in one molecule of acid. That is, for hydrochloric acid (HCl), molecular
weight is 36.5, and basicity is 1, so equivalent weight is 36.5; however, in case of
sulfuric acid (H2SO4), molecular weight is 98, and basicity is 2, so equivalent weight
will be 98/2 ¼ 49.
The equivalent weight of a base can be calculated as
Equivalent weight ¼ molecular weight of an base=acidity
The acidity of a base is defined as the number of hydroxyl ions which a molecule
of base can furnish in aqueous solution. For example, acidity for NaOH is 1, and for
Na2CO3, it is 2.
The normality of given conc./stock solution can be calculated as
N ¼
%purity specific gravity 1000
Equivalent weight 100
If we have to prepare a solution of specific normality from a given stock solution
of acid/alkali with known normality, then such solutions can be prepared by apply-
ing the relationship given below:
N1 V1 ¼ N2 V2
where
N1 ¼ normality of stock solution
V1 ¼ volume of stock solution
N2 ¼ normality of solution to be prepared
V2 ¼ volume of solution to be prepared
6.2 Normal Solutions 23
39.
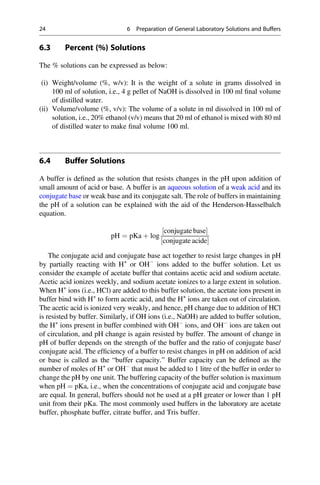
6.3 Percent (%)Solutions
The % solutions can be expressed as below:
(i) Weight/volume (%, w/v): It is the weight of a solute in grams dissolved in
100 ml of solution, i.e., 4 g pellet of NaOH is dissolved in 100 ml final volume
of distilled water.
(ii) Volume/volume (%, v/v): The volume of a solute in ml dissolved in 100 ml of
solution, i.e., 20% ethanol (v/v) means that 20 ml of ethanol is mixed with 80 ml
of distilled water to make final volume 100 ml.
6.4 Buffer Solutions
A buffer is defined as the solution that resists changes in the pH upon addition of
small amount of acid or base. A buffer is an aqueous solution of a weak acid and its
conjugate base or weak base and its conjugate salt. The role of buffers in maintaining
the pH of a solution can be explained with the aid of the Henderson-Hasselbalch
equation.
pH ¼ pKa þ log
conjugate base
½
conjugate acide
½
The conjugate acid and conjugate base act together to resist large changes in pH
by partially reacting with H+
or OH
ions added to the buffer solution. Let us
consider the example of acetate buffer that contains acetic acid and sodium acetate.
Acetic acid ionizes weekly, and sodium acetate ionizes to a large extent in solution.
When H+
ions (i.e., HCl) are added to this buffer solution, the acetate ions present in
buffer bind with H+
to form acetic acid, and the H+
ions are taken out of circulation.
The acetic acid is ionized very weakly, and hence, pH change due to addition of HCl
is resisted by buffer. Similarly, if OH ions (i.e., NaOH) are added to buffer solution,
the H+
ions present in buffer combined with OH
ions, and OH
ions are taken out
of circulation, and pH change is again resisted by buffer. The amount of change in
pH of buffer depends on the strength of the buffer and the ratio of conjugate base/
conjugate acid. The efficiency of a buffer to resist changes in pH on addition of acid
or base is called as the “buffer capacity.” Buffer capacity can be defined as the
number of moles of H+
or OH
that must be added to 1 litre of the buffer in order to
change the pH by one unit. The buffering capacity of the buffer solution is maximum
when pH ¼ pKa, i.e., when the concentrations of conjugate acid and conjugate base
are equal. In general, buffers should not be used at a pH greater or lower than 1 pH
unit from their pKa. The most commonly used buffers in the laboratory are acetate
buffer, phosphate buffer, citrate buffer, and Tris buffer.
24 6 Preparation of General Laboratory Solutions and Buffers
40.
6.5 Physiological Buffersin the Human Body
In the first instance, pH in the human body is maintained by physiological buffers.
Buffers may be intracellular and extracellular. Different buffer systems work in
correlation with one another. It means that changes in one buffer system lead to
changes in another. Various metabolic processes in body produce substantial
amounts of acids and bases. The production of these acids and bases may disturb
the blood pH. The normal blood pH is 7.4, and it is regulated very precisely. Various
conditions such as uncontrolled diabetes mellitus, nephritis, vomiting, diarrhea, etc.
cause change in blood pH. The physiological buffers help effectively to regulate
blood pH and maintain acid-base balance of body which if disturbed can disturb
metabolic processes.
The main physiological buffers in our body are the following:
1. Carbonate-bicarbonate buffer: It is the most important extracellular buffer and
has the largest buffering capacity. It is present in high concentration in plasma and
acts in cooperation with other buffers. It also plays an important role in the red
blood cells.
2. Hemoglobin buffer: It is the main intracellular buffer of the blood and regulates
blood pH by the removal of hydrogen ions from blood cells.
3. Protein buffer: It is an extracellular buffer together with bicarbonate buffer,
represented by plasma proteins. The histidine content of proteins plays an impor-
tant role in its buffering ability due to its pKa very near to blood pH.
4. Phosphate buffer: This buffer takes part in hydrogen ion excretion in renal
tubules and is not of great importance in blood due to its less concentration
although it has pKa close to blood pH.
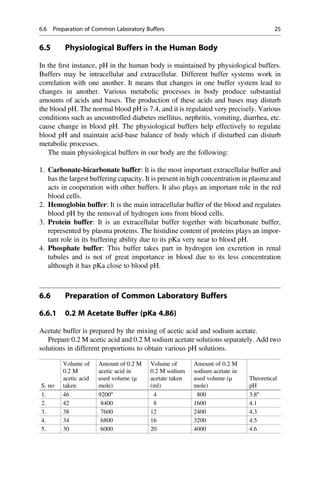
6.6 Preparation of Common Laboratory Buffers
6.6.1 0.2 M Acetate Buffer (pKa 4.86)
Acetate buffer is prepared by the mixing of acetic acid and sodium acetate.
Prepare 0.2 M acetic acid and 0.2 M sodium acetate solutions separately. Add two
solutions in different proportions to obtain various pH solutions.
S. no
Volume of
0.2 M
acetic acid
taken
Amount of 0.2 M
acetic acid in
used volume (μ
mole)
Volume of
0.2 M sodium
acetate taken
(ml)
Amount of 0.2 M
sodium acetate in
used volume (μ
mole)
Theoretical
pH
1. 46 9200a
4 800 3.8a
2. 42 8400 8 1600 4.1
3. 38 7600 12 2400 4.3
4. 34 6800 16 3200 4.5
5. 30 6000 20 4000 4.6
6.6 Preparation of Common Laboratory Buffers 25
41.
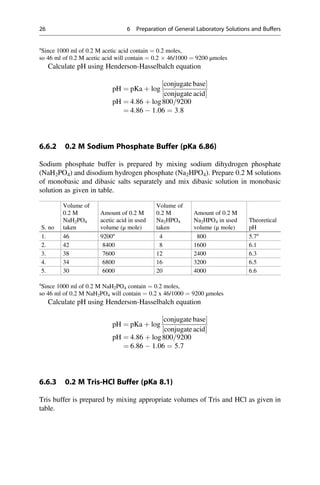
a
Since 1000 mlof 0.2 M acetic acid contain ¼ 0.2 moles,
so 46 ml of 0.2 M acetic acid will contain ¼ 0.2 46/1000 ¼ 9200 μmoles
Calculate pH using Henderson-Hasselbalch equation
pH ¼ pKa þ log
conjugate base
½
conjugate acid
½
pH ¼ 4:86 þ log800=9200
¼ 4:86 1:06 ¼ 3:8
6.6.2 0.2 M Sodium Phosphate Buffer (pKa 6.86)
Sodium phosphate buffer is prepared by mixing sodium dihydrogen phosphate
(NaH2PO4) and disodium hydrogen phosphate (Na2HPO4). Prepare 0.2 M solutions
of monobasic and dibasic salts separately and mix dibasic solution in monobasic
solution as given in table.
S. no
Volume of
0.2 M
NaH2PO4
taken
Amount of 0.2 M
acetic acid in used
volume (μ mole)
Volume of
0.2 M
Na2HPO4
taken
Amount of 0.2 M
Na2HPO4 in used
volume (μ mole)
Theoretical
pH
1. 46 9200a
4 800 5.7a
2. 42 8400 8 1600 6.1
3. 38 7600 12 2400 6.3
4. 34 6800 16 3200 6.5
5. 30 6000 20 4000 6.6
a
Since 1000 ml of 0.2 M NaH2PO4 contain ¼ 0.2 moles,
so 46 ml of 0.2 M NaH2PO4 will contain ¼ 0.2 x 46/1000 ¼ 9200 μmoles
Calculate pH using Henderson-Hasselbalch equation
pH ¼ pKa þ log
conjugate base
½
conjugate acid
½
pH ¼ 4:86 þ log800=9200
¼ 6:86 1:06 ¼ 5:7
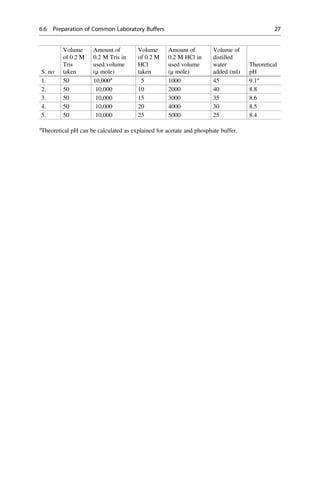
6.6.3 0.2 M Tris-HCl Buffer (pKa 8.1)
Tris buffer is prepared by mixing appropriate volumes of Tris and HCl as given in
table.
26 6 Preparation of General Laboratory Solutions and Buffers
42.
S. no
Volume
of 0.2M
Tris
taken
Amount of
0.2 M Tris in
used volume
(μ mole)
Volume
of 0.2 M
HCl
taken
Amount of
0.2 M HCl in
used volume
(μ mole)
Volume of
distilled
water
added (ml)
Theoretical
pH
1. 50 10,000a
5 1000 45 9.1a
2. 50 10,000 10 2000 40 8.8
3. 50 10,000 15 3000 35 8.6
4. 50 10,000 20 4000 30 8.5
5. 50 10,000 25 5000 25 8.4
a
Theoretical pH can be calculated as explained for acetate and phosphate buffer.
6.6 Preparation of Common Laboratory Buffers 27
43.
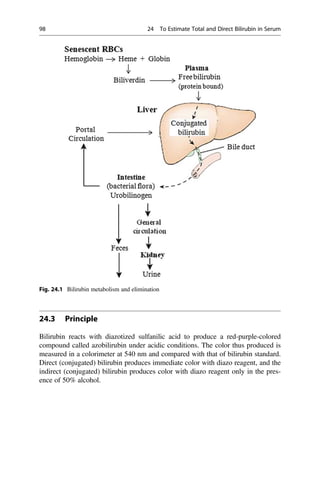
Examination of Urinefor Normal
Constituents 7
Urine is the excretory product of the body produced by the process of filtration,
reabsorption, and tubular secretion. Urine can be collected and examined easily, and
presence of certain substances in the urine may indicate the metabolic state of the
body. The routine and microscopic examinations of urine are helpful in the diagnosis
of several pathological conditions. Urine sample is collected in clean vials. A
random sample is usually taken for routine clinical examination; however, first-
morning urine is preferred for urinalysis and microscopic analysis, since it is
generally more conc. Timed collection specimens may be required for quantitative
measurement of certain analytes. Fresh or preserved urine samples are used for
chemical and culture-based microbiological testing. The specimens that are
unpreserved for more than 2 h or refrigerated for a long time may not be suitable
for analysis due to potential bacterial overgrowth and invalidation of bacterial
colony counts or errors in chemical urinalysis.
7.1 Preservatives Used for Urine Collection
The commonly used preservatives for urine sample collection in clinical biochemis-
try laboratory are:
1. 6 N HCl in proportion of 10 ml/24 h urine
2. Few drops of formalin in 30 ml of urine
3. 50% acetic acid
4. 6 N HNO3
5. Boric acid, toluene, Na2CO3
# Springer Nature Singapore Pte Ltd. 2018
V. Kumar, K. D. Gill, Basic Concepts in Clinical Biochemistry: A Practical Guide,
https://doi.org/10.1007/978-981-10-8186-6_7
29
44.
7.2 Physical Examinationof Urine
7.2.1 Color and Odor
Normal urine is colorless to straw colored due to presence of urochrome. Slight
change in color occurs in fever, dehydration jaundice, or vitamin B-complex therapy
which adds riboflavin (deep yellow color). Red to brown color is observed in
hematuria, hemoglobinuria, myoglobinuria, and porphyria. Urine turns brown to
black in alkaptonuria and methemoglobinuria. Normally odor of urine is faintly
aromatic. On decomposition, a very unpleasant ammoniacal odor evolves. Food
beverages and drugs may impart a specific odor to urine.
7.2.2 Appearance
Normally freshly voided urine is clear and transparent, but it may become turbid if
exposed for a long time due to the bacterial action on urea present in urine to convert
it into ammonium carbonate. Phosphate excretion in alkaline urine also makes urine
turbid. The presence of white cells, red cells, or epithelial cells makes urine cloudy.
Fat globules give urine milky appearance.
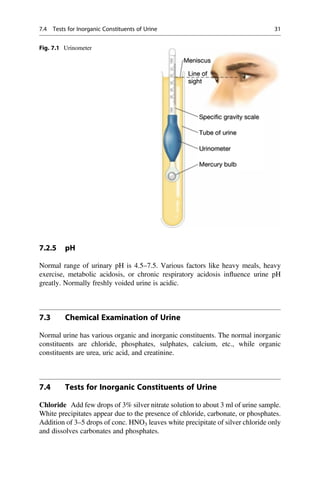
7.2.3 Specific Gravity
Specific gravity of urine is measured by urinometer. Specific gravity of normal urine
is between 1.002 and 1.026 and depends upon state of hydration, diet, fluid intake,
drugs, etc. Severe dehydration, diabetes mellitus, adrenal insufficiency, diabetes
insipidus, and chronic nephritis increase specific gravity (Fig. 7.1).
7.2.4 Volume
Normal healthy individual excretes about 800–2000 ml of urine/day. Daily urinary
excretion depends upon intake of fluid volume, loss of fluid, solute load, climatic
condition, fever, or intake of drugs. The term polyuria is used if urinary output is
more than 3000 ml/day. It occurs in conditions like diabetes insipidus, diabetes
mellitus, or recovery from acute renal failure. In oliguria, urine output is less than
500 ml/day. Oliguria may be due to fewer intakes of water or due to dehydration or
may indicate early renal dysfunction symptoms. In anuria, a complete cessation of
urine output (100 ml/day) is observed. Anuria should be taken care immediately;
otherwise complete renal failure may take place.
30 7 Examination of Urine for Normal Constituents
45.
7.2.5 pH
Normal rangeof urinary pH is 4.5–7.5. Various factors like heavy meals, heavy
exercise, metabolic acidosis, or chronic respiratory acidosis influence urine pH
greatly. Normally freshly voided urine is acidic.
7.3 Chemical Examination of Urine
Normal urine has various organic and inorganic constituents. The normal inorganic
constituents are chloride, phosphates, sulphates, calcium, etc., while organic
constituents are urea, uric acid, and creatinine.
7.4 Tests for Inorganic Constituents of Urine
Chloride Add few drops of 3% silver nitrate solution to about 3 ml of urine sample.
White precipitates appear due to the presence of chloride, carbonate, or phosphates.
Addition of 3–5 drops of conc. HNO3 leaves white precipitate of silver chloride only
and dissolves carbonates and phosphates.
Fig. 7.1 Urinometer
7.4 Tests for Inorganic Constituents of Urine 31
46.
Phosphates To 3ml of urine, add 1 ml of conc. HNO3 and 5 ml of ammonium
molybdate and warm gently. A yellow precipitate of phosphomolybdic acid
indicates the presence of phosphate.
Sulphates To 3 ml of urine, add 3–5 drops of 2% barium chloride (BaCl2) solution
followed by 5 drops of conc. HCl. A white precipitate of BaSO4 indicates inorganic
sulphate.
Ammonia Boil urine with equal volume of 10% NaOH. Smell of ammonia gas
indicates the presence of ammonium ion in the urine sample.
Calcium Add few drops of glacial acetic acid to about 5 ml of urine followed by
addition of 1 ml of 4% ammonium oxalate solution. Calcium is slowly precipitated
as oxalate as enveloped shaped crystals that can be observed under microscope.
7.5 Tests for Organic Constituents
Urea Since urea is the end product of protein metabolism, urea excretion in urine is
an index of protein intake in diet. Urea in urine is increased in exaggerated protein
metabolism, fevers, and increased adrenocortical activity. It is decreased in the last
stages of severe hepatic diseases and in acidosis.
7.6 Detection of Urea
Hypobromite Test To about 3 ml of urine, add two drops of freshly prepared
alkaline sodium hypobromite solution. A marked effervescence due to evolution of
nitrogen indicates urea.
Biuret Formation Test Evaporate 3 ml of urine to dryness in a test tube to evolve
ammonia. Cool and dilute the residue in 10% NaOH. Then add 1–2 drops of 1%
CuSO4. A red rose color formation indicates formation of biuret from urea on
heating.
Creatinine Detection by Jaffe’s Picric Acid Test Add 3 drops of saturated picric
acid solution to about 3 ml of urine. Make it alkaline with few drops of NaOH
solution. The red color formation confirms formation of creatinine picrate.
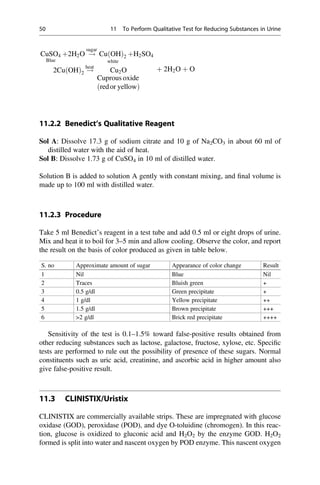
Uric Acid Detection To about 3 ml urine sample saturated with Na2CO3, add
2 drops of Folin’s phosphotungstic acid reagent. Uric acid reduces phosphotungstate
in alkaline solution and forms blue color.
32 7 Examination of Urine for Normal Constituents
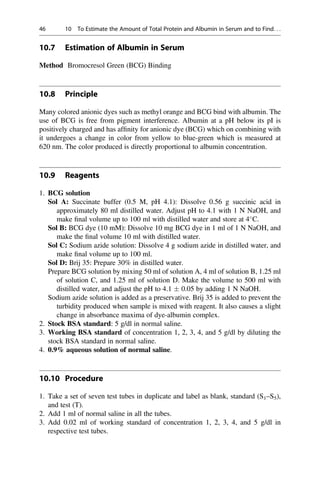
47.
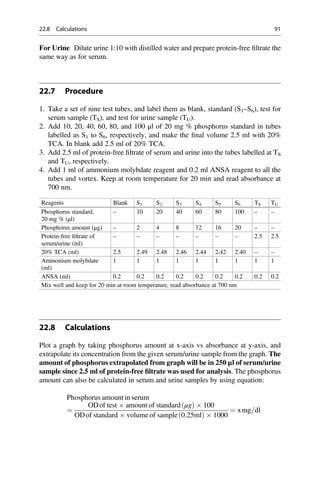
To Perform QualitativeTests for Urinary
Proteins 8
8.1 Theory
Proteins are organic compounds containing nitrogen in addition to carbon, hydro-
gen, and oxygen. Sixteen percent of total protein weight is contributed by nitrogen.
Proteins are responsible for distribution of body fluids and ions on both sides of the
membrane. The plasma proteins act as buffers and regulate change in plasma
pH. The normal protein excretion in urine is about 30–150 mg/day. The proteins
in urine are normally derived from plasma filtrate and the lower lining of urinary
tract due to tissue damage. The serum globulins, albumin, and proteins secreted by
the nephron forms normal urinary proteins. About one third of urinary protein is
albumin and remaining includes many small globulins. Plasma proteins of molecular
weight less than 50 kDa easily pass through glomerular membrane of nephron and
are usually reabsorbed from kidney tubular cells. Albumin with molecular weight of
66 kDa is filtered only in very small amounts. Retinol-binding proteins,
β2 microglobulins, immunoglobulin light chain, and lysozyme are also excreted in
small amount. In summary, a healthy man excrete trace amount of proteins in urine.
The large excretion of proteins in urine is called proteinuria. Proteinuria is an
important indicator of kidney disease and the risk of disease progression. The
proteinuria may also be caused by overflow of abnormal proteins in disease
conditions such as multiple myeloma. The prevalence of proteinuria increases with
kidney disease progression. The analysis of protein-to-creatinine ratio on a spot urine
sample is used commonly to assess the 24 h urine protein excretion, and an albumin-
to-creatinine ratio is used to approximate 24 h urine albumin excretion. Albumin-to-
creatinine ratio is more sensitive than protein-to-creatinine ratio in detecting low
levels of proteinuria. The normal urine albumin-to-creatinine ratio is less than
3.0 mg/mmol (ratio greater than 30 indicate severe increase of albumin excretion
in urine), while normal protein-to-creatinine ratio is 15 mg/mmol.
# Springer Nature Singapore Pte Ltd. 2018
V. Kumar, K. D. Gill, Basic Concepts in Clinical Biochemistry: A Practical Guide,
https://doi.org/10.1007/978-981-10-8186-6_8
33
48.
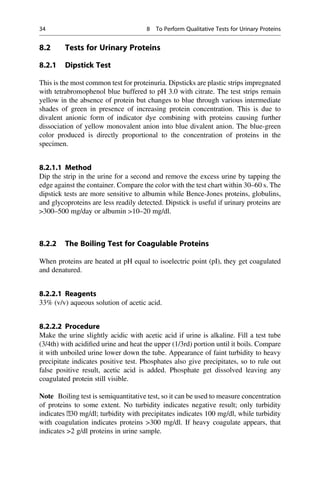
8.2 Tests forUrinary Proteins
8.2.1 Dipstick Test
This is the most common test for proteinuria. Dipsticks are plastic strips impregnated
with tetrabromophenol blue buffered to pH 3.0 with citrate. The test strips remain
yellow in the absence of protein but changes to blue through various intermediate
shades of green in presence of increasing protein concentration. This is due to
divalent anionic form of indicator dye combining with proteins causing further
dissociation of yellow monovalent anion into blue divalent anion. The blue-green
color produced is directly proportional to the concentration of proteins in the
specimen.
8.2.1.1 Method
Dip the strip in the urine for a second and remove the excess urine by tapping the
edge against the container. Compare the color with the test chart within 30–60 s. The
dipstick tests are more sensitive to albumin while Bence-Jones proteins, globulins,
and glycoproteins are less readily detected. Dipstick is useful if urinary proteins are
300–500 mg/day or albumin 10–20 mg/dl.
8.2.2 The Boiling Test for Coagulable Proteins
When proteins are heated at pH equal to isoelectric point (pI), they get coagulated
and denatured.
8.2.2.1 Reagents
33% (v/v) aqueous solution of acetic acid.
8.2.2.2 Procedure
Make the urine slightly acidic with acetic acid if urine is alkaline. Fill a test tube
(3/4th) with acidified urine and heat the upper (1/3rd) portion until it boils. Compare
it with unboiled urine lower down the tube. Appearance of faint turbidity to heavy
precipitate indicates positive test. Phosphates also give precipitates, so to rule out
false positive result, acetic acid is added. Phosphate get dissolved leaving any
coagulated protein still visible.
Note Boiling test is semiquantitative test, so it can be used to measure concentration
of proteins to some extent. No turbidity indicates negative result; only turbidity
indicates ˂30 mg/dl; turbidity with precipitates indicates 100 mg/dl, while turbidity
with coagulation indicates proteins 300 mg/dl. If heavy coagulate appears, that
indicates 2 g/dl proteins in urine sample.
34 8 To Perform Qualitative Tests for Urinary Proteins
49.
8.2.3 Sulphosalicylic AcidTest
Sulphosalicylic acid is an anionic protein precipitant; it reacts with protein cations
and causes precipitation.
8.2.3.1 Reagent
Three percent aqueous solution of sulphosalicylic acid.
8.2.3.2 Procedure
Mix 1 ml of urine with 3 ml of sulphosalicylic acid. Presence of turbidity or white
precipitate indicates proteins. Uric acid may give false positive test. To rule out this
possibility, the sample is heated; if it becomes clear, proteins are absent and turbidity
is due to uric acid.
8.2.4 Nitric Acid Ring Test (Heller’s Test)
8.2.4.1 Reagents
Conc. HNO3.
8.2.4.2 Procedure
Layer the urine carefully over few ml of conc. HNO3 in a test tube so as to get a sharp
line of demarcation. Proteins give a white color ring at the junction of fluids.
However, urea, uric acid, and iodinated organic compounds used for X-rays of the
urinary tract can give false positive test.
8.2.5 Bence-Jones Proteins
Bence-Jones proteins are light chains of immunoglobulins which precipitate at low
temperature. The excretion of Bence-Jones proteins in urine is associated with
multiple myeloma and malignant lymphoma. Bence-Jones proteins are synthesized
by malignant plasma cells. There are three qualitative tests to indicate the presence of
Bence-Jones proteins.
8.2.5.1 Harrison’s Test
Principle
Bence-Jones proteins coagulate at temperature from 40 to 60
C, but the precipitated
proteins dissolve at the boiling point (80–100
C). Subsequent cooling to 40–50
C
reprecipitates the proteins.
Procedure
Add urine to 3/4 of test tube and add few drops of 33% acetic acid. The temperature
is increased up to 40–60
C. Bence-Jones proteins get precipitated. If the temperature
8.2 Tests for Urinary Proteins 35
50.
is increased further,then precipitates get dissolved, and when cooled back to
40–60
C, the proteins precipitate again.
Precautions
1. Urine should be acidic and clear.
2. Temperature should be noted carefully.
8.2.5.2 Bradshaw’s Test
Principle
Bence-Jones proteins get precipitated by HCl.
Procedure
Layer the urine carefully over conc. HCl in a test tube. If Bence-Jones proteins are
present in urine, these will be precipitated by the HCl and form a fine or heavy ring at
the interface of urine and HCl. Albumin may give a false positive test with HCl. To
rule out the possibility of presence of albumin, dilute the urine with distilled water
and repeat the test. The precipitate confirms the presence of Bence-Jones proteins.
8.2.5.3 Osgood and Haskin’s Test
Principle
Bence-Jones proteins are precipitated in saturated sodium chloride (NaCl) solution at
acidic pH.
Procedure
Add 0.5 ml of 50% acetic acid to 1.5 ml of saturated NaCl solution. To this, add
2.5 ml of fresh urine sample. The formation of precipitate at room temperature
indicates the presence of Bence-Jones proteins.
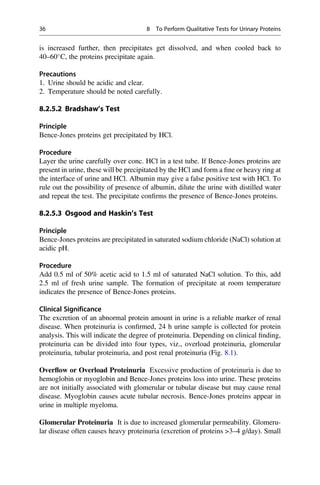
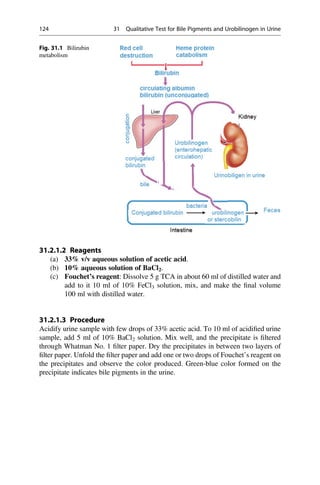
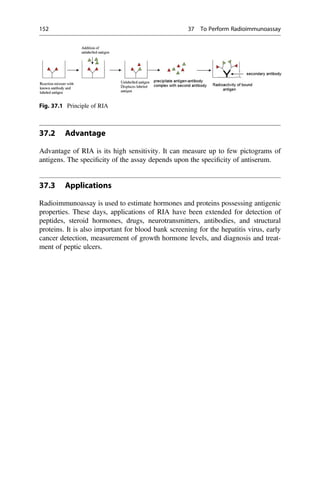
Clinical Significance
The excretion of an abnormal protein amount in urine is a reliable marker of renal
disease. When proteinuria is confirmed, 24 h urine sample is collected for protein
analysis. This will indicate the degree of proteinuria. Depending on clinical finding,
proteinuria can be divided into four types, viz., overload proteinuria, glomerular
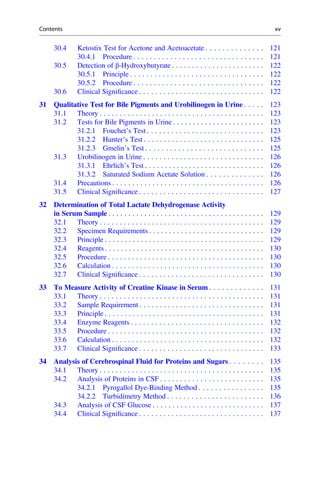
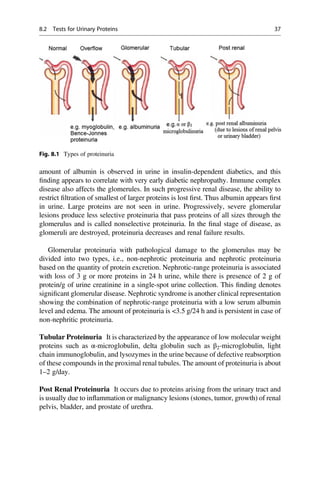
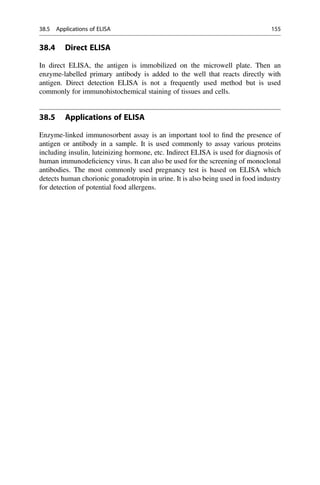
proteinuria, tubular proteinuria, and post renal proteinuria (Fig. 8.1).
Overflow or Overload Proteinuria Excessive production of proteinuria is due to
hemoglobin or myoglobin and Bence-Jones proteins loss into urine. These proteins
are not initially associated with glomerular or tubular disease but may cause renal
disease. Myoglobin causes acute tubular necrosis. Bence-Jones proteins appear in
urine in multiple myeloma.
Glomerular Proteinuria It is due to increased glomerular permeability. Glomeru-
lar disease often causes heavy proteinuria (excretion of proteins 3–4 g/day). Small
36 8 To Perform Qualitative Tests for Urinary Proteins
51.
amount of albuminis observed in urine in insulin-dependent diabetics, and this
finding appears to correlate with very early diabetic nephropathy. Immune complex
disease also affects the glomerules. In such progressive renal disease, the ability to
restrict filtration of smallest of larger proteins is lost first. Thus albumin appears first
in urine. Large proteins are not seen in urine. Progressively, severe glomerular
lesions produce less selective proteinuria that pass proteins of all sizes through the
glomerulus and is called nonselective proteinuria. In the final stage of disease, as
glomeruli are destroyed, proteinuria decreases and renal failure results.
Glomerular proteinuria with pathological damage to the glomerulus may be
divided into two types, i.e., non-nephrotic proteinuria and nephrotic proteinuria
based on the quantity of protein excretion. Nephrotic-range proteinuria is associated
with loss of 3 g or more proteins in 24 h urine, while there is presence of 2 g of
protein/g of urine creatinine in a single-spot urine collection. This finding denotes
significant glomerular disease. Nephrotic syndrome is another clinical representation
showing the combination of nephrotic-range proteinuria with a low serum albumin
level and edema. The amount of proteinuria is 3.5 g/24 h and is persistent in case of
non-nephritic proteinuria.
Tubular Proteinuria It is characterized by the appearance of low molecular weight
proteins such as α-microglobulin, delta globulin such as β2-microglobulin, light
chain immunoglobulin, and lysozymes in the urine because of defective reabsorption
of these compounds in the proximal renal tubules. The amount of proteinuria is about
1–2 g/day.
Post Renal Proteinuria It occurs due to proteins arising from the urinary tract and
is usually due to inflammation or malignancy lesions (stones, tumor, growth) of renal
pelvis, bladder, and prostate of urethra.
Fig. 8.1 Types of proteinuria
8.2 Tests for Urinary Proteins 37
52.
To Determine theQuantity of Proteins
in Urine Sample Using Biuret Reaction 9
9.1 Theory
Healthy persons excrete urine that is largely free of proteins. The analysis of urine for
the presence of proteins is important for the diagnosis of renal, cardiac, and thyroid-
related diseases. Several physiological and pathophysiological mechanisms cause
the urinary excretion of proteins. The normal protein excretion in urine is about
30–150 mg/day. About one third of the total urinary protein is albumin, and the
remaining includes many small globulins. Small proteins are filtered readily in
filtrate but are reabsorbed downstream by proximal tubular cells. The small amount
of albumin filtered through the glomeruli is mostly absorbed by proximal tubular
cells and degraded by lysosomal enzymes into fragments, which are returned to
circulation in same way as that for small molecular weight proteins. The presence of
excess proteins in urine often causes the urine to become foamy, but other conditions
like presence of bilirubin in the urine (bilirubinuria), pneumaturia (air bubbles in the
urine), or drugs may also make urine foamy. The presence of increased amounts of
proteins in the urine may indicate a serious disease problem or may appear before
any other clinical symptoms.
9.2 Specimen Requirements
A 12 h or 24 h urine specimen without any preservative is preferred. Use fresh
sample otherwise store at 2–8
C for up to 48 h.
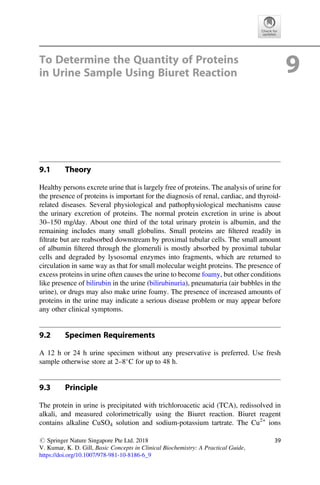
9.3 Principle
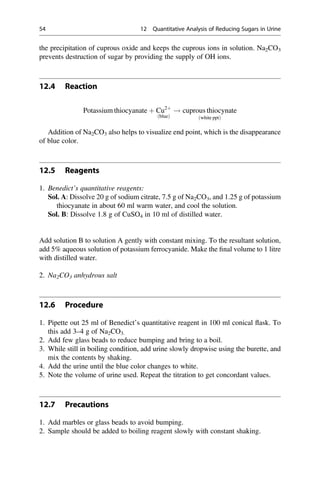
The protein in urine is precipitated with trichloroacetic acid (TCA), redissolved in
alkali, and measured colorimetrically using the Biuret reaction. Biuret reagent
contains alkaline CuSO4 solution and sodium-potassium tartrate. The Cu2+
ions
# Springer Nature Singapore Pte Ltd. 2018
V. Kumar, K. D. Gill, Basic Concepts in Clinical Biochemistry: A Practical Guide,
https://doi.org/10.1007/978-981-10-8186-6_9
39
53.
form a coordinationcomplex with four imino groups present in the peptide bonds
and show an absorption maximum at 540 nm. The method is suitable for estimation
of proteins having concentration greater than 1 mg. The intensity of color produced
is directly proportional to the amount of protein present in the sample.
9.4 Reagents
1. 20% TCA – Dissolve 20 g TCA in final volume of 100 ml distilled water.
2. 0.5 N NaOH – Dissolve 2 g of NaOH in final volume of 100 ml distilled water.
3. Bovine serum albumin (BSA) standard (0.5 g/dl) – Dissolve 0.5 g BSA in
100 ml distilled water or normal saline. Do not shake.
4. Biuret reagent – Dissolve 9 g of sodium-potassium tartrate in 500 ml of 0.2 N
NaOH solution. To this add 3 g of CuSO4 previously dissolved in 100 ml distilled
water, gently with constant mixing. Then dissolve 5 g potassium iodide and make
final volume up to 1 litre with 0.2 N NaOH.
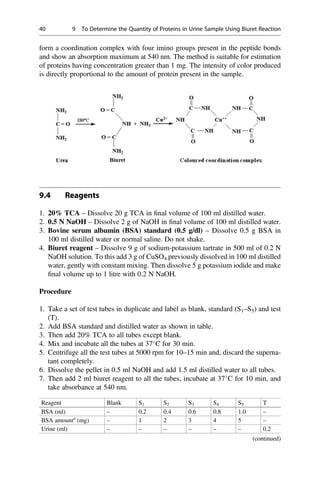
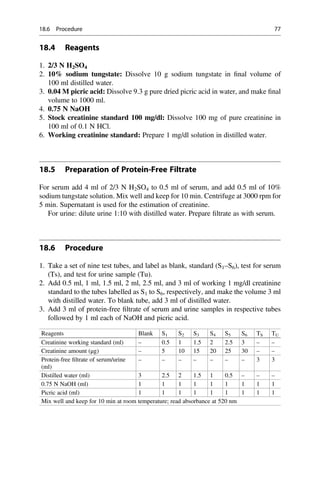
Procedure
1. Take a set of test tubes in duplicate and label as blank, standard (S1–S5) and test
(T).
2. Add BSA standard and distilled water as shown in table.
3. Then add 20% TCA to all tubes except blank.
4. Mix and incubate all the tubes at 37
C for 30 min.
5. Centrifuge all the test tubes at 5000 rpm for 10–15 min and, discard the superna-
tant completely.
6. Dissolve the pellet in 0.5 ml NaOH and add 1.5 ml distilled water to all tubes.
7. Then add 2 ml biuret reagent to all the tubes, incubate at 37
C for 10 min, and
take absorbance at 540 nm.
Reagent Blank S1 S2 S3 S4 S5 T
BSA (ml) – 0.2 0.4 0.6 0.8 1.0 –
BSA amounta
(mg) – 1 2 3 4 5 –
Urine (ml) – – – – – – 0.2
(continued)
40 9 To Determine the Quantity of Proteins in Urine Sample Using Biuret Reaction
54.
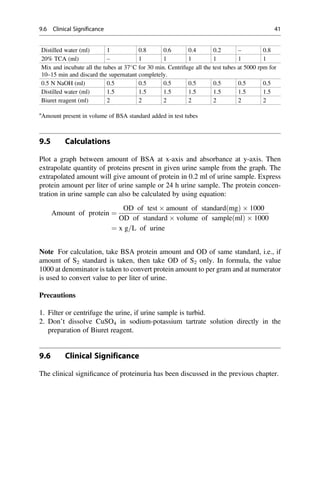
Distilled water (ml)1 0.8 0.6 0.4 0.2 – 0.8
20% TCA (ml) – 1 1 1 1 1 1
Mix and incubate all the tubes at 37
C for 30 min. Centrifuge all the test tubes at 5000 rpm for
10–15 min and discard the supernatant completely.
0.5 N NaOH (ml) 0.5 0.5 0.5 0.5 0.5 0.5 0.5
Distilled water (ml) 1.5 1.5 1.5 1.5 1.5 1.5 1.5
Biuret reagent (ml) 2 2 2 2 2 2 2
a
Amount present in volume of BSA standard added in test tubes
9.5 Calculations
Plot a graph between amount of BSA at x-axis and absorbance at y-axis. Then
extrapolate quantity of proteins present in given urine sample from the graph. The
extrapolated amount will give amount of protein in 0.2 ml of urine sample. Express
protein amount per liter of urine sample or 24 h urine sample. The protein concen-
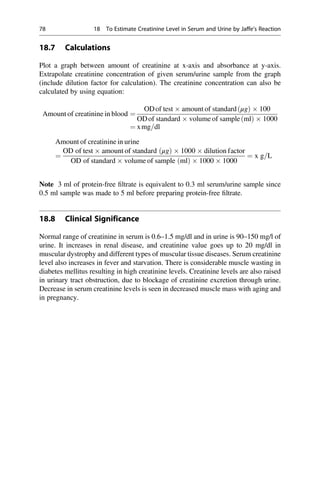
tration in urine sample can also be calculated by using equation:
Amount of protein ¼
OD of test amount of standardðmgÞ 1000
OD of standard volume of sampleðmlÞ 1000
¼ x g=L of urine
Note For calculation, take BSA protein amount and OD of same standard, i.e., if
amount of S2 standard is taken, then take OD of S2 only. In formula, the value
1000 at denominator is taken to convert protein amount to per gram and at numerator
is used to convert value to per liter of urine.
Precautions
1. Filter or centrifuge the urine, if urine sample is turbid.
2. Don’t dissolve CuSO4 in sodium-potassium tartrate solution directly in the
preparation of Biuret reagent.
9.6 Clinical Significance
The clinical significance of proteinuria has been discussed in the previous chapter.
9.6 Clinical Significance 41
55.
To Estimate theAmount of Total Protein
and Albumin in Serum and to Find A/G
Ratio
10
10.1 Theory
Proteins are present in all body fluids but show very high concentration ( 3 g/dl) in
plasma, lymphatic fluids, and some exudates. The amount of total proteins in serum
decreases in the third trimester of pregnancy. The measurement of total proteins in
serum is useful to assess the conditions related to changes in plasma or fluid
volumes, such as shock and dehydration. A total serum protein test measures the
total amount of proteins in the blood. Serum proteins mainly consist of albumin but
few globulins (such as α1-globulin) also may be measured. Fibrinogen is the protein
present in plasma but not in serum. Albumin is a major constituent of human plasma
and represents about 40–60% of total proteins. After its synthesis in the liver
(hepatocytes), it is secreted in plasma, a process dependent on protein intake. The
half-life of albumin is 15–19 days. Albumin has molecular weight of approximately
66,000 dalton which makes it a marker of both glomerular and blood-brain barrier
functions. The pI of albumin lies between 4 and 5.8; hence it is present as an anion at
pH 7.4. Albumin is involved in transport and storage of wide variety of ligands and
maintaining the osmotic pressure of plasma. It also serves as a source of endogenous
amino acids. Albumin is mainly measured to check liver and kidney functions but is
also important in determining the cause of swelling of the ankles (edema) or
abdomen (ascites). The globulins constitute various proteins like α, β, and γ types
that can be separated into distinct bands on electrophoresis. Few globulins are
synthesized by the liver while others by the immune system. Globulins perform
wide variety of functions including transport and immunity.
10.2 Principle
When a protein solution is treated with Cu2+
in an alkaline solution, a colored chelate
complex of unknown composition is formed between Cu2+
and carbon ion and imine
group of peptide bond. An analogous reaction takes place between Cu2+
and organic
# Springer Nature Singapore Pte Ltd. 2018
V. Kumar, K. D. Gill, Basic Concepts in Clinical Biochemistry: A Practical Guide,
https://doi.org/10.1007/978-981-10-8186-6_10
43
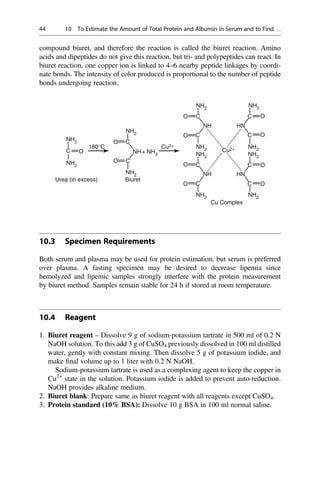
56.
compound biuret, andtherefore the reaction is called the biuret reaction. Amino
acids and dipeptides do not give this reaction, but tri- and polypeptides can react. In
biuret reaction, one copper ion is linked to 4–6 nearby peptide linkages by coordi-
nate bonds. The intensity of color produced is proportional to the number of peptide
bonds undergoing reaction.
NH2
NH2
NH2
NH
NH
NH2
NH2
NH2
NH2
NH2
NH2
NH2
NH2
NH2
HN
HN
NH
NH3
O
O C
C
C
C
C
C
C C
C
C
C
O
O
O O
O
O
O
O
O
180°C
Urea (in excess) Biuret
Cu Complex
+
Cu2+
Cu2+
10.3 Specimen Requirements
Both serum and plasma may be used for protein estimation, but serum is preferred
over plasma. A fasting specimen may be desired to decrease lipemia since
hemolyzed and lipemic samples strongly interfere with the protein measurement
by biuret method. Samples remain stable for 24 h if stored at room temperature.
10.4 Reagent
1. Biuret reagent – Dissolve 9 g of sodium-potassium tartrate in 500 ml of 0.2 N
NaOH solution. To this add 3 g of CuSO4 previously dissolved in 100 ml distilled
water, gently with constant mixing. Then dissolve 5 g of potassium iodide, and
make final volume up to 1 liter with 0.2 N NaOH.
Sodium-potassium tartrate is used as a complexing agent to keep the copper in
Cu2+
state in the solution. Potassium iodide is added to prevent auto-reduction.
NaOH provides alkaline medium.
2. Biuret blank: Prepare same as biuret reagent with all reagents except CuSO4.
3. Protein standard (10% BSA): Dissolve 10 g BSA in 100 ml normal saline.
44 10 To Estimate the Amount of Total Protein and Albumin in Serum and to Find. . .
57.
4. Working proteinstandard: Dilute stock standard with normal saline to get
concentration range of 2, 4, 6, 8, and 10 g/dl.
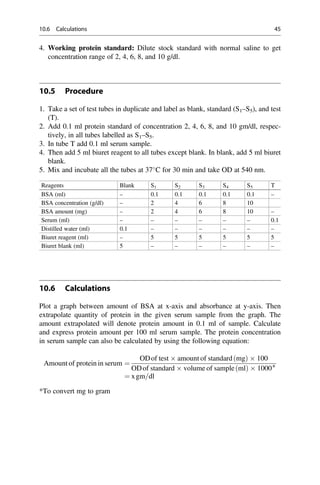
10.5 Procedure
1. Take a set of test tubes in duplicate and label as blank, standard (S1–S5), and test
(T).
2. Add 0.1 ml protein standard of concentration 2, 4, 6, 8, and 10 gm/dl, respec-
tively, in all tubes labelled as S1–S5.
3. In tube T add 0.1 ml serum sample.
4. Then add 5 ml biuret reagent to all tubes except blank. In blank, add 5 ml biuret
blank.
5. Mix and incubate all the tubes at 37
C for 30 min and take OD at 540 nm.
Reagents Blank S1 S2 S3 S4 S5 T
BSA (ml) – 0.1 0.1 0.1 0.1 0.1 –
BSA concentration (g/dl) – 2 4 6 8 10
BSA amount (mg) – 2 4 6 8 10 –
Serum (ml) – – – – – – 0.1
Distilled water (ml) 0.1 – – – – – –
Biuret reagent (ml) – 5 5 5 5 5 5
Biuret blank (ml) 5 – – – – – –
10.6 Calculations
Plot a graph between amount of BSA at x-axis and absorbance at y-axis. Then
extrapolate quantity of protein in the given serum sample from the graph. The
amount extrapolated will denote protein amount in 0.1 ml of sample. Calculate
and express protein amount per 100 ml serum sample. The protein concentration
in serum sample can also be calculated by using the following equation:
Amount of protein in serum ¼
ODof test amount of standard mg
ð Þ 100
ODof standard volume of sample ml
ð Þ 1000∗
¼ xgm=dl
*To convert mg to gram
10.6 Calculations 45
58.
10.7 Estimation ofAlbumin in Serum
Method Bromocresol Green (BCG) Binding
10.8 Principle
Many colored anionic dyes such as methyl orange and BCG bind with albumin. The
use of BCG is free from pigment interference. Albumin at a pH below its pI is
positively charged and has affinity for anionic dye (BCG) which on combining with
it undergoes a change in color from yellow to blue-green which is measured at
620 nm. The color produced is directly proportional to albumin concentration.
10.9 Reagents
1. BCG solution
Sol A: Succinate buffer (0.5 M, pH 4.1): Dissolve 0.56 g succinic acid in
approximately 80 ml distilled water. Adjust pH to 4.1 with 1 N NaOH, and
make final volume up to 100 ml with distilled water and store at 4
C.
Sol B: BCG dye (10 mM): Dissolve 10 mg BCG dye in 1 ml of 1 N NaOH, and
make the final volume 10 ml with distilled water.
Sol C: Sodium azide solution: Dissolve 4 g sodium azide in distilled water, and
make final volume up to 100 ml.
Sol D: Brij 35: Prepare 30% in distilled water.
Prepare BCG solution by mixing 50 ml of solution A, 4 ml of solution B, 1.25 ml
of solution C, and 1.25 ml of solution D. Make the volume to 500 ml with
distilled water, and adjust the pH to 4.1 0.05 by adding 1 N NaOH.
Sodium azide solution is added as a preservative. Brij 35 is added to prevent the
turbidity produced when sample is mixed with reagent. It also causes a slight
change in absorbance maxima of dye-albumin complex.
2. Stock BSA standard: 5 g/dl in normal saline.
3. Working BSA standard of concentration 1, 2, 3, 4, and 5 g/dl by diluting the
stock BSA standard in normal saline.
4. 0.9% aqueous solution of normal saline.
10.10 Procedure
1. Take a set of seven test tubes in duplicate and label as blank, standard (S1–S5),
and test (T).
2. Add 1 ml of normal saline in all the tubes.
3. Add 0.02 ml of working standard of concentration 1, 2, 3, 4, and 5 g/dl in
respective test tubes.
46 10 To Estimate the Amount of Total Protein and Albumin in Serum and to Find. . .
59.
4. In tubeT, add 0.02 ml of serum sample and in blank add 0.02 ml of distilled
water.
5. Then add 4 ml of BCG solution in all the tubes and immediately read at 620 nm.
Reagents Blank S1 S2 S3 S4 S5 T
Normal saline (ml) 1 1 1 1 1 1 1
BSA (ml) – 0.02 0.02 0.02 0.02 0.02 –
BSA concentration (g/dl) – 1 2 3 4 5 –
BSA amount (mg) – 1 2 3 4 5 –
Serum (ml) – – – – – – 0.02
Distilled water (ml) 0.02 – – – – – –
BCG Bromo cresol green (BCG)
solution (ml)
4 4 4 4 4 4 4
10.11 Calculations
Plot a graph between amount of BSA at x-axis and absorbance at y-axis. Then
extrapolate quantity of albumin in given serum sample from the graph. The albumin
concentration in serum sample can also be calculated by using the following
equation:
Amount of albumin in serum ¼
ODof test amount of standard mg
ð Þ 100
ODof standard volume of sample ml
ð Þ 1000
¼ x g=dl
10.12 Clinical Significance
The normal levels of total proteins in serum are 5.5–8.0 g/dl. The total protein
concentration may be altered by changes in plasma volume. Increase in protein
concentration may occur in dehydration, due to increased globulin synthesis, acute
or chronic infection, and multiple myeloma. The decrease in protein levels occurs
due to low protein intake, starvation, malnutrition, and decreased synthesis due to
liver diseases or nephrotic syndrome.
The normal serum albumin value is 3.5–5.5 g/dl and globulin is 2.0–3.5 g/dl. The
albumin/globulin (A/G) ratio is 1.5:2.5 (serum globulin levels are measured by
subtracting serum albumin levels from total serum proteins). In a very low or high
A/G ratio, further testing must be performed to determine the cause and diagnosis. A
low A/G ratio may indicate autoimmune disease, multiple myeloma, cirrhosis, or
kidney disease, while high A/G ratio suggests genetic deficiencies or leukemia.
Albumin amount increases in dehydration state, the condition is counteracted in
vomiting and diarrhea, and this may impair intestinal absorption of amino acids, so,
10.12 Clinical Significance 47
60.
reducing plasma-albumin formation.Albumin concentration decreases due to loss in
urine in nephrotic syndrome, chronic glomerular nephritis, diabetes, and severe
hemorrhage. Synthesis of albumin is reduced in liver disease, malnutrition, defective
digestion or malabsorption, and increased catabolism of proteins in the liver. Albu-
min levels generally parallel total protein levels, except when total protein changes
due to gamma globulins.
10.13 Precautions
1. pH of BCG solution should be carefully adjusted and should be exactly
4.1 0.05.
2. Reading should be taken immediately after adding BCG solution to avoid
interference of globulin.
48 10 To Estimate the Amount of Total Protein and Albumin in Serum and to Find. . .
61.
To Perform QualitativeTest for Reducing
Substances in Urine 11
11.1 Theory
Sugars may be called as reducing or nonreducing based on their ability to reduce
copper during the Benedict’s test. The reducing property of sugar is based on the
presence of free aldehyde or ketone group in them. Most of monosaccharides and
disaccharides are reducing sugars, while sucrose is nonreducing sugar. Reducing
sugars are capable of reducing Cu2+
(cupric ions) to Cu+
(cuprous ions) in alkaline
medium which produces red precipitate of cuprous oxide or yellow precipitate of
cuprous hydroxide. The free carbonyl carbon of aldehyde or keto sugars shows the
reducing property. The urine of normal individuals contains small amount of
reducing substances which are not sufficient to give positive test with Benedict’s
test or Fehling’s test. Various reducing sugars present in the urine are glucose,
galactose, fructose, and lactose.
11.2 Qualitative Test for Reducing Sugars
11.2.1 Benedict’s Test
Principle
Benedict’s qualitative reagent contains Cu2+
ions complexed with citrate in alkaline
medium. The free aldehyde or keto group of the reducing carbohydrates reduces
cupric ions to cuprous ion with the resultant formation of yellow or red precipitates
of cuprous oxide. Sodium citrate prevents the spontaneous reduction of CuSO4
while Na2CO3 is used to provide alkaline medium.
# Springer Nature Singapore Pte Ltd. 2018
V. Kumar, K. D. Gill, Basic Concepts in Clinical Biochemistry: A Practical Guide,
https://doi.org/10.1007/978-981-10-8186-6_11
49
62.
CuSO4
Blue
þ2H2O !
sugar
Cu OH
ðÞ2
white
þH2SO4
2Cu OH
ð Þ2 !
heat
Cu2O
Cuprous oxide
redor yellow
ð Þ
þ 2H2O þ O
11.2.2 Benedict’s Qualitative Reagent
Sol A: Dissolve 17.3 g of sodium citrate and 10 g of Na2CO3 in about 60 ml of
distilled water with the aid of heat.
Sol B: Dissolve 1.73 g of CuSO4 in 10 ml of distilled water.
Solution B is added to solution A gently with constant mixing, and final volume is
made up to 100 ml with distilled water.
11.2.3 Procedure
Take 5 ml Benedict’s reagent in a test tube and add 0.5 ml or eight drops of urine.
Mix and heat it to boil for 3–5 min and allow cooling. Observe the color, and report
the result on the basis of color produced as given in table below.
S. no Approximate amount of sugar Appearance of color change Result
1 Nil Blue Nil
2 Traces Bluish green +
3 0.5 g/dl Green precipitate +
4 1 g/dl Yellow precipitate ++
5 1.5 g/dl Brown precipitate +++
6 2 g/dl Brick red precipitate ++++
Sensitivity of the test is 0.1–1.5% toward false-positive results obtained from
other reducing substances such as lactose, galactose, fructose, xylose, etc. Specific
tests are performed to rule out the possibility of presence of these sugars. Normal
constituents such as uric acid, creatinine, and ascorbic acid in higher amount also
give false-positive result.
11.3 CLINISTIX/Uristix
CLINISTIX are commercially available strips. These are impregnated with glucose
oxidase (GOD), peroxidase (POD), and dye O-toluidine (chromogen). In this reac-
tion, glucose is oxidized to gluconic acid and H2O2 by the enzyme GOD. H2O2
formed is split into water and nascent oxygen by POD enzyme. This nascent oxygen
50 11 To Perform Qualitative Test for Reducing Substances in Urine
63.
reacts with thechromogen to form a colored product. Sensitivity of the test is
0.01–1 g/dl.
Glucose !
GOD
Gluconic acid þ H2O2
H2O2 !
POD
H2O þ ½O
½O þ o toluidine ! coloured complex
11.3.1 Procedure
Strip is dipped in urine sample for 10 sec and color is observed after 30 min.
Compare the color formed with the chart provided.
11.4 Precautions
1. The container used for urine collection should be clean and free from
contaminants, particularly disinfectants and detergents containing oxidizing
substances such as peroxides.
2. Do not touch the test area of the strip.
11.5 Clinical Significance
Reducing sugars are found only in very small amounts in the urine of normal
persons, usually less than 100 mg/day. Amount of sugars increases under some
pathological conditions that can be detected by various tests.
1. Glucose: Glucose is the reducing sugar found in urine which is pathologically
significant. Normally less than 100 mg of glucose (sugar) is excreted per day.
Glucose is present in urine whenever blood glucose rises above the renal thresh-
old, i.e., 180 mg/dl blood. Excretion of glucose in urine is called glycosuria.
Glycosuria is found in all conditions in which glucose tolerance is diminished.
Persistent glycosuria may indicate diabetes mellitus. In diabetes mellitus, 5–6%
glucose is excreted through urine of patient with endocrine hyperactivity. Severe
liver disease and whole organ disease of the pancreas may also be accompanied
by some glycosuria.
2. Lactose: It is found in the urine of lactating woman and toward the later stage of
pregnancy.
3. Galactose: It is present in urine very rarely. It occurs occasionally in lactation.
Galactosuria occurs in infants in recessive inherited disorder and is due to an
inability to metabolize galactose derived from lactose in the milk.
11.5 Clinical Significance 51
64.
4. Fructose: Itmay be found in urine after taking food rich in fructose (fruits, honey,
syrup, and jams). It may be found in liver disease and in the urine of diabetics
along with glucose.
Apart from these sugars, pentoses, glucuronides, and homogentisic acid are also
present under some pathological conditions which can also reduce Benedict’s
reagent. Higher concentration of uric acid and creatinine also reduce Benedict’s
qualitative reagent.
52 11 To Perform Qualitative Test for Reducing Substances in Urine
65.
Quantitative Analysis ofReducing Sugars
in Urine 12
12.1 Theory
Examination of urine for glucose is rapid and inexpensive and can be used to screen
large number of samples. The screening test detects sugars that reduce copper and
produce different shades of colors. Substances other than glucose also reduce CuSO4
and produce positive result. Quantitative test estimates the amount of reducing
substances present in urine. This amount is sufficiently small to be detected posi-
tively with qualitative methods of glucose determination. The condition
characterized by excretion of glucose in urine is called glycosuria. The commonly
used quantitative test for urinary sugars is titration based Benedict’s test. This
method is not specific for glucose and measures all the reducing sugars present in
urine sample.
12.2 Specimen Requirement
In quantitative analysis, 24 h urine specimen is used and is preserved by adding 5 ml
glacial acetic acid (to inhibit the bacterial growth) to the container before starting the
collection. Urine should be stored at 4
C during collection.
12.3 Principle
Glucose or any other reducing carbohydrate reduces Benedict’s quantitative reagent
to a white precipitate of cuprous thiocyanate (instead of usual reddish brown cuprous
oxide). Besides the usual ingredient of Benedict’s qualitative reagent, quantitative
reagent contains potassium thiocyanate and potassium ferrocyanide. The disappear-
ance of the blue color and appearance of white precipitate indicates complete
reduction of copper, which is much easier to detect. Potassium ferrocyanide prevents
# Springer Nature Singapore Pte Ltd. 2018
V. Kumar, K. D. Gill, Basic Concepts in Clinical Biochemistry: A Practical Guide,
https://doi.org/10.1007/978-981-10-8186-6_12
53
66.
the precipitation ofcuprous oxide and keeps the cuprous ions in solution. Na2CO3
prevents destruction of sugar by providing the supply of OH ions.
12.4 Reaction
Potassium thiocyanate þ Cu2þ
blue
ð Þ
! cuprous thiocynate
white ppt
ð Þ
Addition of Na2CO3 also helps to visualize end point, which is the disappearance
of blue color.
12.5 Reagents
1. Benedict’s quantitative reagents:
Sol. A: Dissolve 20 g of sodium citrate, 7.5 g of Na2CO3, and 1.25 g of potassium
thiocyanate in about 60 ml warm water, and cool the solution.
Sol. B: Dissolve 1.8 g of CuSO4 in 10 ml of distilled water.
Add solution B to solution A gently with constant mixing. To the resultant solution,
add 5% aqueous solution of potassium ferrocyanide. Make the final volume to 1 litre
with distilled water.
2. Na2CO3 anhydrous salt
12.6 Procedure
1. Pipette out 25 ml of Benedict’s quantitative reagent in 100 ml conical flask. To
this add 3–4 g of Na2CO3.
2. Add few glass beads to reduce bumping and bring to a boil.
3. While still in boiling condition, add urine slowly dropwise using the burette, and
mix the contents by shaking.
4. Add the urine until the blue color changes to white.
5. Note the volume of urine used. Repeat the titration to get concordant values.
12.7 Precautions
1. Add marbles or glass beads to avoid bumping.
2. Sample should be added to boiling reagent slowly with constant shaking.
54 12 Quantitative Analysis of Reducing Sugars in Urine
67.
3. If theurine sample used is less than 2 ml for the titration, dilute urine 1 in 5 or 1 in
10 with distilled water and include the dilution factor in the calculation, after
doing a rough titration.
4. A greenish-blue color will reappear if flask is allowed to stand. This is reoxidation
process of air and may be ignored.
12.8 Calculation
50 mg of glucose will reduce 25 ml of Benedict’s quantitative reagent. Suppose titer
of urine is 10 ml, then 10 ml urine must contain 0.05 g glucose and then amount of
glucose/100 ml urine
¼
50 100
10
¼ xmg=dl
12.9 Clinical Significance
The clinical significance of glycosuria has been discussed in previous chapter.
12.9 Clinical Significance 55
68.
Estimation of BloodGlucose Levels by
Glucose Oxidase Method 13
13.1 Theory
The sugar glucose is an aldohexose and is the most important carbohydrate present
in our body. The bulk of dietary carbohydrate is absorbed mainly as glucose in the
intestine. Glucose is the major source of energy for all the tissues including the brain.
It enters the cell through the influence of insulin and undergoes a series of chemical
reactions to produce energy. It acts as precursor for the synthesis of all other
carbohydrates in the body which have highly specific functions, e.g., glycogen for
storage, ribose in nucleic acid, and galactose in lactose of milk. High levels of
glucose are observed in diabetes mellitus, while decrease in glucose levels occurs in
starvation and hyperinsulinemia.
13.2 Principle
The enzyme GOD oxidizes the plasma glucose to gluconic acid with the
liberation of H2O2, which is converted to water and oxygen by the enzyme POD.
4-aminoantipyrine, an oxygen acceptor, takes up the oxygen and
together with phenol forms a pink-colored product which can be measured at
520 nm.
Glucose !
GOD
Gluconic acid þ H2O2
H2O2 !
POD
H2O þ O
½
O
½ þ 4-aminoantipyrine þ Phenol ! Chromogen coloured
ð Þ
# Springer Nature Singapore Pte Ltd. 2018
V. Kumar, K. D. Gill, Basic Concepts in Clinical Biochemistry: A Practical Guide,
https://doi.org/10.1007/978-981-10-8186-6_13
57
69.
13.3 Specimen Requirements
Plasmais the preferred sample for glucose estimation. Separate plasma from cells
rapidly to avoid glucose loss. It is stable for 8 h at 25
C and 72 h at 4
C. Preserve
plasma with sodium fluoride. Whole blood may also be used, but whole blood levels
are 90% of total plasma glucose.
13.4 Reagents
1. Phosphate buffer: Prepare 0.1 M potassium phosphate buffer of pH 7.0.
2. Enzyme reagent: Dissolve 18 mg of 4-aminoantipyrine and 36 mg solid phenol
in 100 ml of 0.1 M phosphate buffer. Add GOD (1500 U) and POD (100 U). Store
in brown bottle at 4
C.
3. Stock glucose solution (100 mg/dl): Dissolve 100 mg glucose in 100 ml distilled
water.
4. Working glucose standard: Prepare glucose standards of concentration 25, 50,
75, and 100 mg/dl.
13.5 Procedure
1. Take a set of test tubes in duplicates and label as B, S1, S2, S3, S4, S5, and T.
2. Add 1.8 ml phosphate buffer and 1 ml enzyme reagent to all the test tubes. In
blank add 1.9 ml phosphate buffer and 1 ml enzyme reagent.
3. Add 0.1 ml of standard of concentration 10, 25, 50, 75, and 100 mg/dl to the tubes
labelled as S1, S2, S3, S4, and S5, respectively. Add 0.1 ml of serum sample in
tube T.
4. Mixed the content of the tubes thoroughly and place them at room temperature for
15 min.
Reagents Blank S1 S2 S3 S4 S5 T
Phosphate buffer (ml) 1.9 1.8 1.8 1.8 1.8 1.8 1.8
Enzyme reagent 1.0 1.0 1.0 1.0 1.0 1.0 1.0
Glucose standard (ml) – 0.1 0.1 0.1 0.1 0.1 –
Glucose concentration (mg/dl) – 10 25 50 75 100 –
Glucose amount (mg) 0.01 0.25 0.5 0.75 1.0
Serum/plasma (ml) – – – – – – 0.1
Mix well and keep at room temperature for 15 min and take OD at 520 nm
58 13 Estimation of Blood Glucose Levels by Glucose Oxidase Method
70.
13.6 Calculations
Plot agraph between amount of glucose at x-axis and absorbance at y-axis. Extrap-
olate glucose amount from the given sample from the graph. The glucose concentra-
tion in serum sample can also be calculated by using the following equation:
Plasma glucose ¼
ODof test amount of standard mg
ð Þ 100
ODof standard volume of sample ml
ð Þ
¼ xmg=dl
13.7 Clinical Significance
Normal range of blood glucose is 70–110 mg/dl. Increase in blood glucose in disease
conditions causes hyperglycemia, and decrease in blood glucose causes hypoglyce-
mia. Hyperglycemia is associated with diabetes mellitus and hyperactivity of thy-
roid, pituitary, and adrenal glands. A moderate hyperglycemia may also be found in
some intracranial disease such as meningitis, encephalitis, tumors, and hemorrhage.
Depending upon the type, degree, and duration of the anesthesia, quite a consider-
able rise in blood glucose may occur, sometimes to over 200 mg/dl, thus producing a
temporary glycosuria. The glucose concentration in fasting samples of 150–200 mg/
dl is very suggestive of diabetes mellitus, and over 200 mg/dl is almost diagnostic.
For fasting samples, a 6–8 h fast is required. Hyperglycemia is also observed in
pancreatitis and carcinoma of pancreas where increase in fasting blood sugar may
occur but except in advanced cases; levels are moderate and does not exceed 150 mg/
dl.
Hypoglycemia occurs most frequently as a result of overdosage with insulin in
the treatment of diabetes. Insulin secreting tumors of pancreas produce severe
hypoglycemia. The fasting blood glucose may be reduced in hypothyroidism (myx-
edema, cretinism) and hypoadrenalism (Addison’s disease), and starvation and
severe exercise may produce hypoglycemia. Increased glycogen storage in the
liver may cause hypoglycemia due to deficiency of an enzyme involved in the
breakdown of glycogen to glucose. Impaired absorption of glucose from intestine
in some type of steatorrhea also causes hypoglycemia, while alcohol ingestion also
causes hypoglycemia, due to increased oxidation of ethanol by forming more NADH
and reducing the available NAD+
(Fig. 13.1).
13.7 Clinical Significance 59
71.
Fig. 13.1 (a)Glucose reabsorption in normal conditions and (b) glucose excretion in diabetes
60 13 Estimation of Blood Glucose Levels by Glucose Oxidase Method
72.
To Determine theBlood Glucose Levels by
Folin and Wu Method 14
14.1 Principle
The test is based on reducing property of glucose in hot alkaline solution. Proteins
are precipitated by tungstic acid and removed by centrifugation. Protein-free filtrate
of plasma contains glucose that reduces cupric ions of alkaline CuSO4 to cuprous
oxide, which in turn reduces phosphomolybdic acid to molybdenum blue, and color
thus produced is measured colorimetrically at 430 nm.
14.2 Reagents
1. N/12 H2SO4 acid: 0.25 ml conc. H2SO4 is diluted to 100 ml with distilled water.
2. Sodium tungstate (10%): Dissolve 1 g sodium tungstate in distilled water to
make final volume of 10 ml.
3. Alkaline copper sulfate reagent
Sol. A – Dissolve 0.9 g of CuSO4.5H2O in 50 ml of distilled water.
Sol. B – Dissolve 0.8 g of Na2CO3 and 0.15 g of tartaric acid in 50 ml distilled
water. Mix solution A and B in equal volume to form solution of alkaline
CuSO4.
4. Phosphomolybdic acid: Dissolve 3.5 g of phosphomolybdic acid and 0.5 g of
sodium tungstate and 2.0 g of NaOH in about 20 ml of distilled water. Boil for
30–40 min for removal of ammonia. Cool and add slowly 1.25 ml of phosphoric
acid (H3PO4) with constant stirring, and make the final volume to 50 ml with
distilled water.
5. Glucose standard stock solution (500 mg/dl): Dissolve 500 mg of glucose in
saturated benzoic acid solution (0.2%) and make up to 100 ml with it.
6. Working glucose standards: Prepare 25, 50, 75, 100, 200, 400, and 500 mg %
glucose solutions by diluting the stock glucose standard with saturated
benzoic acid.
# Springer Nature Singapore Pte Ltd. 2018
V. Kumar, K. D. Gill, Basic Concepts in Clinical Biochemistry: A Practical Guide,
https://doi.org/10.1007/978-981-10-8186-6_14
61
73.
14.3 Procedure
Take ninetest tubes in duplicate, and label them as blank, S1 S7 (standard) and T
(test). Add standard glucose solution of 25, 50, 75, 100, 200, 300, and 500 mg % in
test tubes S1 S7, respectively. Then add reagents according to protocol given in the
table. Read absorbance at 430 nm.
Reagents Blank S1 S2 S3 S4 S5 S6 S7 T
N/12 H2SO4 (ml) 1.6 1.6 1.6 1.6 1.6 1.6 1.6 1.6 1.6
Glucose standard (ml) – 0.2 0.2 0.2 0.2 0.2 0.2 0.2 –
Glucose concentration
(mg/dl)
– 25 50 75 100 200 300 500 –
Glucose amount (mg) – 0.025 0.05 0.075 0.1 0.2 0.3 0.5
Distilled water (ml) 0.2 – – – – – – – –
Serum/plasma (ml) – – – – – – – – 0.2
Sodium tungstate (ml) 0.2 0.2 0.2 0.2 0.2 0.2 0.2 0.2 0.2
Mix well and wait for 10 min, and then centrifuge at 3000 rpm for 10 min. Collect supernatant
Supernatant (ml) 0.5 0.5 0.5 0.5 0.5 0.5 0.5 0.5 0.5
Alkaline CuSO4 (ml) 1.0 1.0 1.0 1.0 1.0 1.0 1.0 1.0 1.0
Mix well and keep in boiling water bath for 10 min and cool
Phosphomolybdate (ml) 1.0 1.0 1.0 1.0 1.0 1.0 1.0 1.0 1.0
Shake well to remove CO2 completely
Distilled water (ml) 2.5 2.5 2.5 2.5 2.5 2.5 2.5 2.5 2.5
14.4 Calculations
Plot a graph between amount of glucose at x-axis and absorbance at y-axis. Extrap-
olate glucose amount in the given sample from the graph or calculate using equation
as explained in previous experiment.
62 14 To Determine the Blood Glucose Levels by Folin and Wu Method
74.
To Perform GlucoseTolerance Test
15
The ability of a person to metabolize a given glucose is called glucose tolerance. To
assess carbohydrate metabolism status, an oral glucose test is employed. Glucose
tolerance test (GTT) is highly useful to confirm diabetes mellitus.
15.1 Method of Carrying GTT
The test is usually carried out in the morning. Patient should be on 8–12 h fasting
before undergoing test and should not eat during test. Patient is given glucose
solution (75 g) and is asked to drink it within 15 min. For children 1.75 g glucose/
kg body weight is given. Blood for estimation of glucose is taken at half-hourly
intervals for 2.5 h after the glucose intake. Fasting and every half-hourly urine
specimens are also collected from the patient (six urine samples). Blood glucose
concentration is estimated by GOD method. Urine sugar is detected by Benedict’s
qualitative test.
15.2 Specimen Requirements
Serum/plasma sample is used. For oral GTT, draw fasting sample and then at 30, 60,
90, and 120 min after glucose intake. In case of pregnancy, draw samples at fasting
and at 60, 120, and 180 min after glucose intake.
# Springer Nature Singapore Pte Ltd. 2018
V. Kumar, K. D. Gill, Basic Concepts in Clinical Biochemistry: A Practical Guide,
https://doi.org/10.1007/978-981-10-8186-6_15
63
75.
15.3 Principle
The estimationof plasma glucose is based on the principle as explained for glucose
measurement by glucose oxidase method.
15.4 Reagents
1. Phosphate buffer (0.1 M, pH 7.0).
2. Enzyme reagent: Prepare as explained in previous experiment.
3. Stock glucose solution (500 mg/dl): Dissolve 500 mg glucose in 100 ml distilled
water.
4. Working glucose standard: Prepare glucose standards of concentration 50, 100,
150, 200, and 250 mg/dl.
15.5 Procedure
1. Take set of 11 test tubes in duplicate and label as blank, standard (S1–S5), and test
samples (T1–T5).
2. Add 1.8 ml phosphate buffer to all the test tubes. In blank add 1.9 ml phosphate
buffer.
3. Add 1 ml enzyme reagent to all the test tubes.
4. Add 0.1 ml of standards of concentration 50, 100, 150, 200, and 250 mg/dl to the
tubes labelled as S1–S5, respectively.
5. Add 0.1 ml of serum sample to test tubes (T1–T5). Mix the content of the tubes
thoroughly, and place them in a water bath at 37
C for 5 min or at room
temperature for 15 min.
6. Measure the OD of the test and the standards against blank at 520 nm.
64 15 To Perform Glucose Tolerance Test
15.6 Calculations
Plot agraph between amount of glucose at x-axis and absorbance at y-axis. Extrap-
olate glucose amount of the given sample from the graph or calculate using the
equation below:
Plasma glucose ¼
ODof test amount of standard mg
ð Þ 100
ODof standard volume of sample ml
ð Þ
¼ xmg=dl
15.7 Clinical Significance
In normal persons, the fasting blood glucose level is within 70–110 mg/dl. Follow-
ing oral intake of glucose, the level rises and reaches at peak within 1 h and then
come to normal fasting levels within 1.5–2 h because of insulin secretion and
utilization and storage of glucose. After 2 h it should be below 120 mg/dl. There
should be a negative test for glucose in all urine samples. In diabetes mellitus, the
glucose tolerance is decreased. The glucose level increases to much higher levels
after 1 h of glucose intake and does not reach normal level even after 2 h due to low
insulin level or decreased cellular response toward insulin. In impaired glucose
tolerance, the blood sugar values are below diabetic level but above normal
(Fig. 15.1). In renal glycosuria, the glucose tolerance is normal; however glucose
will appear in urine.
Fig. 15.1 Glucose tolerance test curve
66 15 To Perform Glucose Tolerance Test
78.
Estimation of Ureain Serum and Urine
16
16.1 Theory
Urea is the major nitrogen-containing metabolite product of protein catabolism in
humans, accounting for more than 75% of the nonprotein nitrogen eventually
excreted. The biosynthesis of urea is carried out by hepatic enzymes of urea cycle.
It is formed in the liver from carbon dioxide and ammonia, passes into the extracel-
lular fluid, and is excreted almost entirely by the kidneys. The measurement of urea
is an important investigation in diagnosing kidney damage. Urea is released into the
blood which is then cleared by kidneys. The normal range of blood urea is
15–40 mg/dl. It is higher in men than women and more in adults than young. The
urea content over periods is influenced by the amount of protein in the diet and tends
to be lower in people on low protein diet. On an ordinary diet, urea nitrogen forms
about 80–90% of the total urine nitrogen, but on low protein diet, it falls toward
60%. The total daily excretion of urea is about 30–40 g. Increased urea production
occurs on high protein diets or after gastrointestinal hemorrhage and when there is
increased tissue breakdown as observed in starvation, trauma, and inflammation. The
capacity of the normal kidney to excrete urea is high, and in the presence of normal
renal functions, urea levels rarely rise above normal despite increased production. A
plasma urea concentration above 15 mmol/L almost certainly indicates renal
impairment. The plasma urea is the most useful test of “renal excretory function,”
as it correlates well with the clinical consequences of retained metabolic products
(uremia) in renal insufficiency.
16.2 Specimen Requirements
Serum/plasma or 24 h urine sample with preservative is used. Avoid high concen-
tration of sodium fluoride during enzymatic estimation in serum. Serum sample is
stable up to 24 h at room temperature and for several days at 4
C. Dilute serum
(1:20) and urine samples (1: 1000) before use.
# Springer Nature Singapore Pte Ltd. 2018
V. Kumar, K. D. Gill, Basic Concepts in Clinical Biochemistry: A Practical Guide,
https://doi.org/10.1007/978-981-10-8186-6_16
67
79.
16.3 Principle
Urea reactsdirectly with diacetyl monoxime under strong acidic conditions to give a
yellow-colored condensation product. Firstly, diacetyl is released from diacetyl
monoxime, and then urea reacts with diacetyl in hot acidic medium to give diazine
complex. Diazine is stabilized as pink-colored compound by thiosemicarbazide and
ferric ions. The acid reagent of H3PO4 and H2SO4 acid is used to provide acidic
medium for these reactions, and final pink product has absorption maximum at
520 nm in proportion to amount of urea.
CH3
C=O
O
H+
Fe3+
O
Water
Thiosemicarbazide
Heat
Diazine
(yellow)
O
O
N Heat
Diacetyl monoxime
Diacetyl
Pink-red coloured
product
Diacetyl
OH
O
O
C
+ +
C
C N
N
C
C
C
C
C
C
CH3
H2
N
H2
N
CH3
CH3
2H2O
CH3
CH3
CH3
CH3
Urea
16.4 Reagents
1. Acid reagent
Sol. A – Dissolve 0.5 g of ferric chloride (FeCl3) in 2 ml of distilled water. Add
10 ml H3PO4 acid to it. Then mix and make final volume to 25 ml with
distilled water. Store at room temperature in a brown bottle.
Sol. B – Prepare 20% aqueous solution of H2SO4. Then mix 0.25 ml of solution A
with 500 ml of solution B to prepare acid reagent.
2. Color reagent
Sol. A – Prepare 2% diacetyl monoxime solution in distilled water.
Sol. B – Prepare 0.5% thiosemicarbazide solution in distilled water.
68 16 Estimation of Urea in Serum and Urine
80.
Mix 35 mlof solution A with 35 ml of solution B, and make up to 500 ml with
distilled water. Store in a brown bottle at room temperature.
3. Stock urea standard: Prepare 100 mg/dl urea solution in distilled water.
4. Working standard: Prepare 2.5 mg/dl working solution.
16.5 Procedure
1. Take a set of nine test tubes and label as blank, standard (S1–S6), test for serum
sample (Ts), and test for urine sample (Tu).
2. Add 0.1, 0.2, 0.4, 0.6, 0.8, and 1.0 ml of working urea standard into the tubes
labeled as S1 to S6, respectively, and make the final volume 2 ml with distilled
water.
3. In Ts add 0.2 ml diluted serum sample (1:10) and 0.4 ml of diluted urine sample
(1:100) to the tube marked as TU, and make the volume of each tube to 2 ml with
distilled water.
4. Add 2 ml of distilled water in blank tube, and then add 2 ml each of acid reagent
and color reagent to all tubes.
5. Mix well and incubate all the tubes in boiling water bath for 20
C and cool.
6. Measure the absorbance at 520 nm in a spectrophotometer.
Reagents Blank S1 S2 S3 S4 S5 S6 TS TU
Working urea
(ml)
– 0.1 0.2 0.4 0.6 0.8 1.0 – –
Amount of urea
(mg)
– 0.0025 0.005 0.010 0.015 0.020 0.025
Serum/urine
(ml)
– – – – – – – 0.2 0.4
Distilled water
(ml)
2 1.9 1.8 1.6 1.4 1.2 1 1.8 1.6
Acid reagent
(ml)
2 2 2 2 2 2 2 2 2
Color reagent
(ml)
2 2 2 2 2 2 2 2 2
Mix well and keep in boiling water bath for 20 min, and cool and read absorbance at 520 nm
16.6 Calculations
Plot a graph between amount of urea at x-axis and absorbance at y-axis. Then
extrapolate amount of urea from the given serum/urine sample from the graph
(include dilution factor for calculation). The urea concentration can also be calcu-
lated by using the following equation:
16.6 Calculations 69
81.
Amount of ureain blood
¼
ODof test amount of standard mg
ð Þ 100 dilution factor
ODof standard volume of sample ml
ð Þ 1000
¼ xg=dl
Amount of urea in urine
¼
OD of test amount of standard ðmgÞ 1000 dilution factor
OD of standard volume of sample ðmlÞ 1000
¼ x g=L
16.7 Clinical Significance
The normal range of blood urea is 15–40 mg/dl, and urinary excretion is 15–40 g/
day. Increase in blood urea is called uremia, and it occurs in wide variety of diseases.
Uremia is of three types:
Prerenal Uremia It is caused by mild dehydration, high protein catabolism, muscle
wasting as in starvation, reabsorption of blood protein after a gastrointestinal
hemorrhage, treatment with cortisol, and decreased perfusion of kidneys.
Renal Uremia The blood urea is increased in all forms of kidney diseases. In acute
glomerulonephritis values goes up to 300%.
Postrenal Uremia It is caused by conditions such as nephrolithiasis, enlargement
of prostate gland, tumors of the urinary bladder, and stones in ureters. These
conditions obstruct the urine outflow through ureters, bladder, or urethra.
Decrease in blood urea is rare. It has been reported in some cases of severe
diseases, e.g., viral hepatitis with extensive necrosis. Levels also decrease in low
protein diet intake. In pregnancy, blood urea level is lower (15–20 mg/dl).
70 16 Estimation of Urea in Serum and Urine
82.
To Determine UreaClearance
17
17.1 Theory
To assess the kidney functions, clearance of some of the substances from the kidneys
is measured. The clearance of substances that are filtered exclusively or predomi-
nantly by the glomeruli but neither reabsorbed nor secreted by other regions of the
nephron can be used to measure glomerular filtration rate (GFR). The concept of
urea clearance was introduced by Van Slyke and his coworkers in 1928. Urea
clearance (C) is defined as volume of blood or plasma completely cleared of urea/
min by the kidneys and can be expressed mathematically as
C ¼ UV=P
U ¼ concentration of urea in urine/dl
P ¼ concentration of urea in plasma/dl
V ¼ volume of urine excreted/min
17.2 Maximum Urea Clearance
If the volume of urine excreted/min is more than 2 ml/min, maximum urea clearance
is calculated, and the observed maximum clearance can be compared with the
average normal value of 75 ml/min.
Maximum urea clearance ð%average normalÞ ¼
observed clearance 100
75
¼ 1:33 UV=P
# Springer Nature Singapore Pte Ltd. 2018
V. Kumar, K. D. Gill, Basic Concepts in Clinical Biochemistry: A Practical Guide,
https://doi.org/10.1007/978-981-10-8186-6_17
71
83.
17.3 Standard UreaClearance
If the volume of urine excreted/min is less than 2 ml/min, standard urea clearance is
calculated by comparing the observed clearance after adjustment for “U” with a
standard of 54 ml/min, the average normal urea clearance.
Standard urea clearance %average normal
ð Þ ¼
observed clearance 100
54
For any value of “U,” the urea clearance is finally expressed as % of average
normal value.
17.4 Procedure
Urea clearance can be carried either from 24 h urine specimen or timed urine
specimen. 24 h urine specimen is collected in a bottle containing a preservative
(10 ml of 6 N HCl). In between the 24 h period, collect a blood sample also for
estimation of urea in plasma. After the collection of 24 h urine specimen, measure
the volume of urine to calculate volume of urine excreted/min.
If timed urine specimen is to be used, give a cupful (200–400 ml) water to drink,
and ask the patient to empty the bladder and note the time. Exactly after 1 h, collect
the first urine specimen, and mark it as urine sample “1”. After 5 min of collection of
urine sample, collect a blood sample for urea estimation. Exactly after 2 h of intake
of water, ask the patient to empty the bladder completely, and mark that specimen as
urine sample “2”. Measure the volume of both the urine samples, and estimate the
concentration of urea in plasma and both the urine samples. Then calculate standard
or maximum urea clearance from both the urine samples according to the volume of
urine excreted/min.
17.5 Precautions
1. Collect exactly 24 h urine sample, and note the volume accurately.
2. Use urine preservative for the collection of 24 h urine specimen.
3. If timed urine specimen is collected, we can check the reliability of urine
collection. The differences between the 1st and 2nd hourly specimens should
not exceed 10%.
17.6 Clinical Significance
There is wide range of urea clearance in normal persons. Normal maximum clear-
ance varies from 60 to 95 ml/min, with an average of 75 ml/min. The normal
standard urea clearance varies from 40 to 65 ml/min with an average of 54 ml/min.
72 17 To Determine Urea Clearance
84.
Low-protein diet maygive low clearance values. In prerenal uremia, there is fall
in urea clearance. Increase in renal failure decreases clearance value. The clearance
may fall to 50% of normal, while plasma urea will be within normal range. With
further reduction in clearance, plasma urea levels rise. With more severe renal
failure, the clearance may be less than 20% of normal.
17.6 Clinical Significance 73
85.
To Estimate CreatinineLevel in Serum
and Urine by Jaffe’s Reaction 18
18.1 Theory
Creatinine is a waste product derived from dehydration of creatine and is excreted by
the kidneys. It is synthesized in the kidneys, liver, and pancreas from three amino
acids –arginine, glycine, and methionine – by two enzyme-mediated reactions. After
synthesis, creatine is transported in the blood to other organs such as the muscle and
brain and phosphorylated to phosphocreatine which is a high-energy compound.
Some of the free creatine in the muscle is spontaneously converted to creatinine
(anhydride of creatine). Creatine and creatine phosphate constitute about 400 mg/
100 mg of fresh muscle. Both compounds are converted spontaneously to creatinine
at rate of 1–2% (Fig. 18.1).
18.2 Specimen Requirements
Serum or plasma (fluoride or heparin) is stable for 24 h if refrigerated.
Urine: Collect 24 h urine sample. The urine should be kept in cool place (stable up
to 4 days if refrigerated). Dilute urine sample 1:10 before use.
# Springer Nature Singapore Pte Ltd. 2018
V. Kumar, K. D. Gill, Basic Concepts in Clinical Biochemistry: A Practical Guide,
https://doi.org/10.1007/978-981-10-8186-6_18
75
86.
18.3 Principle
Creatinine presentin serum directly reacts with alkaline picrate resulting in the
formation of a red-colored tautomer of creatinine picrate, the intensity of which is
measured at 520 nm. The color produced by creatinine fades after acidifying with
0.25 ml of 0.1 N H2SO4 but remains if produced by non-specific chromogens.
NO2
HO
NH
HN N
O
O
O
H
H
H
H
HC
NH
H
O C
C
N
N+
N
N+
N
H
NH
N
O
Creatinine
Picric acid
NO2
NO2
NO2 NO2
CH3
NO2
CH3
NO2
CH3
O
Creatinine-Picrate adduct
O
C
O
O
C
HC
δ
δ
= =
Liver pancreas
Creatine
Creatine
BLOOD
MUSCLE
Creatinine
Excretion
2g/day
Creatine
(40%) (60%)
Phosphocreatine
Food intake
Na
K
INSULIN
Na, Cl
Arginine
Glycine
Methionine
Fig. 18.1 Creatinine metabolism
76 18 To Estimate Creatinine Level in Serum and Urine by Jaffe’s Reaction
87.
18.4 Reagents
1. 2/3N H2SO4
2. 10% sodium tungstate: Dissolve 10 g sodium tungstate in final volume of
100 ml distilled water.
3. 0.04 M picric acid: Dissolve 9.3 g pure dried picric acid in water, and make final
volume to 1000 ml.
4. 0.75 N NaOH
5. Stock creatinine standard 100 mg/dl: Dissolve 100 mg of pure creatinine in
100 ml of 0.1 N HCl.
6. Working creatinine standard: Prepare 1 mg/dl solution in distilled water.
18.5 Preparation of Protein-Free Filtrate
For serum add 4 ml of 2/3 N H2SO4 to 0.5 ml of serum, and add 0.5 ml of 10%
sodium tungstate solution. Mix well and keep for 10 min. Centrifuge at 3000 rpm for
5 min. Supernatant is used for the estimation of creatinine.
For urine: dilute urine 1:10 with distilled water. Prepare filtrate as with serum.
18.6 Procedure
1. Take a set of nine test tubes, and label as blank, standard (S1–S6), test for serum
(Ts), and test for urine sample (Tu).
2. Add 0.5 ml, 1 ml, 1.5 ml, 2 ml, 2.5 ml, and 3 ml of working 1 mg/dl creatinine
standard to the tubes labelled as S1 to S6, respectively, and make the volume 3 ml
with distilled water. To blank tube, add 3 ml of distilled water.
3. Add 3 ml of protein-free filtrate of serum and urine samples in respective tubes
followed by 1 ml each of NaOH and picric acid.
Reagents Blank S1 S2 S3 S4 S5 S6 TS TU
Creatinine working standard (ml) – 0.5 1 1.5 2 2.5 3 – –
Creatinine amount (μg) – 5 10 15 20 25 30 – –
Protein-free filtrate of serum/urine
(ml)
– – – – – – – 3 3
Distilled water (ml) 3 2.5 2 1.5 1 0.5 – – –
0.75 N NaOH (ml) 1 1 1 1 1 1 1 1 1
Picric acid (ml) 1 1 1 1 1 1 1 1 1
Mix well and keep for 10 min at room temperature; read absorbance at 520 nm
18.6 Procedure 77
88.
18.7 Calculations
Plot agraph between amount of creatinine at x-axis and absorbance at y-axis.
Extrapolate creatinine concentration of given serum/urine sample from the graph
(include dilution factor for calculation). The creatinine concentration can also be
calculated by using equation:
Amount of creatinine in blood ¼
ODof test amount of standard μg
ð Þ 100
ODof standard volume of sample ml
ð Þ 1000
¼ xmg=dl
Amount of creatinine in urine
¼
OD of test amount of standard μg
ð Þ 1000 dilution factor
OD of standard volume of sample ðmlÞ 1000 1000
¼ x g=L
Note 3 ml of protein-free filtrate is equivalent to 0.3 ml serum/urine sample since
0.5 ml sample was made to 5 ml before preparing protein-free filtrate.
18.8 Clinical Significance
Normal range of creatinine in serum is 0.6–1.5 mg/dl and in urine is 90–150 mg/l of
urine. It increases in renal disease, and creatinine value goes up to 20 mg/dl in
muscular dystrophy and different types of muscular tissue diseases. Serum creatinine
level also increases in fever and starvation. There is considerable muscle wasting in
diabetes mellitus resulting in high creatinine levels. Creatinine levels are also raised
in urinary tract obstruction, due to blockage of creatinine excretion through urine.
Decrease in serum creatinine levels is seen in decreased muscle mass with aging and
in pregnancy.
78 18 To Estimate Creatinine Level in Serum and Urine by Jaffe’s Reaction
89.
To Determine CreatinineClearance
19
19.1 Theory
Creatinine clearance is defined as the volume of plasma from which creatinine is
completely cleared/min by the kidneys. Creatinine clearance (C) is expressed math-
ematically as
C ¼ UV=P
U ¼ Concentration of creatinine in urine/dl
P ¼ Concentration of creatinine in plasma/dl
V ¼ Volume of urine exerted (ml/min)
Creatinine formed during muscular metabolism is eliminated from plasma mainly
by glomerular filtration; thus measurement of creatinine clearance is an approach to
find GFR.
19.2 Specimen Requirement and Procedure
In order to estimate creatinine clearance, a 24 h urine sample is collected. The patient
is asked to void urine at a specified time, which is then discarded. Subsequent urine
samples for the next 24 h are collected during precisely timed intervals (at 4, 12, or
24 h). The final volume is measured and used to calculate value of “V.” Keep
samples refrigerated or on ice during collection and refrigerate until analysis.
Creatinine concentration is then estimated in urine and serum by Jaffe reaction.
# Springer Nature Singapore Pte Ltd. 2018
V. Kumar, K. D. Gill, Basic Concepts in Clinical Biochemistry: A Practical Guide,
https://doi.org/10.1007/978-981-10-8186-6_19
79
90.
19.3 Clinical Significance
Normalrange of creatinine clearance for male is 95–125 ml/min and for female is
85–125 ml/min. Creatinine clearance is a good indicator of GFR as compared to urea
clearance because creatinine is not reabsorbed from the kidney tubules but urea is
reabsorbed from the kidney tubules. The creatinine clearance value is decreased in
case of renal failure/glomerular damage (serum level might be normal) and increased
in case of muscular disorders. Proper hydration of the patient, ensuring a urine flow
of 2 ml/min or more results, is a more precise measure of the GFR. If an average
clearance value of 125 ml/min is taken as 100% clearance, then renal damage may be
assessed as follows:
Up to 70% clearance - Normal
70–50% - Mild renal damage
49–20% - Moderate damage
Below 20% - Severe damage
80 19 To Determine Creatinine Clearance
91.
To Determine theUric Acid Concentration
in Serum and Urine 20
20.1 Theory
Uric acid is the end product of purine metabolism (adenine and guanine) present in
RNA and DNA. Uric acid is 2,6,8-trihydroxypurine and exists in keto and enol
forms. It exists only as the monosodium and disodium salt. In plasma, uric acid is
present as monosodium salt. The pool of uric acid in the body is about 1200 mg, out
of which about half amount undergoes turnover daily, that is, about 600 mg/dl is
formed daily and about the same amount is lost, of which about 75% is exerted
through urine and about 25% destroyed by bacteria in the colon.
N
N
Enol form Keto form
N N
H
N
N
N
H H H
OH
OH
O
O
O
HN
HO
Structure of uric acid
20.2 Specimen Requirements
Serum is stable for 3–5 days at 4
C and for 6 months at 20
C. Do not use oxalate
for phosphotungstate method. For uricase method, do not use EDTA or fluoride. For
urine sample, collect 24 h sample. Do not refrigerate and add NaOH to keep urine
alkaline.
# Springer Nature Singapore Pte Ltd. 2018
V. Kumar, K. D. Gill, Basic Concepts in Clinical Biochemistry: A Practical Guide,
https://doi.org/10.1007/978-981-10-8186-6_20
81
92.
20.3 Principle
Proteins areprecipitated with tungstic acid and are removed by centrifugation.
Protein-free filtrate of serum or urine containing uric acid is oxidized to allantoin
by phosphotungstic acid and is reduced to tungsten blue in alkaline medium. The
blue color thus produced is measured at 700 nm and compared with that of uric acid
standard.
Uric acid þ Phosphotungstic acid þ O2 þ 2H2O ! Allantoin þ CO2
Allantoin !
alkali
reduction
Tungsten blue
20.4 Reagents
1. 10% sodium tungstate aqueous solution.
2. 3/2 N H2SO4
3. Phosphotungstic acid: Dissolve 10 g of sodium tungstate in about 150 ml of
distilled water. Add 8 ml of 85% H3PO4 and put some glass beads. Reflux for
2–3 h. Cool to room temperature and then add 50 ml of distilled water containing
8 g of dissolved lithium sulfate. Mix and make final volume up to 250 ml with
distilled water and store in colored bottle.
4. 7% aqueous solution of Na2CO3.
5. Uric acid standard (20 mg/dl): Dissolve 12 mg of lithium carbonate in warm
water and add 20 mg of uric acid and dissolve by heating. Make volume up to
100 ml with distilled water.
20.5 Procedure
Protein-free filtrate of serum is prepared by adding 0.5 ml serum in a test tube
containing 4 ml of 3/2 N H2SO4 and added with 0.5 ml of 10% sodium tungstate.
Mix well and keep for 5 min and centrifuge at 3000 rpm for 5 min.
Protein-free filtrate of urine is prepared by diluting urine 1:10 with distilled water
and following same process as that of serum. Add uric acid standard in tubes labelled
as (S1–S6) and mix other reagents according to protocol given in table.
Reagents Blank S1 S2 S3 S4 S5 S6 TS TU
Working uric acid
standard (μl)
– 50 100 150 200 250 500 – –
Uric acid amount (μg) -- 10 20 30 40 50 100 – –
Protein-free filtrate of
serum/urine (ml)
– – – – – – – 3 3
Distilled water (ml) 3 2.95 2.90 2.85 2.80 2.75 2.5 – –
(continued)
82 20 To Determine the Uric Acid Concentration in Serum and Urine
93.
Na2CO3 (ml) 11 1 1 1 1 1 1 1
Phosphotungstic acid (ml) 1 1 1 1 1 1 1 1 1
Mix well and keep for 20 min at room temperature, read absorbance at 700 nm
20.6 Calculations
Plot a graph between amount of uric acid at x-axis and absorbance at y-axis and
extrapolate uric acid concentration of given sample from the graph. The uric acid
concentration can also be calculated by using equation:
Uric acid amount in urine ¼
ODof test amount of standard μg
ð Þ 100
ODof standard volume of sample 1000
¼ xmg=dl
Uric acid amount in urine
¼
OD of test amount of standard μg
ð Þ dilution factor 1000
OD of standard volume of sample 1000
¼ x mg=L
Note 3 ml of protein-free filtrate is equivalent to 0.3 ml serum/urine sample since
0.5 ml sample was made to total 5 ml before preparing protein-free filtrate.
20.7 Clinical Significance
Uric acid levels in serum range from 3.5–8 mg/dl in males and 2.0–6.5 mg/dl in
females. Normal uric acid excretion through urine depends upon diet. A purine-rich
diet and severe exercise increase uric acid levels. Estimation of uric acid in serum is
helpful in the diagnosis of several pathological conditions particularly gout where
increased uric acid levels up to 6.5–12 mg/dl is observed. Gout is the most common
disease that increases uric acid levels in serum. It is disease of joints in which uric
acid is deposited as crystals. Increased uric acid in blood is generally accompanied
by increased excretion in urine. Other disease conditions such as renal failure,
leukemia, multiple myeloma, lymphoma, glycogenesis, chronic hemolytic anemia,
and pernicious anemia lymphosarcoma also increase serum uric acid levels. Serum
uric acid levels less than 2 mg/dl cause hypouricemia. It is caused due to severe
hepatocellular disease and defective renal tubular reabsorption of uric acid. Low
values may be also found in Wilson’s disease. Several drugs affect the handling of
urate by the body. Urinary decrease in uric acid levels is observed in xanthinuria,
folic acid deficiency, or lead toxicity.
20.7 Clinical Significance 83
94.
20.8 Precautions
1. Molybdate-freesodium tungstate is used for the preparation of
phosphotungstic acid.
2. Store uric acid standard in refrigerator.
84 20 To Determine the Uric Acid Concentration in Serum and Urine
95.
Estimation of TotalCalcium in Serum
and Urine 21
21.1 Theory
Calcium is the most abundant mineral cation in the body which contains 1–1.5 kg of
total body weight in the adults. Over 99% is present in the bones and teeth. A small
fraction is also present outside the skeletal tissue and performs wide variety of
functions. Calcium is vitally important in maintaining the correct conditions for
normal neuromuscular transmission and glandular secretions and for the activity of
enzyme systems. Most of blood calcium is present in plasma. There is almost no
calcium in red blood cells and other intracellular fluid. About 50% of total plasma
calcium exists in ionized form which is functionally most active. About 40% of
plasma calcium is protein bound, and 10% is complexed with citrate, organic acid, or
bicarbonates. About 90% of protein-bound calcium is associated with albumin, and
the remaining 10% is associated with globulins. Ionized and citrate-bound calcium is
diffusible from blood to the tissues, while protein bound is nondiffusible (Fig. 21.1) .
In the laboratory, all three fractions of calcium are measured together. Calcium binds
to negatively charged sites on proteins which is pH dependent. Alkaline conditions
promote calcium binding and decrease free calcium, whereas acidic conditions
decrease calcium binding and increase free calcium levels.
21.2 Specimen Requirements
Serum/plasma (fasting) sample is required. Take blood with minimal venous occlu-
sion and without exercise. For urine sample, collect 24 h urine in the container
containing 10 ml HCl (6 mol/L) or acidify after collection to pH 2.0 to dissolve
calcium salts.
# Springer Nature Singapore Pte Ltd. 2018
V. Kumar, K. D. Gill, Basic Concepts in Clinical Biochemistry: A Practical Guide,
https://doi.org/10.1007/978-981-10-8186-6_21
85
96.
21.3 Method
Calcium isestimated by O-Cresolphthalien Complexone method.
21.4 Principle
Hydrochloric acid dissociates calcium from protein. Then total calcium reacts with
ortho-cresolphthalein complex to form a purple-colored complex in alkaline
medium. Diethylamine provides the alkaline pH, and 8-hydroxy quinoline prevents
the interference of magnesium ions. The color thus produced is compared with that
of calcium standard.
21.5 Reagents
1. Cresolphthalein reagent: Dissolve 70 mg of ortho-cresolphthalein complexone
in 16.5 ml conc. HCl. Then add 2.5 g 8-hydroxy quinoline, mix and dilute to
1000 ml with distilled water.
2. Diethylamine buffer (3.75% v/v) in distilled water: Mix 3.75 ml diethylamine
in a final volume of 100 ml distilled water.
3. Calcium Standard 4 mg %: Dissolve 10 mg of CaCO3 in 0.1 N HCl and make
volume 100 ml with 0.1 N HCl solution.
21.6 Procedure
1. Take a set of 10 test tubes in duplicate and mark as blank, standard (S1–S8), test
for serum (Ts), and test for urine (TU) sample.
Calcium
Extracellular fluid
(9-11 mg/dl)
Intracellular
Cytoplasmic free
Protein bound
45-50% Diffusible
Ultrafiltrable (50%)
Albumin bound (90%)
Globulin bound (10%)
Ionised
45-50%
Complexed
10%
Fig. 21.1 Distribution of calcium in body fluids
86 21 Estimation of Total Calcium in Serum and Urine
97.
2. Pipette out25, 50, 75, 100, 125, 150, 175, and 200 μl of 4 mg % calcium standard
into the tubes labelled as S1 to S6. Add 50 μl undiluted serum and urine samples
into tubes Ts and TU.
3. Then make the final volume of all the tubes 200 μl by adding distilled water. Add
2 ml cresolphthalein complexone reagent to all the tubes and mix well.
4. Then add 2.5 ml diethylamine buffer to all the tubes, mix well, and measure
absorbance at 575 nm.
Reagents Blank S1 S2 S3 S4 S5 S6 S7 S8 TS TU
Calcium standard
(μl)
– 25 50 75 100 125 150 175 200 – –
Calcium amount
(μg)
– 1 2 3 4 5 6 7 8 – –
Serum/urine (μl) – – – – – – – 50 50
Distilled water
(μl)
200 175 150 125 100 75 50 25 – 150 150
Cresolphthalein
complexone
reagent (ml)
2 2 2 2 2 2 2 2 2 2 2
Diethylamine
buffer (ml)
2.5 2.5 2.5 2.5 2.5 2.5 2.5 2.5 2.5 2.5 2.5
Mix well and measure absorbance at 575 nm
21.7 Calculations
Plot a graph by taking calcium amount at x-axis vs absorbance at y-axis, and
extrapolate calcium concentration of given serum/urine sample from the graph.
The calcium levels in serum and urine can also be calculated by using equation:
In serum ¼
ODof test amount of standard μg
ð Þ 100
ODof standard volume of sample 1000
¼ xmg=dl
In urine ¼
OD of test amount of standard μg
ð Þ 1000
OD of standard volume of sample 1000
¼ x mg=L
21.8 Clinical Significance
The normal value of calcium in serum is 9–11 mg/dl and 100–300 mg/24 h urine.
Extracellular calcium provides calcium ions for maintenance of intracellular cal-
cium, bone mineralization, blood coagulation, and maintenance of plasma
21.8 Clinical Significance 87
98.
membrane potential. Calciumlevels are increased in hyperparathyroidism (determi-
nation of ionized serum calcium is more useful for the diagnosis of hyperparathy-
roidism), parathyroid hormone injection, hypervitaminosis “D,” prolonged intake of
milk and alkali (the milk-alkali syndrome), multiple myeloma, and polycythemia. It
is also increased in acute and chronic renal failure and osteomalacia with malab-
sorption. Hypocalcemia occurs when serum calcium levels fall below 7 mg/dl.
Hypocalcemia is more serious and life-threatening condition than hypercalcemia.
Calcium levels are decreased in hypoparathyroidism, osteomalacia,
hyperphosphatemia, tetany, renal failure, and nephrotic syndrome. In rickets, the
product of serum calcium and phosphorus decreases usually below 30 mg/dl. An
increase in alkaline phosphatase activity is a characteristic feature of rickets. It is
necessary to measure total serum proteins and albumin levels simultaneously for
proper interpretation of serum calcium levels, since 0.8 mg of calcium is bound to
1.0 g of albumin in serum. To correct, add 0.8 mg/dl for every 1 g/dl that serum
albumin falls below 4 g/dl.
88 21 Estimation of Total Calcium in Serum and Urine
99.
Estimation of InorganicPhosphorus
in Serum and Urine 22
22.1 Theory
The body contains about 800 g of phosphorus. Of this, 90% is present in bones, so it
is more widely distributed in the body than calcium. In the soft tissues, phosphorus is
present as organic form and incorporated into macromolecules. Phosphorous is also
present in some proteins, lipids, and nucleic acid and in some coenzymes. Phospho-
rus also plays a role in acid-base regulation of body fluids particularly by the
kidneys. The phosphorus of the blood is of four types:
1. Inorganic phosphorus – the phosphates of alkaline and alkali earth metals, present
as H2PO4 and HPO2
4
2. Organic or ester phosphorus – including glycerophosphates, nucleotide phos-
phate, hexose phosphate, etc.
3. Lipid phosphorus – present in lecithin, cephalin, sphingomyelin
4. Residual phosphorus present in small amounts
Out of four types explained above, it is the inorganic phosphorus present in serum
which is measured. Phosphate in serum exists as both the monovalent and divalent
phosphate anions. The ratio of H2PO
4 and HPO2
4 is pH dependent. About 10% of
phosphate in serum is bound to proteins; 35% is complexed with sodium, calcium,
and magnesium; and the remainder is free. Inorganic phosphate also forms major
component of hydroxyapatite in the bone, thereby playing an important part in
structural support of the body and providing phosphate for the extracellular and
intracellular pool.
# Springer Nature Singapore Pte Ltd. 2018
V. Kumar, K. D. Gill, Basic Concepts in Clinical Biochemistry: A Practical Guide,
https://doi.org/10.1007/978-981-10-8186-6_22
89
100.
22.2 Specimen Requirements
Fastingserum sample is preferred. Avoid hemolysis since blood cell contains high
amount of phosphate (RBCs contain about 40 mg/dl of phosphorus). Sample is
stable for several days at 4
C. For urine collect 24 h samples in acid-washed
detergent-free container, and acidify with HCl after collection. Stable for 6 months.
22.3 Methodology
Phosphorus content is measured by following the method of Fiske and Subbarow.
22.4 Principle
Proteins are precipitated with TCA and are removed by centrifugation. Protein-free
filtrate contains phosphorus that reacts with molybdic acid to form phosphomolybdic
acid. The hexavalent molybdenum of the phosphomolybdic acid is reduced by 1,2,4
amino-naphthol-sulfonic acid (ANSA). The color thus produced is directly propor-
tional to the amount of phosphorous present in the sample.
22.5 Reagents
1. 20% TCA: Dissolve 20 g of TCA in 100 ml distilled water.
2. Ammonium molybdate reagent
Sol. A: 1 N HCl–11.5 ml conc. HCl is diluted to 100 ml with distilled water.
Sol. B: Ammonium molybdate solution – Dissolve 6.25 g of ammonium molyb-
date in water, and make volume to 150 ml with distilled water.
Prepare ammonium molybdate reagent by mixing Sol. A and B with constant
mixing.
3. ANSA reagent: Dissolve 250 mg of ANSA powder in a solution containing
97.5 ml of 15% aqueous solution of sodium bisulfite and 2.5 ml of 20% sodium
sulfite.
4. Phosphorus standard (20 mg %): Dissolve 11.48 mg of Na2HPO4.2H2O in
distilled water to make final volume 100ml.
22.6 Preparation of Protein-Free Filtrates
For Serum Mix 0.5 ml serum with 4.5 ml 20% TCA and allow standing for 10 min
at room temperature. Then centrifuge at 3000 rpm for 5 min and collect supernatant.
90 22 Estimation of Inorganic Phosphorus in Serum and Urine
101.
For Urine Diluteurine 1:10 with distilled water and prepare protein-free filtrate the
same way as for serum.
22.7 Procedure
1. Take a set of nine test tubes, and label them as blank, standard (S1–S6), test for
serum sample (TS), and test for urine sample (TU).
2. Add 10, 20, 40, 60, 80, and 100 μl of 20 mg % phosphorus standard in tubes
labelled as S1 to S6, respectively, and make the final volume 2.5 ml with 20%
TCA. In blank add 2.5 ml of 20% TCA.
3. Add 2.5 ml of protein-free filtrate of serum and urine into the tubes labelled at TS
and TU, respectively.
4. Add 1 ml of ammonium molybdate reagent and 0.2 ml ANSA reagent to all the
tubes and vortex. Keep at room temperature for 20 min and read absorbance at
700 nm.
Reagents Blank S1 S2 S3 S4 S5 S6 TS TU
Phosphorus standard,
20 mg % (μl)
– 10 20 40 60 80 100 – –
Phosphorus amount (μg) – 2 4 8 12 16 20 – –
Protein-free filtrate of
serum/urine (ml)
– – – – – – – 2.5 2.5
20% TCA (ml) 2.5 2.49 2.48 2.46 2.44 2.42 2.40 – –
Ammonium molybdate
(ml)
1 1 1 1 1 1 1 1 1
ANSA (ml) 0.2 0.2 0.2 0.2 0.2 0.2 0.2 0.2 0.2
Mix well and keep for 20 min at room temperature, read absorbance at 700 nm
22.8 Calculations
Plot a graph by taking phosphorus amount at x-axis vs absorbance at y-axis, and
extrapolate its concentration from the given serum/urine sample from the graph. The
amount of phosphorus extrapolated from graph will be in 250 μl of serum/urine
sample since 2.5 ml of protein-free filtrate was used for analysis. The phosphorus
amount can also be calculated in serum and urine samples by using equation:
Phosphorus amount in serum
¼
ODof test amount of standard μg
ð Þ 100
ODof standard volume of sample 0:25ml
ð Þ 1000
¼ xmg=dl
22.8 Calculations 91
102.
Phosphorus amount inurine
¼
OD of test amount of standard μg
ð Þ dilution factor 1000
OD of standard volume of sample 1000∗
1000∗ ¼ x g=L
*To convert μg to gram
22.9 Clinical Significance
Normal value of serum inorganic phosphorus is 3.0–4.5 mg/dl in adults and is
3–5.5 mg/dl in children. Normal range for urine sample is 0.5–1.5 g/24 h. Increase
in an inorganic phosphorus amount is observed in acute and chronic renal failure,
hypoparathyroidism, cell lysis, respiratory acidosis, untreated diabetes, ketoacidosis,
increased phosphate intake, use of phosphate containing laxative and decreased renal
phosphate exertion due to decreased GFR, and increased tubular reabsorption or
acromegaly. The decrease in inorganic phosphorus levels occurs in rickets
(in osteomalacia the phosphorus levels are lower than rickets), lowered renal phos-
phate threshold, decrease in intestinal phosphate absorption due to increased loss in
vomiting, diarrhea, the use of phosphate-binding antacid, vitamin D deficiency, and
in intracellular phosphate loss due to acidosis – ketoacidosis and lactoacidosis.
22.10 Precautions
1. All the glasswares used for the estimation and preparation of reagents should be
dipped in HNO3 (5 N) for 24 h and washed thoroughly in distilled water.
2. Urine should be preserved in acidic conditions by adding 10 ml HCl to 24 h urine
collection. In alkaline condition the phosphates tends to precipitate.
3. Collect blood without hemolysis and separate serum immediately after it is
formed.
92 22 Estimation of Inorganic Phosphorus in Serum and Urine
103.
To Estimate theAmount of Total
Cholesterol in Serum 23
23.1 Theory
Cholesterol is a solid alcohol found exclusively in animals and contains 27 carbon
atoms (C27H46O). It possesses a ring structure called
cyclopentanoperhydrophenanthrene. It is a major component of biological
membranes and lipoproteins and amphipathic in nature. It is a precursor in many
metabolic pathways including synthesis of vitamin D, steroid hormones, and bile
acids. About 400–700 mg of cholesterol present in the gut is contributed by biliary
secretion and the turnover of mucosal cells. The cholesterol present in the intestine is
the unesterified form. This form is solubilized by the formation of mixed micelles
that contain the unesterified cholesterol, fatty acids, monoglycerides, phospholipids,
and conjugated bile acids. Maximum absorption of cholesterol occurs in small
intestine. Once absorbed into the mucosal cells, cholesterol along with triglycerides,
phospholipids, and a number of specific apoproteins is reassembled into a large
micelle called chylomicrons. Chylomicrons enter the lymphatics, which empty into
the thoracic duct and eventually enter the systemic venous circulation. Total choles-
terol contains free cholesterol and esterified cholesterol in the ratio 1:3.
# Springer Nature Singapore Pte Ltd. 2018
V. Kumar, K. D. Gill, Basic Concepts in Clinical Biochemistry: A Practical Guide,
https://doi.org/10.1007/978-981-10-8186-6_23
93
104.
23.2 Specimen Requirements
Serum(fasting) or plasma (EDTA or heparin may be used but not oxalate, fluoride,
or citrate). Serum is stable for 5–7 days at 4
C. Results with EDTA plasma are 3%
lower than serum results.
23.3 Methodology
Cholesterol is estimated by Zak ferric chloride- sulfuric acid method.
23.4 Principle
Ferric chloride in acetic acid precipitates the serum proteins, and the cholesterol
liberated reacts with conc. H2SO4 to make a chromophore (colored complex). The
reaction seems to involve oxidation, dehydration, and sulfonation. The amount of
color produced is directly proportional to the cholesterol present in the sample which
is measured at 550 nm. The reaction involves “3-hydroxy-5ene” part of the choles-
terol molecule, which is first dehydrated to form cholesta 3,5-diene and then
oxidized by the H2SO4 to link two molecules together as bis-cholesta-3,5-diene.
This compound can be sulfonated by the H2SO4 to produce mono- and disulfonic
acids which are highly colored. In presence of more H2SO4 and ferric ions, the
disulfonic acids are preferentially formed and are red in color. The color thus
produced is measured at 550 nm.
23.5 Reagents
1. Precipitating reagent: 0.05% FeCl3 in glacial acetic acid
2. Conc. H2SO4
3. Cholesterol standard: 100 mg % in glacial acetic acid
23.6 Procedure
1. Take a set of seven test tubes and label them as blank, standard (S1-S5), and test
(T).
2. Dispense 20, 40, 60, 80, and 100 μl of 100 mg % cholesterol standard into the
tubes labelled as (S1–S5), respectively, and make the volume 3 ml with
precipitating reagent.
3. In the blank tube, add 3 ml precipitating reagent.
94 23 To Estimate the Amount of Total Cholesterol in Serum
105.
4. Add 0.05ml serum in 5 ml of precipitating reagent, mix well and keep for 5 min,
and centrifuge it at 3000 rpm for 5 min. Take 3 ml of supernatant and add to the
tube labelled as T.
5. To each tube add 2 ml of conc. H2SO4 through the sides of the tube. Mix well
immediately. Incubate for 20 min at room temperature and read absorbance at
550 nm.
Reagents Blank S1 S2 S3 S4 S5 T
Cholesterol standard (μl) – 20 40 60 80 100 –
Cholesterol amount (μg) – 20 40 60 80 100 –
Precipitating reagent (ml) 3 2.98 2.96 2.94 2.92 2.90 –
Protein-free filtrate (ml) – – – – – – 3
Conc. H2SO4 (ml) 2 2 2 2 2 2 2
Overlay and mixed thoroughly and keep at room temperature for 20 min
23.7 Calculations
Plot a graph by taking cholesterol amount at x-axis vs absorbance at y-axis, and
extrapolate cholesterol concentration of the given serum sample from the graph. The
amount of cholesterol extrapolated from graph will be in 0.03 ml of serum
sample since 0.05 ml of serum sample was mixed with precipitating reagent and
3 ml of this was used for cholesterol analysis. The cholesterol amount in serum
sample can also be calculated by using equation:
Cholesterol in serum ¼
ODof test amount of standard μg
ð Þ 100
ODof standard volume of sample 0:03ml
ð Þ 1000
¼ xmg=dl
23.8 Clinical Significance
Normal range of total cholesterol in blood ranges from 150 to 240 mg/dl. Serum
cholesterol rises with age. Hypercholesterolemia occurs in nephrotic syndrome,
diabetes mellitus, obstructive jaundice (due to obstruction of large ducts), coronary
thrombosis, angina pectoris, atherosclerosis, and other heart disease. In pregnancy,
the increase in cholesterol levels may reach 20–25% of the normal value. Hypercho-
lesterolemia occurs in hypothyroidism, liver damage, pernicious anemia, hemolytic
jaundice, abetalipoproteinemia, and cortisone administration.
23.8 Clinical Significance 95
106.
To Estimate Totaland Direct Bilirubin
in Serum 24
24.1 Theory
Bilirubin originates from breakdown of heme. It is a waste product and the body
eliminates it through bile. The heme present in erythrocytes contributes approxi-
mately 85% of total bilirubin which is destroyed in the reticuloendothelial cells. The
destruction of red blood cell precursors in the bone marrow and catabolism of other
heme-containing proteins like myoglobin, cytochromes, and peroxidases release the
remaining 15% of bilirubin. Biliverdin is first formed from the porphyrin part of
heme in reticuloendothelial cells and is reduced to bilirubin called unconjugated
bilirubin, which is then transported to the liver in association with albumin. This
unconjugated bilirubin is insoluble in water. Bilirubin then enters to microsomes of
hepatocytes and conjugated by the action of glucuronyl transferase to produce
bilirubin monoglucuronide and diglucuronide (conjugated bilirubin). The bilirubin
conjugated with glucuronic acid is water soluble and it exerted through bile. The
conjugated bilirubin present in bile passes along the bile ducts into the intestine.
Here it is reduced by bacterial action and is also deconjugated, mainly in the colon to
“urobilinogens.” Urobilinogen is recycled through the body and a part of it is
excreted through the urine (Fig. 24.1).
24.2 Specimen Requirements
Serum is a desirable sample. Protect the sample from light since exposure to white or
UV light may decrease total and indirect bilirubin up to 20%. Hemolysis increases
indirect bilirubin.
# Springer Nature Singapore Pte Ltd. 2018
V. Kumar, K. D. Gill, Basic Concepts in Clinical Biochemistry: A Practical Guide,
https://doi.org/10.1007/978-981-10-8186-6_24
97
107.
24.3 Principle
Bilirubin reactswith diazotized sulfanilic acid to produce a red-purple-colored
compound called azobilirubin under acidic conditions. The color thus produced is
measured in a colorimeter at 540 nm and compared with that of bilirubin standard.
Direct (conjugated) bilirubin produces immediate color with diazo reagent, and the
indirect (conjugated) bilirubin produces color with diazo reagent only in the pres-
ence of 50% alcohol.
Fig. 24.1 Bilirubin metabolism and elimination
98 24 To Estimate Total and Direct Bilirubin in Serum
108.
24.4 Reagents
1. Diazoreagent
Sol. A – Dissolve 100 mg sulfanilic acid in 100 ml of 1.5% HCl.
Sol. B – 0.5% aqueous solution of sodium nitrite. Diazo reagent is prepared by
mixing 10 ml of solution A with 0.3 ml of solution B. Prepare just before use.
2. Diazo Blank: 1.5% v/v aqueous solution of HCl.
3. Bilirubin standard (10 mg %): Dissolve 10 mg of bilirubin powder in 5 ml of
0.1 N NaOH, and add 80 ml of 2% BSA solution in saline. Then add 5 ml of 0.1 N
HCl, and mix and make the volume 100 ml with 2% BSA solution. Store in
brown bottle at 4
C.
24.5 Procedure
1. Take a set of 12 test tubes in duplicate and label as blank, standard (S1-S7), total
(T) total control (Tc), direct (D), and direct control (Dc). Also take another six
tubes for standard controls.
2. Add 20, 40, 60, 80, 100, 150, and 200 μl of 10 mg % bilirubin standard into the
tubes labelled as S1-S7, respectively, and standard controls.
3. Pipette out 0.1 ml of serum to all the tubes labelled as T, Tc, D, and Dc. Make
volume to 2 ml with distilled water in each tube except D and Dc. Add 4.9 ml
distilled water to the tubes labelled as D and Dc.
4. Add 0.5 ml diazo reagent to all the tubes except blank, Tc and Dc, and standard
controls. 0.5 ml of diazo blank was added to the tubes blank, Tc, Dc, and standard
controls.
5. Add 3 ml of methanol to all the tubes except D and Dc. Mix and keep in dark for
30 min at room temperature and read absorbance at 540 nm.
24.5 Procedure 99
109.
24.6 Calculations
Plot agraph by taking bilirubin amount at x-axis vs absorbance at y-axis, and
extrapolate bilirubin concentration of the given serum sample from the graph. The
bilirubin concentration can also be calculated by applying equation:
mgof bilirubin∗
in blood=dl
¼
ODof test control
ð Þ amount of standard 100
ODof standard control
ð Þ volume of sample ml
ð Þ 1000∗
∗
¼ xmg=dl
*Calculate total and direct bilirubin; **To convert μg to mg since amount of
bilirubin is in μg in the volume of standard added to tubes.
24.7 Clinical Significance
Normal serum contains very low concentration of direct bilirubin, i.e., 0–0.2 mg/dl,
and the total bilirubin concentration ranges from 0.2 to 1.0 mg/dl. Bilirubin analysis
is a part of hepatic function test. Increased bilirubin concentration in blood causes
jaundice. The estimation of direct (conjugated) and indirect (unconjugated) bilirubin
may help in differential diagnosis of various types of jaundices – prehepatic (hemo-
lytic), hepatic, and posthepatic (obstructive).
1. In prehepatic or hemolytic jaundice, the unconjugated bilirubin is increased due
to increased destruction of red blood cells, and the liver is unable to cope with the
increased demand for conjugation. In pernicious and chronic hemolytic anemia,
the serum bilirubin rarely exceeds 3 mg/dl but may also reach up to 10 mg/dl.
Reagents Blank S1 S2 S3 S4 S5 S6 S7
Total Direct
T Tc D Dc
Bilirubin
standard (μl)
– 20 40 60 80 100 150 200 – –
Bilirubin amount
(μg)
– 2 4 6 8 10 15 20
Serum/urine (ml) – – – – – – – 0.1 0.1 0.1 0.1
Distilled water
(ml)
2.0 1.98 1.96 1.94 1.92 1.90 1.85 1.80 1.9 1.9 4.9 4.9
Diazo reagent
(ml)
– 0.5 0.5 0.5 0.5 0.5 0.5 0.5 0.5 – 0.5 –
Diazo blank (ml) 0.5 – – – – – – – – 0.5 – 0.5
Methanol (ml) 3 3 3 3 3 3 3 3 3 3 – –
Mix well and keep in dark for 30 min at room temperature, read absorbance at 540 nm
100 24 To Estimate Total and Direct Bilirubin in Serum
110.
2. In hepaticjaundice, conjugated bilirubin decreases along with decreased excre-
tion of bilirubin. The concentration of total bilirubin increases greatly in blood
without any significant change in their ratio.
3. In posthepatic jaundice (obstructive jaundice), the concentration of conjugated
bilirubin is increased (up to 20 mg/dl) compared to unconjugated bilirubin.
Increased serum bilirubin indicates extrahepatic biliary tract obstruction and
hemolytic diseases.
Total serum bilirubin amount 40 mg/dl indicates hepatocellular obstruction and
not extrahepatic obstruction. Urine bilirubin and urobilinogen are important in
differential diagnosis of jaundice. Bilirubinuria is present in obstructive jaundice
but absent in hemolytic jaundice.
24.7 Clinical Significance 101
111.
To Determine Alanineand Aspartate
Transaminase Activity in Serum 25
25.1 Theory
Transaminases are tissue-specific intracellular enzymes, which catalyze reversible
transfer of α-amino group from amino acid to α-keto acid. They are present in almost
all cells, but higher amounts occur mainly in the liver, brain, heart, and kidney. Two
clinically important transaminases are serum glutamine oxaloacetate transaminase
(SGOT), also called aspartate aminotransferase (AST), and serum glutamine pyru-
vate transaminase (SGPT) also called alanine aminotransferase (ALT). Alanine
transaminase is present in high amount in the cardiac muscles but is also present
significantly in other tissues of the body. ALT shows its high concentration in the
liver and kidney, and trace amounts are present in the skin, pancreas, spleen, lungs,
and cardiac and skeletal muscle. Both AST and ALT enzymes are not excreted in
urine unless a kidney lesion is present. The measurement of these enzymes is a useful
diagnosis indicator of liver functions.
25.2 Specimen Requirements
Serum sample is used which is stable for more than 24 h at 4
C. Hemolysis
significantly increases AST levels but moderately increases ALT. Activity in
erythrocytes is almost 6 times higher than the activity in serum. ALT shows higher
day-to-day variation than AST. Its levels are higher in afternoon than morning.
25.3 Principle
The oxaloacetate and pyruvate formed by the action of AST and ALT from appro-
priate substrates couple with dinitrophenyl hydrazine (DNPH) to form a golden
brown or red color in alkaline medium created with NaOH. The intensity of color is
# Springer Nature Singapore Pte Ltd. 2018
V. Kumar, K. D. Gill, Basic Concepts in Clinical Biochemistry: A Practical Guide,
https://doi.org/10.1007/978-981-10-8186-6_25
103
112.
proportional to theenzyme activity which is measured at 540 nm and compared with
pyruvic acid standard.
C=O
+ H2N−
NO2
NO2
CH2
C=N−N
NO2
+ H2O
NO2
CH2
H H
N
2,4-DNPH Oxaloacetate − 2,4-DNPH
Alkaline condition
Golden brown
colour
COO
−
COO
−
COO
−
COO
−
Oxaloacetate
CH3
C=O + H2N−
NO2
NO2
C=N−N
CH3
NO2
NO2
H H
N
2,4-DNPH
Pyruvate Pyruvate − 2,4-DNPH
Alkaline condition
Golden brown
colour
COO−
COO−
25.4 Reagents
1. Phosphate buffer (0.1 M, pH 7.4): Prepare phosphate buffer by dissolving
11.3 g Na2HPO4 and 2.7 g KH2PO4 in final volume of 1 l distilled water. Adjust
pH to 7.4 using either KH2PO4 or Na2HPO4.
2. Buffer substrate for AST: Dissolve 1.33 g of L-aspartic acid and 30 mg
α-ketoglutarate in about 20 ml of phosphate buffer. Add 3–5 pellets of NaOH
to dissolve it and adjust pH to 7.4 by NaOH or HCl. Make volume up to 100 ml
with phosphate buffer and store at 4
C.
3. Buffer substrate for ALT: Dissolve 0.9 g of alanine and 30 mg α-ketoglutarate
in about 20 ml of phosphate buffer (pellets of NaOH may be added to dissolve
alanine). Make the volume up to 100 ml with phosphate buffer, and adjust pH to
7.4 if required.
4. Pyruvate standard (10 mM, pH 7.4): Dissolve 110 mg of sodium pyruvate in
phosphate buffer, and make the volume up to 100 ml. Store working standard in
small aliquots in a freezer, and one aliquot of standard may be used for preparing
a calibration graph.
5. Color reagent: dissolve 20 mg of 2,4-DNPH in 100 ml of 1 N HCI, and store in
brown bottle.
6. 0.4 M NaOH
104 25 To Determine Alanine and Aspartate Transaminase Activity in Serum
113.
25.5 Procedure
1. Takea set of nine test tubes, and label them as blank, standard (S1–S6), test (T),
and control (C).
2. Add 10, 20, 40, 60, 80, and 100 μl of pyruvic acid standard to the test tubes
marked as S1 to S6, respectively.
3. Make volume in each tube to 100 μl using phosphate buffer.
4. Add 0.5 ml of buffered substrate to all the tubes. Then mix and incubate for 3 min
at 37
C.
5. Add 100 μl of serum to test tube labelled as T. Mix and note time.
6. Incubate the tubes at 37
C for 30 min for ALT and 1 h for AST. Keep at room
temperature for 20 min.
7. Immediately after adding DNPH, add 100 μl of serum in control tube.
8. Add 5 ml of 0.4 N NaOH to all tubes, and mix and keep at room temperature for
10 min.
9. Read absorbance at 540 nm against blank.
Note For AST estimation the process is the same except the following:
1. Use AST substrate
2. Incubate for 60 min
Reagents Blank S1 S2 S3 S4 S5 S6 T C
Pyruvic acid standard (μl) – 10 20 40 60 80 100 – –
Pyruvate amount (mmol) – 0.1 0.2 0.4 0.6 0.8 1 – –
Phosphate buffer (μl) 100 90 80 60 40 20 – – –
Buffered substrate for ALT/AST
(ml)
0.5 0.5 0.5 0.5 0.5 0.5 0.5 0.5 0.5
Mix and incubate at 37
C for 3 min
Serum (ml) – – – – – – – 0.1 –
Mix well and incubate at 37
C for 30 min in case of ALT and for 1 h in case of AST
DNPH (ml) 0.5 0.5 0.5 0.5 0.5 0.5 0.5 0.5 0.5
Serum (ml) – – – – – – – – 0.1
Mix well and incubate at 37
C for 20 min
NaOH (ml) 5 5 5 5 5 5 5 5 5
Mix well and incubate at 37
C for 10 min, then read absorbance at 540 nm
25.5 Procedure 105
114.
25.6 Calculation
To measureAST and ALT activities, pyruvate is used as the standard. In theoretical
terms, for AST assay oxaloacetate should be used as the standard, and pyruvate
should be used as the standard for ALT estimation. Since, the oxaloacetate formed
during AST estimation is unstable and gets converted into pyruvate immediately;
hence, pyruvate is preferred as the standard for AST estimation. Extrapolate pyru-
vate amount from graph and calculate activity. Enzyme activity is expressed as
IU. One IU of enzyme activity is equal to 1 mmol of pyruvate/oxaloacetate formed/
min/liter of serum at 37
C. The amount of pyruvate formed equals to enzyme
activity. So, amount of pyruvate formed in m mol/min/l.
¼
ODof test control
ð Þ amount of standard mmol
ð Þ 1000
ODof standard sample volume ml
ð Þ incubation time
¼ xIU=L
25.7 Clinical Significance
The normal range of ALT is 3–40 IU/L and AST is 5–45 IU/L in serum. Normally,
the serum transaminase levels are low, but the extensive tissue damage enhances
their serum levels. The AST activity in serum is increased in myocardial infarction
after 20–36 h of onset, and hence measurement of AST is used in the diagnosis of
myocardial infarction. Increased activities are also observed in acute pancreatitis,
crushed muscle injuries, viral hepatitis, and other forms of liver diseases associated
with liver necrosis. Peak values of transaminases are seen between 7th and 12th days
of infection and return toward normal by 3rd week if recovery is uneventful.
ALT is generally higher than AST in infectious hepatitis and other inflammatory
conditions of liver or hepatic tissue damage. In such conditions, ALT/AST ratio
becomes greater than unity which is less than one in normal conditions. ALT is more
liver-specific enzyme than AST. AST levels also show increase in progressive
muscular dystrophy and dermatomyositis. ALT and AST levels are increased in
viral hepatitis (10–100 times of normal value). The course of liver damage in a
patient may be monitored by successive determination of serum AST and ALT
activities.
106 25 To Determine Alanine and Aspartate Transaminase Activity in Serum
115.
To Estimate theActivity of Alkaline
Phosphatase in Serum 26
26.1 Theory
Alkaline phosphatase (ALP) is a membrane-bound enzyme present mainly in the
liver, bone, intestine, and placenta. ALP shows maximum activity at about pH 10.
This enzyme is intracellular and only a small amount is present in plasma. In certain
disease conditions, the breakdown of cell causes release of enzyme to plasma leading
to increased enzyme levels in plasma. The ALP of normal serum in adults is mainly
derived from the liver and bone and small amount from intestinal component.
During childhood the majority of alkaline phosphatase is of skeletal origin. During
pregnancy, ALP is also contributed from the placenta. ALP is activated by magne-
sium ions. The activity in serum is due to isoenzymes from various organs, but the
major contribution occurs from the liver.
26.2 Specimen Requirements
Serum sample is used. Refrigerated sample is stable for 2–3 days if stored at 0–4
C
and for 1 month at 25
C. EDTA or oxalate anticoagulants cause extensive inhibi-
tion. Half-life of ALP is 7–10 days.
26.3 Principle
Alkaline phosphatase at alkaline pH hydrolyzes phenyl phosphate to phenol. Phenol
condenses with 4-amino-antipyrin. The condensed product is oxidized by alkaline
potassium ferricyanide to give red-colored complex which is measured at 520 nm.
# Springer Nature Singapore Pte Ltd. 2018
V. Kumar, K. D. Gill, Basic Concepts in Clinical Biochemistry: A Practical Guide,
https://doi.org/10.1007/978-981-10-8186-6_26
107
116.
Phenyl phosphate !
ALP,pH10
Phenol þ Phosphate
Phenol þ 4-aminoantipyrine !
Potassium ferricyanide
Orangeredcomplex
26.4 Reagents
1. Disodium phenyl phosphate (0.1 M): Dissolve 2.18 g of disodium phenyl
phosphate in distilled water, and make final volume to 100 ml. Store at 4
C.
2. Na2CO3-NaHCO3 buffer (pH 10.0): Prepare 100 ml 0.1 M Na2CO3-NaHCO3
buffer, (pH 10) by adding 51 ml 0.1 M Na2CO3 to 49 ml 0.1 M NaHCO3, and
adjust pH if required. Also prepare 0.5 N bicarbonate buffer separately.
3. 0.5 N NaOH.
4. 4-aminoantipyrine (0.6%) aqueous solution. Store at 4
C.
5. Potassium ferricyanide (2.4%). Store at 4
C.
6. Stock phenol standard (100 mg %) in 0.1 N NaOH. Store at 4
C.
7. Working phenol standard (10 mg %). Prepare in distilled water.
26.5 Procedure
1. Take a set of test tubes in duplicate and mark them as blank, standard (S1 to S6),
control (C), and test (T).
2. Add working phenol standard according to table in tubes S1 to S6. Add 1 ml each
of carbonate-bicarbonate buffer and substrate in all tubes. Incubate for 5 min.
3. Then add 0.1 ml serum in test sample and add 1 ml distilled water in blank.
Incubate for 15 min.
4. Then add 1 ml NaOH to stop reaction followed by 0.1 ml serum in control tube,
1 ml of bicarbonate, 1 ml 4-aminoantipyrine, and 1 ml potassium ferricyanide.
Reagents Blank S1 S2 S3 S4 S5 S6 T C
Working phenol standard (ml) – 0.1 0.2 0.4 0.6 0.8 1 – –
Amount of phenol in added
volume (μg)
– 1 2 4 6 8 10 – –
Carbonate/bicarbonate buffer (ml) 1 0.9 0.8 0.6 0.4 0.2 – 0.9 0.9
Disodium phenyl phosphate (ml) – 1 1 1 1 1 1 1 1
Incubate at 37
C for 5 min
Serum (ml) – – – – – – – 0.1 –
Distilled water (ml) 1 – – – – – – – –
Mix well and incubate at 37
C for 15 min
0.5 N NaOH (ml) 1 1 1 1 1 1 1 1 1
Serum (ml) – – – – – – – – 0.1
0.5 N bicarbonate buffer (ml) 1 1 1 1 1 1 1 1 1
4-aminoantipyrine (ml) 1 1 1 1 1 1 1 1 1
(continued)
108 26 To Estimate the Activity of Alkaline Phosphatase in Serum
117.
Potassium ferricyanide (ml)1 1 1 1 1 1 1 1 1
Mix and read the absorbance at 520 nm
26.6 Calculations
The enzyme activity is calculated in terms of King-Armstrong unit (KAU). One
KAU is defined as 1 U of ALP as that liberating 1 mg of phenol from substrate/
15 min/100 ml serum. Plot the graph between OD and the amount of phenol. The
activity can also be calculated as below:
ALPactivity ¼
ODof test control
ð Þ amount of phenol μg
ð Þ 100
ODof standard volume of sample ml
ð Þ 1000
¼ x KAU=dl or x U=dl
26.7 Clinical Significance
Normal serum ALP levels in adults are 3–14 U/dl or 30–120 U/L. The tissues such as
the liver, bone, and placenta possess very high amounts of ALP activity. Increase in
serum ALP activity is usually associated with hepatobiliary obstruction (all forms of
jaundice except hemolytic jaundice). In hepatobiliary disease, the concentration of
ALP is increased due to defect in excretion of ALP through bile. ALP mainly
produced in bone tissue reaches to the liver and excreted through bile. Increased
ALP levels are also observed in increased osteoblastic activity, rickets, hyperthy-
roidism, and bone disorders. A small increase in ALP activity may also occur in
congestive heart failure, intra-abdominal bacterial infections, and intestinal diseases.
Small increase may also be observed in multiple myeloma and impaired calcium
absorption. The elevation of ALP is more marked in extrahepatic obstruction
(gallstone, cancer of the head of the pancreas, etc.) than intrahepatic obstruction.
Decrease in serum ALP is observed during severe anemia, celiac disease, zinc and
magnesium deficiency, scurvy, cretinism, hypothyroidism, and hypophosphatemia.
26.7 Clinical Significance 109
118.
To Estimate theActivity of Acid
Phosphatase in Serum 27
27.1 Theory
The greatest activity of acid phosphatase (ACP) occurs in semen (prostate gland).
ACP is lysosomal enzyme. The prostatic enzyme is found in lysosome of prostrate
epithelium. Small amounts are also present in the platelets, leucocytes, liver, kidney,
spleen, and pancreas. Approximately one-half of the total serum ACP activity in
males is contributed from the prostate. The rest of activity is due to the liver and
disintegrating platelets and erythrocytes. In females, activity is from the liver,
erythrocytes, and platelets.
27.2 Specimen Requirements
Serum is used. Separate serum and analyze it immediately. Avoid hemolysis. Citrate
buffer or acetic acid may be added to attain pH of 5.5–6.5 to preserve activity.
27.3 Principle
Principle is the same as for ALP except that the substrate is hydrolyzed by enzyme
ACP at pH 5.0 with liberation of phenol.
27.4 Reagents
Same as used for ALP activity assay except the use of citrate buffer instead of
carbonate-bicarbonate buffer.
Citrate Buffer (pH 5.0): Dissolve 21 g of citric acid and 7.5 g NaOH in about
450 ml distilled water, and adjust pH 5.0 and make final volume to 500 ml with
distilled water.
# Springer Nature Singapore Pte Ltd. 2018
V. Kumar, K. D. Gill, Basic Concepts in Clinical Biochemistry: A Practical Guide,
https://doi.org/10.1007/978-981-10-8186-6_27
111
119.
27.5 Procedure
Procedure isthe same as explained for ALP activity except the use of citrate buffer
instead of carbonate-bicarbonate buffer.
27.6 Calculations
The enzyme activity is calculated in terms of KAU as explained for ALP. Plot a
graph between OD and the amount of phenol. Activity can also be calculated using
equation explained for ALP.
27.7 Clinical Significance
Normal range of ACP is 1–3.5 KAU/dl. ACP levels increase 40–50 times of normal
levels in prostate cancer. Earlier, ACP was used for diagnosis of prostate cancer that
is now replaced by prostate-specific antigen. Slight increase in ACP activity is also
observed in hyperparathyroidism with skeletal involvement, malignant inversion of
bones by cancers such as female breast cancer, and Paget’s disease. Non-prostrate
ACP fraction increases in myelocyte leukemia and some other hematological
disorders.
112 27 To Estimate the Activity of Acid Phosphatase in Serum
120.
To Determine Serumand Urinary Amylase
Activity 28
28.1 Theory
Amylases are a group of hydrolyzing enzyme which hydrolyzes starch and glyco-
gen. There are two types of amylases: α-amylase (hydrolyzes randomly α 1–4
glycoside links, also known as endoamylases, e.g., human α-amylase) and β-amy-
lase (hydrolyzes β 1–4 glycosidic linkage). Salivary glands, pancreas, and fallopian
tubes show highest amylase activities, while ovaries, small and large intestine, and
skeletal muscle possess low activity of amylase.
28.2 Specimen Requirements
Serum is used which is stable for 7 days at room temperature and for 1 month at 4
C.
For the blood test, patients should not eat or drink anything except water for 2 h
before the test. For the urine test, patients should drink enough fluids during the 24 h
test to avoid dehydration. Collect 24 h urine or 1 h urine in container with preserva-
tive. Acidic urine makes amylase unstable; hence pH is adjusted to alkaline range
before storage at 4
C.
28.3 Principle
Iodine gives blue color with starch and its degradation products containing longer
chain linear polysaccharides. As the chain length shortens to less than 45 units, the
blue color changes through purple to red and brown until with less than 12 units no
color is observed. Amylase hydrolyzes starch to glucose and maltose; the time
required for the complete digestion of a certain amount of starch is determined by
periodic testing with iodine and, this time, is converted to Somogyi units.
# Springer Nature Singapore Pte Ltd. 2018
V. Kumar, K. D. Gill, Basic Concepts in Clinical Biochemistry: A Practical Guide,
https://doi.org/10.1007/978-981-10-8186-6_28
113
121.
28.4 Reagents
1. Starchsubstrate solution: Dissolve 75 mg of starch in about 20 ml of distilled
water with the aid of heat. Add 250 mg of NaCl, dissolve, and make the final
volume 100 ml with distilled water.
2. Stock iodine solution (0.1 M): Dissolve 40 g of potassium iodide in about 100 ml
distilled water, and add 12.7 g of iodine. Mix well to dissolve, and make the final
volume 1000 ml with distilled water.
3. Working iodine solution (0.05 M): 5 ml of stock iodine solution is diluted to
100 ml with distilled water. Prepare fresh before use. Store in a brown bottle.
28.5 Procedure
Pipette out 2 ml starch substrate in a test tube, and keep at 37
C in water bath for
3–5 min. Add 0.5 ml serum and mix and then note time. After 5 min, remove 0.2 ml
of the above mixture from the incubator and add to 0.2 ml of working iodine solution
kept outside and mix and observe the color of iodine solution. If the color of iodine
solution is purple brown, this indicates that the starch present in that tube is not
completely hydrolyzed by the action of amylase enzyme. Again remove 0.2 ml of
starch serum mixture at the end of sixth min of incubation time, and add 0.2 ml
iodine solution. The procedure is repeated at every 1 min interval until the iodine
solution gives yellow color with serum starch mixture. Note the time for calculating
enzyme activity.
Urinary Amylase (Diastase) Estimation Procedure for the estimation of urinary
amylase is same as that of serum amylase. Report the amylase activity in terms of per
hour urine sample.
Note If the activity of urinary amylase and serum amylase is very high, dilute the
urine and serum and repeat the test and calculate the value and multiply the value
obtained with dilution factor.
28.6 Calculation
One Somogyi unit (SU) is defined as 1.5 mg of starch (2 ml substrate in present case)
hydrolyzed by the action of amylase present in 100 ml serum. If time taken for
hydrolysis is “t” min, then amylase activity (SU/100 ml serum) can be calculated as
¼
8 100
t volof sample used
114 28 To Determine Serum and Urinary Amylase Activity
122.
28.7 Clinical Significance
Normalamylase activity ranges from 80 to 180 SU/dl in serum and from 1500 to
1800 SU/24 h urine specimens. In acute pancreatitis, enzymes from damaged cells
may pass into the blood in considerable amount and more amount of amylase
excreted through urine. In renal failure, the clearance of amylase is reduced and
serum amylase increased, while urinary amylase excretion is normal.
In acute pancreatitis, the serum amylase value reaches from 1000 to 6000 SU/dl at
24–48 h after onset of the attack with a concomitant large increase in urinary
amylase. The increase in activity starts within an hour of onset of pain and usually
returns to normal in 4–8 days being partly removed by renal excretion. In chronic
pancreatitis and later stage of carcinoma of pancreas, increased levels of serum and
urinary amylase are observed. Increase of amylase over 1000 SU/dl occurs in biliary
tract disease without pancreatitis. Increase in amylase activity also occurs in intesti-
nal obstruction and perforated peptic ulcer.
28.7 Clinical Significance 115
123.
To Estimate theActivity of Lipase in Serum
29
29.1 Theory
Lipase is the enzymes that cause hydrolysis of glycerol esters of long chain fatty
acids into glycerol and free fatty acids. Only the ester bond at carbons 1 and 3 (α-
positions) is attacked, and the reaction produces two moles of fatty acid and one
mole of 2-acylglycerol (β-monoglyceride) per mole of substrate. The latter is
resistant to hydrolysis, but it can spontaneously isomerizes to the 3-acylglycerol,
that is, α-form. This isomerization splits off the third fatty acid, a process that occurs
at a much slower rate. Lipase acts at an oil-water interface on emulsified substrates.
Most of the serum lipase is produced in pancreas, but pulmonary, gastric, and
intestinal mucosa also secretes lipase. Lipase activity can also be demonstrated in
leucocytes in adipose tissue cells and in milk.
29.2 Specimen Requirements
Serum sample is used which is stable for several days at room temperature. Store
refrigerated to avoid bacterial contamination.
29.3 Principle
Fatty acids released by the action of lipase on substrate for a period of 24 h at 37
C
(pH 7.4) are determined by titrating against standard solutions of NaOH using
phenolphthalein as indicator.
# Springer Nature Singapore Pte Ltd. 2018
V. Kumar, K. D. Gill, Basic Concepts in Clinical Biochemistry: A Practical Guide,
https://doi.org/10.1007/978-981-10-8186-6_29
117
124.
29.4 Reagents
1. Oliveoil emulsion (50%): Take equal parts of olive oil and 5% aqueous solution
of gum acacia and homogenize it.
2. Phosphate buffer, 0.1 M, pH 7.4.
3. Ethanol.
4. 0.05 M NaOH solution.
5. Phenolphthalein (1%) alcoholic solution.
29.5 Procedure
1. Take two test tubes and label as test and control.
2. Add 0.4 ml of olive oil emulsion and 0.2 ml serum and 0.5 ml phosphate buffer to
both the tubes.
3. Vortex the tubes and incubate the tube labelled as test at 37
C for 24 h and control
tube at 4
C for 24 h.
4. Take out both the tubes and add 3 ml of ethanol to test and control tubes.
5. Vortex and add two drops of phenolphthalein to both the tubes, mix, and titrate
both the tubes against 0.05 N NaOH solution until a pink color is observed. Note
the volume of NaOH used.
29.6 Calculation
One Cherry Crandall Unit (CCU) is defined as 1 ml of 0.05 N NaOH required to
neutralize the free fatty acid liberated by the action of lipase on olive oil substrate at
37
C (pH 7.4), for a period of 24 h by 1 ml serum.
Lipase activity=mlserum ¼
titration value T C
ð Þ 1
Volume of sample
¼ xCCU=ml
29.7 Clinical Significance
Measurement of lipase activity in serum, plasma, or ascetic fluid is used exclusively
for the diagnosis of pancreatitis. Normal level of lipase in serum is up to 0–160 U/L.
In acute pancreatitis the serum lipase activity rises within 2–10 h. Peak level at about
12 h and the value may return to normal within 48–72 h. In acute pancreatitis, the
lipase value increases 2–50-fold than normal. The increase in lipase activity is also
observed in obstruction of pancreatic duct by calculi or carcinoma of the pancreas. In
acute and chronic renal disease, there is increase in serum lipase activity.
118 29 To Estimate the Activity of Lipase in Serum
125.
Qualitative Analysis ofKetone Bodies
in Urine 30
30.1 Theory
The three compounds, namely, acetone, acetoacetic acid, and β-hydroxybutyrate, are
called ketone bodies. Ketone bodies are water-soluble and energy-yielding
substances. The synthesis of ketone bodies is called ketogenesis. The ketogenesis
process occurs in the liver particularly during periods of low food intake,
carbohydrate-restrictive diets, starvation, or in untreated type 1 diabetes mellitus.
Ketone bodies are transported from the liver to the extrahepatic tissues and converted
into acetyl-CoA which then enters the citric acid cycle and is utilized for energy
production (Fig. 30.1). The liver, however, is unable to metabolize ketone bodies.
The tissues which lack mitochondria, i.e., erythrocytes, also cannot utilize ketone
bodies. Ketone bodies are major fuel source for the brain during starvation and can
meet 50–70% of total energy needs. The relative proportion of ketone bodies present
in blood may vary from 78% (β-hydroxybutyric acid) to 20% (acetoacetic acid) and
2% (acetone). Tests for ketone bodies should be done on fresh urine sample.
CH3
CH3
CH3
O
C
O
O
O O
O
C
H
OH
C C
C CH3
CH2
CH2
Acetone Acetoacetate D-b-Hydroxybutyrate
Ketone bodies
# Springer Nature Singapore Pte Ltd. 2018
V. Kumar, K. D. Gill, Basic Concepts in Clinical Biochemistry: A Practical Guide,
https://doi.org/10.1007/978-981-10-8186-6_30
119
126.
30.2 Rothera’s Testfor Acetoacetic Acid and Acetone
30.2.1 Principle
Alkaline nitroprusside reacts with keto-group of acetone and acetoacetic acid to form
a purple-colored complex.
30.2.2 Reagents
(a) Rothera’s reagent: dry mixture
Take ammonium sulfate and sodium nitroprusside in 100:1 ratio. Grind well to mix
powder of salts.
(b) Conc. ammonia in liquid form
30.2.3 Procedure
5 ml of urine is saturated with Rothera’s reagent in a test tube. Then 0.5–1.0 ml of
conc. ammonia is added through the sides of the tube in such a way that it layers on
top of the urine. Any change in color is observed within 30–60 s.
gluconeogenes
citric
acid
cycle
Ketone
bodies
Acetyl CoA
Acetyl CoA
Liver Blood Extrahepatic tissue
Glucose
FFA
excreted in urine
citric acid cycle
Acetyl CoA
ketone bodies
acetone in lungs
glucose utilisation
acetone and
β-hydroxy butyrate
exported as energy
source for heart,
skeletal muscle,
kidney and brain
Fig. 30.1 Utilization of ketone bodies
120 30 Qualitative Analysis of Ketone Bodies in Urine
127.
30.2.4 Result
Appearance ofa purple/red ring at the junction of the two layers within 30–60 s
indicates the presence of acetone and diacetic acid. Based on the intensity of the
color formed, the result can be represented as grade from trace to 3+
.
The presence of L-dopa and phenyl pyruvic acid in urine may produce weak false
positive reactions. In case of suspicion of a false positive test, the urine sample is
heated in a test tube for 1 min, allowed to cool, and Rothera’s test is repeated. The
heated urine will not produce a positive Rothera’s test due to ketone bodies.
30.3 Gerhardt’s FeCl3 Test for Acetoacetic Acid
This test is based on the reaction of FeCl3 with acetoacetate producing a red wine
color. The test is non-specific, and antipyrine gives similar color.
30.3.1 Reagent
10% aqueous solution of FeCl3.
30.3.2 Procedure
Take 5 ml of urine and add 10% FeCl3 solution drop by drop. Red wine color
(purple) indicates positive test.
30.4 Ketostix Test for Acetone and Acetoacetate
Ketostix are plastic strips, one end of which is impregnated with sodium
nitroprusside and glycine. When these strips are immersed in urine, sodium
nitroprusside and glycine react with acetone and acetoacetate to give lavender or
purple color.
30.4.1 Procedure
Dip the test end of strip in fresh specimen of urine, and remove immediately, briefly
touching the tip on side of container to remove excess liquid. Compare color with
chart. Ketostix is sensitive to 10 mg/dl acetoacetic acid and 25 mg/dl acetone.
30.4 Ketostix Test for Acetone and Acetoacetate 121
128.
30.5 Detection ofb-Hydroxybutyrate
30.5.1 Principle
β-hydroxybutyrate forms acetoacetate on oxidation with H2O2 which can be detected
with Rothera’s test.
30.5.2 Procedure
Add few drops of acetic acid in about 10 ml of urine diluted 1:1 with distilled water.
Boil for few min to remove acetone and acetoacetic acid. Add about 1 ml of H2O2,
warm gently, and apply Rothera’s test.
Note If Rothera’s test is positive before oxidation with H2O2 (with fresh urine
sample), then acetone and acetoacetic acid ketone bodies are present. If Rothera’s
test give positive result after oxidation with H2O2, then β-hydroxybutyrate is present
in urine.
30.6 Clinical Significance
In normal conditions, the ketone bodies are produced constantly by the liver and
utilized by peripheral tissues. The normal concentration of ketone bodies in blood is
about 1–3 mg/dl, and their excretion in urine is negligible, that is, undetectable by
routine urine tests. The concentration of ketone bodies increases in the blood when
the rate of synthesis exceeds the rate of utilization, a condition named ketonemia.
The higher increase of ketone bodies in blood leads to their excretion in urine. The
excretion of ketone bodies in urine is called ketonuria. In untreated diabetes patient
and starving patient, the serum ketone body levels may reach 90 mg or above per
100 ml of serum, and urinary excretion may reach 5000 mg/24 h urine. In type I
diabetes, low insulin levels impair carbohydrate metabolism that leads to accumula-
tion of acetyl CoA and its conversion to ketone bodies. During starvation also
increased lipolysis causes overproduction of acetyl CoA which is diverted for
overproduction of ketone bodies. Both these conditions result in very high levels
of ketone bodies, lowering the blood pH, and kidneys excrete very acidic urine.
122 30 Qualitative Analysis of Ketone Bodies in Urine
129.
Qualitative Test forBile Pigments
and Urobilinogen in Urine 31
31.1 Theory
Bile pigments are breakdown products of the blood pigment hemoglobin that are
excreted in bile. Bilirubin (orange or yellow in color) and its oxidized form biliverdin
(green) are two important bile pigments. Bilirubin is formed by the degradation of
heme in reticuloendothelial system. After formation of unconjugated bilirubin,
albumin transports it to the liver where it conjugates with glucuronic acid to form
bilirubin diglucuronide. The conjugated bilirubin is excreted through bile. Unconju-
gated bilirubin is water insoluble, so it is unable to pass through the glomerulus and
is therefore not found in urine, whereas conjugated bilirubin is water soluble and is
filtered in the glomerulus and subsequently reabsorbed by the renal tubules; hence
normally bile pigments are absent in urine. Bilirubin glucuronides are hydrolyzed by
intestinal bacterial enzyme β-glucuronidases to liberate bilirubin which is converted
to a colorless compound “urobilinogen.” A portion of the urobilinogen formed is
reabsorbed by enterohepatic circulation. Urobilinogen can be converted to a yellow-
colored compound “urobilin” in the kidneys and excreted. The major part of intesti-
nal urobilinogen is reduced to stercobilin by bacterial action which imparts brown
color to feces and is excreted (Fig. 31.1).
31.2 Tests for Bile Pigments in Urine
31.2.1 Fouchet’s Test
31.2.1.1 Principle
The sulfate radicals present in urine react with BaCl2 to form precipitates of barium
sulfate. Bilirubin present in the urine gets absorbed on the precipitates, and hence it
get conc. on treatment with Fouchet’s reagent. FeCl3 in the presence of TCA oxidize
the bilirubin to biliverdin and produce blue or green color.
# Springer Nature Singapore Pte Ltd. 2018
V. Kumar, K. D. Gill, Basic Concepts in Clinical Biochemistry: A Practical Guide,
https://doi.org/10.1007/978-981-10-8186-6_31
123
130.
31.2.1.2 Reagents
(a) 33%v/v aqueous solution of acetic acid.
(b) 10% aqueous solution of BaCl2.
(c) Fouchet’s reagent: Dissolve 5 g TCA in about 60 ml of distilled water and
add to it 10 ml of 10% FeCl3 solution, mix, and make the final volume
100 ml with distilled water.
31.2.1.3 Procedure
Acidify urine sample with few drops of 33% acetic acid. To 10 ml of acidified urine
sample, add 5 ml of 10% BaCl2 solution. Mix well, and the precipitate is filtered
through Whatman No. 1 filter paper. Dry the precipitates in between two layers of
filter paper. Unfold the filter paper and add one or two drops of Fouchet’s reagent on
the precipitates and observe the color produced. Green-blue color formed on the
precipitate indicates bile pigments in the urine.
Fig. 31.1 Bilirubin
metabolism
124 31 Qualitative Test for Bile Pigments and Urobilinogen in Urine
131.
31.2.2 Hunter’s Test
31.2.2.1Principle
Bilirubin present in the urine sample gets adsorbed on barium sulfate precipitates.
This bilirubin reacts with diazotized sulfanilic acid to form pink-red color
azobilirubin.
31.2.2.2 Reagents
1. Diazo reagent:
Sol. A: Dissolve 0.1 g of sulfanilic acid in 1.5 ml conc. HCl, and make the final
volume 100 ml with distilled water.
Sol. B: 0.5% aqueous solution of sodium nitrite.
Mix 10 ml solution A with 0.3 ml solution B just before use; this is diazo reagent.
2. 10% aqueous solution of BaCl2
3. Absolute alcohol
4. 6% Na2HPO4
31.2.2.3 Procedure
To 5 ml of urine, add 2 ml of 10% BaCl2 solution. Mix well and centrifuge at
3000 rpm for 5 min. Discard the supernatant and add 2 ml of distilled water to the
pellet, mix, and centrifuge at 3000 rpm for 5 min for washing the precipitates.
Discard the supernatant, and add 0.5 ml of diazo reagent. Mix and add 2 ml of
ethanol and 0.5 ml of 6% Na2HPO4, and observe the color. Purple-red color
indicates the presence of bile pigments in urine.
31.2.3 Gmelin’s Test
Add 3 ml of urine carefully over 5 ml conc. HNO3 in a test tube. Wait for few min.
The presence of bile pigments shows a play of colors from yellow, red, violet, blue to
green due to formation of derivatives of bile pigments by action of HNO3.
31.2.3.1 Clinical Significance
Normally bile salts are absent in urine. The color of urine may be dark yellow to
greenish brown depending upon the concentration of bile pigments, and when
shaken urine becomes foamy. Bilirubin is found in urine in posthepatic or extrahe-
patic obstructive jaundice and in those types of hepatic jaundice in which there is
cholestasis. It is thus an indicator of regurgitation of conjugated bilirubin which
being water soluble and loosely attached to plasma albumin passes into the urine. It
is not present in urine in prehepatic (hemolytic) jaundice. The unconjugated biliru-
bin, circulating bound to albumin, is poorly soluble in water. The color of urine may
be dark yellow to greenish brown depending upon the amount of bile pigments. It
also forms foams readily when shaken.
31.2 Tests for Bile Pigments in Urine 125
132.
31.3 Urobilinogen inUrine
31.3.1 Ehrlich’s Test
31.3.1.1 Principle
A red-colored complex is formed when urobilinogen reacts with p-dimethyl amino
benzaldehyde in conc. HCl. Sodium acetate is used to reduce the acidity after the
reaction of urobilinogen with Ehrlich’s reagent.
31.3.1.2 Reagents
Ehrlich’s Reagent Dissolve 0.5 g para-dimethyl amino benzaldehyde in 100 ml of
150:100 ratio of conc. HCl and distilled water.
31.3.2 Saturated Sodium Acetate Solution
31.3.2.1 Procedure
Mix equal volume (5 ml each) of urine and Ehrlich’s reagent, and keep for 10 min.
Then add 5 ml of saturated sodium acetate solution, and observe the color produced.
If red color is produced, urobilinogen is present in the sample. In case no color
developed, warm at 60
C.
Use fresh sample of urine; otherwise false negative result may be observed, as
urobilinogen on standing is oxidized to urobilin. Urobilin shows negative result with
Ehrlich’s reagent. A false positive result may be given by natural substances like
porphobilinogen and drugs like para-aminosalicylic acid, sulfonamides, and
sulfonylureas. In order to distinguish between urobilinogen and porphobilinogen,
add 5 ml chloroform to the red color solution formed in Ehrlich’s test. Shake well
and let the layer to separate. Red color in the lower organic layer indicates the
presence of urobilinogen, while the color in the above aqueous layer indicates
porphobilinogen.
31.4 Precautions
1. Use fresh urine sample.
2. If bilirubin is present in the sample, first remove the bile pigments by Fouchet’s
test or by adding 10% BaCl2 to 5 volume of urine. Centrifuge the solution and
take the supernatant and detect urobilinogen by Ehrlich’s test.
126 31 Qualitative Test for Bile Pigments and Urobilinogen in Urine
133.
31.5 Clinical Significance
Normallysmall amount of urobilinogen is excreted through urine (1–3.5 mg/24 h
urine). In hemolytic jaundice, urobilinogen is raised but not high because the liver is
not able to completely excrete the increased quantity and absorbed in the intestine.
So, in hemolytic jaundice, positive test for urobilinogen and urobilin is obtained with
negative test for bilirubin. In extrahepatic (obstructive) jaundice, the complete
absence of bilirubin in the intestine results in the absence of urobilinogen in urine.
In liver cirrhosis, in spite of the reduced amount of urobilinogen found in the
intestine, there is often an appreciable increase in urine urobilinogen which may
be of diagnostic value; as in these cases, bilirubin may not be present in the urine.
Pink color is also given by porphobilirubin and is of significance in porphyrias. It
may be distinguished from urobilinogen by the absence of color intensification on
addition of sodium acetate.
31.5 Clinical Significance 127
134.
Determination of TotalLactate
Dehydrogenase Activity in Serum Sample 32
32.1 Theory
Lactate dehydrogenase (LDH) is an enzyme involved in glucose metabolism. LDH
is widely distributed in all cells but especially abundant in cardiac and skeletal
muscles, liver, kidney, and red blood cells. LDH contains five isoenzymes (LDH1,
LDH2, LDH3, LDH4, and LDH5). These isoenzymes can be separated by electro-
phoresis. LDH1 has more positive charge and hence fastest in electrophoresis
mobility, while LDH5 is slowest in mobility. LDH is an oligomeric enzyme made
up of four polypeptide subunits. Two types of subunits M (for muscle) and H (for
heart) are produced by different genes. LDH1 is predominantly found in the heart,
while LDH5 occurs in skeletal muscles. Total LDH activity is measured as combined
activity of all isoenzymes in plasma (LDH1 and LDH2 are predominant in plasma
than LDH3, LDH4, and LDH5 which are present only in small amounts).
32.2 Specimen Requirements
Serum/plasma (heparin) is the preferred sample. Store at room temperature, do not
refrigerate or freeze, and sample should be free from any clot.
32.3 Principle
LDH is an oxidoreductase enzyme that catalyzes the reversible oxidation of lactate to
pyruvate using NAD+
as hydrogen acceptor. The equilibrium favors the conversion
of pyruvate to lactate at pH 7.4–7.8. The decrease in absorbance at 340 nm is directly
proportional to LDH activity.
# Springer Nature Singapore Pte Ltd. 2018
V. Kumar, K. D. Gill, Basic Concepts in Clinical Biochemistry: A Practical Guide,
https://doi.org/10.1007/978-981-10-8186-6_32
129
135.
Lactate þ NADþ
⇄
LDH
pyruvateþ NADH þ Hþ
32.4 Reagents
1. Buffer substrate solution (consisting of 50 mM phosphate buffer, pH 7.5 and
0.6 mM pyruvate, and 0.095% sodium azide)
2. NADH2: 0.18 mmol/L
32.5 Procedure
Take 2 ml of NADH solution and add 50 μl of serum sample. Incubate for 2 min, and
then add 2 ml buffer substrate. Measure the decrease in absorbance at 340 nm at
1 min interval for 3 min. If absorbance change exceeds 0.1/min, dilute sample
accordingly and include dilution factor in calculation.
32.6 Calculation
Lactate dehydrogenase activity/liter of serum
¼
Δ OD=min total volume in cuvette 1000
molar extinction coefficient
ð Þ volume of serum used ml
ð Þ
¼ U=L
Molar absorption coefficient of NADH at 340 nm ¼ 6.22 103
106
/μ mole/
cm.
32.7 Clinical Significance
Normal total LDH activity is 100–190 U/L at 37
C. The isoenzymes of LDH have
diagnostic value in heart and liver diseases. In a healthy individual, LDH2 value is
higher than LDH1 in serum. In myocardial infarction, the peak levels of LDH1
activity is much higher than LDH2 (although both LDH1 and LDH2 may be
elevated, but LDH1 is more elevated), and that occurs within 12–24 h after onset
of infarction and elevated levels persist for 10–14 days. LDH5 levels increase
predominantly in muscular dystrophy, while in liver infarction or liver malignancy
both LDH4 and LDH5 are increased. It should be noted that LDH activity is 80–100
times more in red blood cells (RBC) than in serum. Hence for estimation of enzyme
activity, serum should be free of hemolysis.
130 32 Determination of Total Lactate Dehydrogenase Activity in Serum Sample
136.
To Measure Activityof Creatine Kinase
in Serum 33
33.1 Theory
Creatine kinase (CK), also called creatine phosphokinase, exists as three
isoenzymes, i.e., CK1, CK2, and CK3. Each isoenzyme is dimeric enzyme composed
of subunits M (muscle) or B (brain). The isoenzyme CK1 contains subunit BB and
occurs primarily in the brain. CK2 possess subunit MB and are found in the heart.
Skeletal muscles primarily contain the MM isoform (CK3). Healthy individuals
typically contain the MM isoform and a small amount of the MB isoform in their
serum. The enzyme is not found in the liver, kidney, and blood cells. Various
conditions including skeletal muscle injury and myocardial damage release
CK-MB into the bloodstream. In myocardial infarction, levels of both CK-total
and CK-MB increase significantly, but CK-MB is considered a specific cardiac
marker.
33.2 Sample Requirement
Serum or plasma (heparinized/EDTA) is used. Protect from light. Loss of activity
occurs within 7 days at 4
C or within 24 h at 25
C.
33.3 Principle
Creatine kinase enzyme hydrolyzes creatine phosphate to liberate creatine and ATP
at pH 7.4. Enzyme hexokinase converts glucose to glucose-6-phosphate in presence
of ATP. Glucose-6-phosphate is converted to 6-phosphogluconolactone. The change
in absorbance is monitored at 30 s intervals for 3 min at 340 nm. The enzyme in
serum is relatively unstable and loses its activity due to sulfhydryl group oxidation at
the active site of the enzyme. The enzyme activity is partially restored by incubating
the enzyme reaction with sulfhydryl containing compounds such as
# Springer Nature Singapore Pte Ltd. 2018
V. Kumar, K. D. Gill, Basic Concepts in Clinical Biochemistry: A Practical Guide,
https://doi.org/10.1007/978-981-10-8186-6_33
131
137.
N-acetylcysteine, thioglycerol, dithiothreitol,cysteine, etc. The reaction sample is
also added with an antibody specific to CK-M subunit which inhibits CK-M
monomer.
Creatine phosphateþADP ⇄
CK
CreatineþATP
Glucose þ ATP ⇄
Hexokinase
Glucose-6-Phosphate þ ADP
Glucose-6-Phosphate þ NADP !
G6P dehydrogenase
6-phosphogluconolactone
þ NADPH2
33.4 Enzyme Reagents
Imidazole buffer (10 mM, pH 7.7)
Phosphocreatine (30 mM)
N-acetylcysteine (20 mM)
Magnesium acetate (10 mM)
Glucose (20 mM)
Glucose-6-phosphate dehydrogenase 1.5 KU/L
Hexokinase 2.5 KU/L
EDTA, ADP, and NADP (2 mM each)
AMP (5 mM)
33.5 Procedure
Keep enzyme reagent at 37
C before use. Take 1 ml of this enzyme reagent in a
thermostated cuvette; add 0.05 ml of diluted serum/plasma, mix thoroughly, and
incubate exactly for 5 min at 37
C and then read absorbance at 30 s intervals for
further 3 min.
33.6 Calculation
CK-MB activity/L of serum (IU/L)
¼ ΔOD=min 6752 dilution factor
where, factor 6752 is obtained as:
132 33 To Measure Activity of Creatine Kinase in Serum
138.
¼
total volume incuvette
molar extinction coefficient of NADPH
ð Þ volume of serum used ml
ð Þ
¼
1:05
6:22 103
0:05
¼ 3376
Note If we use an antibody against CK-M, we get value of only CK-B from this
enzyme. So to get activity of CK-MB, multiply value 3376 with factor 2 (i.e.,
3376 2 ¼ 6752). If we follow the above process without CK-M antibody, then
value obtained will be for total CK activity. Calculation of CK-MB % is used to
predict the occurrence of myocardial infarction. CK-MB % is calculated as:
CK-MB% ¼
CK-MB IU=L
TotalCKIU=L
100
33.7 Clinical Significance
Normal range of CK-MB activity is 24–195 IU/L in males and 24–170 IU/L in
females. The total CK activity range is 60–400 U/L in males and 40–150 U/L in
females. The increase in CK activity is mainly caused by skeletal muscle disease,
i.e., muscular dystrophy, myocardial infarction, and cerebrovascular damages. Other
factors like polymyositis, viral myositis, and hypothyroidism also increase CK
levels. The increase in the CK activity (particularly CK2 or MB isoenzyme) is
observed within 6–8 h after onset of myocardial infarction. The activity reaches to
maximum levels after 12–24 h and comes to normal after 3–4 days. Increase in levels
of both total CK activity and CK-MB activity can be observed in the serum of
patients suffering myocardial infarction or after physical exercise. The increase is not
observed in heart failure and coronary insufficiency. The CK-MB % less than 5.5%
indicates probability of no myocardial infarction or myocardial infarction occurred
in less than 4–6 h prior to sample collection. The CK-MB % between 5.5 and 20%
indicates most probable cause of myocardial infarction or myocardial damage due to
cardiac catheterization.
33.7 Clinical Significance 133
139.
Analysis of CerebrospinalFluid for Proteins
and Sugars 34
34.1 Theory
Cerebrospinal fluid (CSF) is a clear and colorless fluid that occurs between the layers
pia mater and arachnoid mater covering central nervous system. CSF is formed by
secretory activities of the choroid plexus, the vascular structure lying within the
ventricles of brain. CSF primarily acts as a water shock absorber and also acts as a
carrier of nutrients and waste products between the blood and the central nervous
system. The volume of CSF formed is about 100–250 ml in adults in 24 h. The
composition of CSF is same to that of brain extracellular fluid. The ionic composi-
tion for CSF is similar to the plasma for some components but differ for many other
substances. Generally the composition of sodium, chloride, and magnesium in CSF
is same or greater than serum, but potassium, calcium, and glucose are lower than
serum. CSF glucose concentration is 60% of serum.
Note After drawing the CSF sample, the analysis of glucose and proteins should be
carried out immediately. Otherwise, the specimen must be stored at 20
C which is
stable for 3 days. Glucose will be rapidly destroyed in the absence of preservatives.
34.2 Analysis of Proteins in CSF
34.2.1 Pyrogallol Dye-Binding Method
34.2.1.1 Principle
Protein molecules present in CSF bind quantitatively with pyrogallol red-molybdate
complex at pH 2.0 to form a violet-colored complex, which is measured at 600 nm.
34.2.1.2 Reagents
1. Pyrogallol red dye: To prepare the dye, dissolve 10 mg disodium molybdate,
134 mg sodium oxalate, 5.9 g succinic acid, and 430 mg sodium benzoate in
# Springer Nature Singapore Pte Ltd. 2018
V. Kumar, K. D. Gill, Basic Concepts in Clinical Biochemistry: A Practical Guide,
https://doi.org/10.1007/978-981-10-8186-6_34
135
140.
about 850 mlof distilled water. Then add 25 mg of pyrogallol red dye, and mix
well to dissolve it completely. Make the final volume to 1 litre with distilled
water. Store in an amber bottle.
2. Working standard: Prepare 1 g/dl BSA stock. Then prepare dilutions of BSA
with 20, 40, 60, 80, and 100 mg/dl in normal saline.
34.2.1.3 Procedure
Take a set of seven test tubes, and label as blank, standard (S1–S5), and test for CSF
(Ts). Add 1 ml of standard with concentrations 20, 40, 60, 80, and 100 mg/dl in tubes
labelled as S1 to S5. To blank tube, add 1 ml of normal saline. In test (Ts), add 1 ml of
CSF. Then add 3 ml of pyrogallol red in each tube. Mix well and incubate at 25
C for
15 min. Read absorbance at 600 nm.
34.2.1.4 Calculations
Plot a graph between amount of protein at x-axis and absorbance at y-axis. Extrapo-
late protein concentration of given CSF sample from the graph. The protein concen-
tration can also be calculated by using equation
Amount of protein inCSF mg=dl
ð Þ ¼
ODof test amount of standard 100
ODof standard volume of sample ml
ð Þ
34.2.2 Turbidimetry Method
34.2.2.1 Principle
Proteins present in CSF are precipitating with sulfosalicylic acid, and protein amount
is measured by comparing the absorbance of the turbidity at 640 nm with that of
protein standards.
34.2.2.2 Reagents
1. Normal saline: Prepare 0.9% (w/v) NaCl.
2. Sulfosalicylic acid (3 g/dl): Dissolve 3 g sulfosalicylic acid in a final volume of
100 ml distilled water. Reagent is stable for 6 months if stored at 25–35
C in an
amber-colored bottle.
3. Stock standard: Prepare 1 g/dl BSA.
4. Working standard: Prepare dilutions of BSA with 20, 40, 60, 80, and 100 mg/dl
in normal saline.
34.2.2.3 Procedure
Take a set of seven test tubes, and label as blank, standard (S1–S5), and test for CSF
(Ts). Add 1 ml of standard with concentrations 20, 40, 60, 80, and 100 mg/dl in tubes
labelled as S1 to S5. To blank tube, add 1 ml of normal saline. In test, add 1 ml of
CSF. Then add 4 ml of sulfosalicylic acid in each tube. Mix and incubate the
136 34 Analysis of Cerebrospinal Fluid for Proteins and Sugars
141.
contents for 5min at room temperature. Read absorbance at 640 nm. Calculate
protein amount in CSF sample as given for pyrogallol red dye method.
34.3 Analysis of CSF Glucose
Glucose determination in CSF is carried out similar to blood glucose estimation.
34.4 Clinical Significance
Normal protein levels in CSF are in range of 15–60 mg/dl. In normal conditions,
albumin is main protein present in CSF, but it may contain globulins also in many
diseases. The increased permeability of capillary endothelial barrier due to bacterial,
viral, or fungal meningitis, multiple sclerosis, and cerebral infarction will increase
CSF proteins. An increase in total CSF proteins is due to breakdown of blood-brain
barrier usually as a consequence of an inflammatory reaction or obstruction in flow
of CSF. In acute meningitis, polyneuritis, and tumors such as acoustic neuroma, the
protein levels in CSF increase up to 0.4 g/dl. CSF/serum albumin index reveals the
intactness and impairment of blood-brain barrier.
CSF=serum albumin index ¼
CSFalbumin inmg=dl
Serum albumin in g=dl
An index value of 9 is considered with an intact barrier. Value of 9–14 is
interpreted as slight impairment while index of 14–30 as moderate impairment. An
index of above 30–100 indicates severe impairment, while values greater than
100 show complete breakdown of barrier.
Normal CSF glucose range is 45–80 mg/dl. Disease conditions like tuberculosis,
benign lymphocytic chronic meningitis, hypoglycemia, and metastatic tumors of
meningitis cause decrease in CSF glucose levels. In bacterial meningitis, the glucose
levels may disappear completely, and in tuberculosis meningitis it is usually between
10 and 40 mg/dl. Increased CSF glucose is observed in diabetes mellitus, encephali-
tis, brain tumors, and cerebral abscess.
34.4 Clinical Significance 137
142.
To Measure LipidProfile in Serum Sample
35
Lipids are organic substances relatively insoluble in water but soluble in organic
solvents and which are related to fatty acids. They are conc. storage form of energy
as well as structural components of biological membranes. The main lipids present in
plasma are cholesterol, triglycerides, phospholipids, and non-esterified fatty acids.
Lipids are transported in plasma and other body compartments in the form of
lipoproteins. The protein part of lipoprotein is called as apolipoproteins. Each
lipoprotein has a specific and relative constant composition of apolipoprotein. The
apolipoprotein plays an important role in lipid transport by activating or inhibiting
enzymes involved in lipid metabolism and recognizing cell membrane surface
receptors. The major lipoproteins are chylomicrons, very low-density lipoprotein
(VLDL), low-density lipoprotein (LDL), and high-density lipoprotein (HDL). A
lipid profile typically includes the estimation of total cholesterol, HDL, LDL,
VLDL, and triglycerides.
35.1 Sample Requirement
Serum or plasma sample (fasting) can be used for lipid profile analysis. A random
sample can also be used if cholesterol alone has to be analyzed.
35.2 Total Cholesterol Estimation
35.2.1 Principle
Cholesterol esterase enzyme hydrolyzes cholesterol ester to free cholesterol and free
fatty acids. In the presence of oxygen, free cholesterol is oxidized by cholesterol
oxidase to form cholesten-4-ene-3-one and H2O2. The peroxidase enzyme splits
H2O2 to water and oxygen; the oxygen thus formed oxidize phenol in presence of
# Springer Nature Singapore Pte Ltd. 2018
V. Kumar, K. D. Gill, Basic Concepts in Clinical Biochemistry: A Practical Guide,
https://doi.org/10.1007/978-981-10-8186-6_35
139
143.
4-aminophenazone to formred quinone imine dye. The color produced is measured
at 520 nm and compared with that of cholesterol standard.
35.2.2 Reagents
1. Cholesterol reagent composition
Phosphate buffer (100 mM, pH 6.5)
4-aminophenazone (0.25 mM)
Phenol (5 mM)
Peroxidase (5 KU/L)
Cholesterol esterase (150 U/L)
Cholesterol oxidase (100 U/L)
Sodium azide (0.05%)
2. Cholesterol standard – 200 mg/dl
35.2.3 Procedure
Take three test tubes, and label as blank, standard (S), and test (T). Pipette 1 ml
cholesterol reagent to all tubes, and add 20 μl serum sample in the tube T. Then add
20 μl of 200 mg % cholesterol standard into the tube labelled as “S.” Mix and
incubate tubes at 37
C for 5 min and measure absorbance at 530 nm against blank.
Calculate cholesterol amount in given sample.
35.2.4 Calculations
Calculate total cholesterol amount in serum sample by using equation
Total cholesterol mg=dlserum
ð Þ ¼
ODof test amount of standard 100
ODof standard volume of sample ml
ð Þ
35.2.5 Precautions
1. Do not use lipemic or grossly lysed serum samples for the investigation.
2. Fasting blood sample is preferable.
3. If cholesterol value is more than 750 mg/dl, dilute the sample, and repeat the test.
4. Store the reagents at 2–8
C.
140 35 To Measure Lipid Profile in Serum Sample
144.
35.3 Triglycerides Estimation
Triglyceridesare esters of glycerol possessing usually three different fatty acids. The
widely distributed fats and oils in plants and animals are chemically triglycerides,
and they contribute about 95% of adipose tissue. Triglycerides are transported in
plasma, mostly in the form of chylomicrons and VLDL.
35.3.1 Principle
Lipases split triglycerides into glycerol and fatty acids. Glycerol kinase hydrolyzes
glycerol in the presence of ATP to form glycerol-3-phosphate and ADP. Glycerol-3-
phosphate oxidase enzyme splits glycerol-3-phosphate in the presence of O2 to
dihydroacetone phosphate and H2O2. Peroxide enzyme splits H2O2 to water and
oxygen. The oxygen thus formed will oxidize 4-chlorophenol in the presence of
4-aminoantipyrine to form red quinone imine, which is measured at 520 nm and
compared with that of triglyceride standard.
35.3.2 Reagents
1. Buffer solution
PIPES buffer (50 mM, pH 7.5)
4-chlorophenol (5 mM)
Magnesium ions (4.7 mM)
ATP (1 mM)
Lipases (1 U/ml)
Peroxidase (0.5 U/ml)
Glycerol kinase (0.4 U/ml)
Sodium azide (0.05%)
2. Enzyme reagent
4-amineantipyrine (0.4 mM)
Glycerol-3-phosphate oxidase (1.5 U/ml)
Sodium azide (0.095%)
35.3 Triglycerides Estimation 141
145.
3. Working triglyceridereagent
Add 250 μl of enzyme reagent to 30 ml of buffer solution. Mix gently, and keep the
reagent for at least 10 min at room temperature before use. The working reagent is
stable for 6 weeks at 2–8
C or for 3 days at 15–25
C when protected from light.
4. Triglyceride standard: 200 mg/dl
35.3.3 Procedure
Label three tubes as test (T), standard (S), and blank (B). Then add 10 μl of sample to
the tube labelled as “T.” Add 10 μl of 200 mg/dl triglyceride standard to the tube
labelled as “S.” Add 1 ml of working triglyceride reagent to all the tubes, mix the
contents, and incubate for 5 min at 37
C. Then measure the absorbance of the
samples against the reagent blank within 60 min.
35.3.4 Precautions
1. Lipemic specimen causes turbidity of the sample mixture leading to false eleva-
tion of results.
2. The test is linear up to a triglyceride concentration of 100 mg/dl. Samples with a
higher concentration have to be diluted five times with saline and retested.
Multiply the result by 5.
35.4 HDL Estimation
HDL is a small particle consisting of 50% protein (mostly contain apo A but also
some amount of apo C and apo E), 20% cholesterol (mostly esterified), 30%
phospholipids, and only traces of triglycerides. HDL is often subdivided into
HDL2 and HDL3, varying in density, particle size, composition, and possibly also
physiologic role.
35.4.1 Principle
Chylomicrons, LDL, and VLDL are precipitated from the sample by adding
phosphotungstic acid and magnesium ions to the sample (this precipitating reagent
precipitates all the lipoprotein which has apo B). Centrifugation leaves only the HDL
in the supernatant. The cholesterol content is determined by enzymatic method
(cholesterol oxidase/peroxidase method).
142 35 To Measure Lipid Profile in Serum Sample
146.
35.4.2 Reagents
1. Precipitatingreagent: This contains 0.55 mM phosphotungstic acid and 25 mM
magnesium chloride.
2. Cholesterol reagent: Same as that used in cholesterol estimation.
3. Working precipitating reagent prepared by mixing precipitating reagent four parts
with one part distilled water.
35.4.3 Procedure
Mix 500 μl of working precipitating reagent with 200 μl serum, and allow it to stand
at room temperature for 10 min. Centrifuge this reagent at 4000 rpm for 10 min or at
12000 rpm for 3 min. After centrifugation, separate the clear supernatant within 2 h,
and determine the cholesterol content. The supernatant may be stored up to 5 days at
2–25
C.
Label two tubes as test and blank. Pipette 100 μl of supernatant into the tube
labelled as “test.” Add 100 μl of distilled water into blank tube. Then add 1 ml
cholesterol reagent to both tubes and mix. Now, incubate the tubes at 37
C for 5 min
or room temperature for 10 min. Measure absorbance at 500 nm against blank in a
spectrophotometer, and calculate the HDL cholesterol.
35.4.4 Precautions
1. The sample should be collected from fasting patient and free from hemolysis.
2. After precipitation the supernatant should be clear and estimate the HDL choles-
terol within 2 h after precipitation with enzymatic method only.
3. Serum from the blood clot should be separated as rapidly as possible. HDL
cholesterol remains stable in serum for 6 days at 2–25
C and 4 months at 20
C.
35.5 LDL Estimation
LDL is also called bad cholesterol since it transports cholesterol from the liver to
peripheral tissues. It constitutes about 50% of the total lipoprotein mass in human
plasma. The particle size is much smaller than that of the triglyceride-rich lipopro-
tein. Cholesterol accounts for about half of LDL mass; most of it is esterified. About
25% of LDL mass is protein, mostly apoB-100 with traces of apo C.
35.5.1 Principle
Firstly, polyvinyl sulfate is added to sample to precipitate the LDL, and the choles-
terol content of HDL, VLDL, and chylomicron is measured. LDL cholesterol is
35.5 LDL Estimation 143
147.
calculated on thebasis of difference between total cholesterol levels of serum and the
cholesterol levels in the supernatant after centrifugation.
35.5.2 Reagents
1. LDL-cholesterol precipitant: Stable for 4 weeks at 20–25
C
2. Cholesterol reagent: Same as that used in cholesterol estimation
35.5.3 Procedure
Mix 200 μl of serum with 100 μl of precipitating reagent and allow standing for
15 min at room temperature and then centrifuge at 10000 rpm for 2 min or for 15 min
at 1500 rpm.
Take two test tubes, and mark them as test and blank. Add 25 μl of supernatant in
tube labelled as test and 25 μl of distilled water in blank tube. Add 1 ml of cholesterol
reagent to these tubes, mix, and incubate at 37
C for 5 min or room temperature for
10 min. Measure absorbance at 500 nm against blank in a spectrophotometer, and
calculate the cholesterol value in the supernatant. From total cholesterol value, the
value obtained in the supernatant is subtracted to get the LDL cholesterol value.
LDL ¼ HDL þ
Triglycerides
5
Here triglyceride/5 gives VLDL value.
35.6 Clinical Significance
35.6.1 Cholesterol Levels
A cholesterol value below 200 mg/dl is always considered desirable and indicates a
low risk of heart disease. Cholesterol value above 240 mg/dl is considered high risk.
Cholesterol is high during pregnancy and up to 6 weeks after the baby is born. Some
drugs like anabolic steroids, epinephrine, oral contraceptives, and vitamin D are
known to increase cholesterol levels.
144 35 To Measure Lipid Profile in Serum Sample
148.
35.6.2 LDL Values
LDLcholesterol below 100 mg/dl is desirable. LDL greater than 150 mg/dl indicates
increased risk to cardiovascular diseases. Out of all the forms of cholesterol in the
blood, LDL levels are considered the most important factor in determining risk of
heart diseases.
35.6.3 HDL Values
Normal range of HDL cholesterol is 30–60 mg/dl in the human blood. HDL less than
40 mg/dl indicates high risk of heart disease. HDL is called good cholesterol since it
transports cholesterol from peripheral tissues for its degradation, and hence it
removes excess cholesterol from tissues.
35.6.4 Triglycerides
A normal level of triglycerides is less than 150 mg/dl in fasting condition. It is
unusual to have high triglycerides without having high cholesterol. High levels of
triglycerides increase the risk of developing pancreatitis.
35.6 Clinical Significance 145
149.
To Estimate Sodiumand Potassium
in Serum by Using Flame Photometer 36
36.1 Theory
Sodium is the major cation of extracellular fluid. Sodium is important for the
maintenance of osmotic pressure, fluid balance, and acid-base regulation. The
common salts used in cooking and food intake are the major sources of sodium.
The sodium is lost from the body via excretion through kidneys and excessive
sweating. About 50% of body sodium is present in bones followed by 40% in
extracellular fluid and 10% in soft tissues. Both extracellular and intracellular
sodium are the exchangeable form of sodium. The intracellular sodium contributes
about 10 mmol/L, and the extracellular form contributes about 135–145 mmol/L.
Sodium is also involved in normal muscle irritability, cell permeability, and mainte-
nance of heartbeat. In contrast to sodium, potassium is present mainly in intracellular
fluid. It is present majorly in RBCs (23 times higher than plasma). Like sodium,
excess potassium is also excreted by kidneys. Normal potassium concentration in
plasma is in range of 3.5–5.5 mEq/L. It is necessary for regulation of intracellular
osmotic pressure, water balance in cells, transmission of nerve impulse, etc.
36.2 Specimen Type, Collection, and Storage
Serum sample is used. Sodium and potassium present in serum remain stable for
several hours at 25–35
C and for almost 3 months if stored at 20
C. Lithium
heparin may be preferred as an anticoagulant, but anticoagulants containing sodium
or potassium salts should be avoided. Hemolysis will increase potassium levels.
Dilute the standards and serum sample 1:100 using distilled water before use.
# Springer Nature Singapore Pte Ltd. 2018
V. Kumar, K. D. Gill, Basic Concepts in Clinical Biochemistry: A Practical Guide,
https://doi.org/10.1007/978-981-10-8186-6_36
147
150.
36.3 Principle
“The testsolution is passed as fine spray into the flame. The flame evaporates the
sample and dissociates the salts to give neutral ions. The heat energy of the flame
excites some of these atoms which cause electrons to move to a higher energy level.
The electrons are unstable in the excited state and hence return to lower energy level.
In this process, the electrons will emit a light of a fixed wavelength of electromag-
netic spectrum. The amount of light emitted is directly proportional to the number of
atoms undergoing in excited state. The number of electrons in excited state in turn is
directly related to the concentration of the substance in the sample. Sodium emits
yellow light of 589 nm, whereas potassium emits violet light of wavelength maxi-
mum 404.4 nm and 765.9 nm (Fig. 36.1).
36.4 Reagents
1. Stock sodium 1000 mmol/L: Dissolve 5.85 g of NaCl in final volume of 100 ml
distilled water.
2. Stock potassium 100 mmol/L: Dissolve 746 mg of dried KCl in final volume of
100 ml distilled water.
Fig. 36.1 Schematic representation of flame photometer
148 36 To Estimate Sodium and Potassium in Serum by Using Flame Photometer
151.
3. Working standards:Mixed working standards for sodium and potassium are
prepared as follows:
(a) Sodium/potassium (110/2 mEq/L): This standard is prepared by
mixing 11 ml of stock sodium and 2 ml of stock potassium standards
in 87 ml distilled water. The final 100 ml mixture contains 110 mEq of
sodium and 2 mEq of potassium.
(b) Sodium/potassium (140/4 mEq/L): To prepare the standard, take 14 ml
of stock sodium and 4 ml of stock potassium standards in a flask, and add
82 ml distilled water to make final volume to 100 ml.
(c) Sodium/potassium (170/8 mEq/L): Take 17 ml of stock sodium and
8 ml of stock potassium standards in a flask, and add 75 ml distilled
water to prepare standard.
36.5 Procedure
1. The flame photometer is switched on, and appropriate filter is selected with the
help of filter selector wheel.
2. Put the air compressor on, and adjust air pressure between 0.4 and 0.6 kg/cm2
.
3. Introduce glass-distilled water through atomizer.
4. Then open the gas cylinder; the flame is ignited after removing the trapper at the
rear of the flame photometer. Adjust it so that flame is divided into fine sharp
cones.
5. Make zero adjustment by introducing distilled water.
6. Aspirate mixed Na+
and K+
standard (110/2 mEq/L), and adjust knob meant for
sodium to digits 110 and by knob meant for potassium to digit 2.
7. Introduce standard 140/4 mEq/L. The digital display will show exact reading if
standards are correct.
8. Then aspirate third standard 170/8 mEq/L for sodium and potassium, and adjust
reading.
9. Now introduce the diluted test serum sample, and record readings for sodium and
potassium.
36.6 Clinical Significance
Normal sodium levels in serum are 135–145 mmol/L, while serum potassium level is
3.5–5.0 mmol/L. Increase in sodium concentration more than 145 mmol/L is called
hypernatremia. Hypernatremia is caused by hyperactivity of adrenal cortex, loss of
water due to dehydration, high administration of sodium salts, and steroid therapy.
The decrease in serum sodium levels (135 mmol/L) is called hyponatremia. It may
occur due to prolonged vomiting, diarrhea, severe polyuria, diuretic medication, and
metabolic acidosis.
36.6 Clinical Significance 149
152.
When the plasmapotassium concentration exceeds 5.5 mmol/L, the condition is
called hyperkalemia. Higher potassium levels cause mental confusion, weakness,
numbness, slowed heart rates, and vascular collapse. Very high potassium levels are
fatal. Hyperkalemia occurs in dehydration, diabetic ketoacidosis, massive intravas-
cular hemolysis, and violent muscular activity. The plasma potassium levels less
than 3.5 mmol/L lead to hypokalemia. Hypokalemia is caused by prolonged diar-
rhea, vomiting, and also in renal tubular acidosis. The symptoms include muscle
weakness, irritability, paralysis, and cardiac arrest.
150 36 To Estimate Sodium and Potassium in Serum by Using Flame Photometer
153.
To Perform Radioimmunoassay
37
Radioimmunoassay(RIA) is a highly sensitive and specific analytical tool used for
detection of antigen or antibody in a sample. It was developed in the late 1950s by
Rosalyn Yalow and Solomon A. Berson for estimation of insulin in human serum.
37.1 Principle
Radioimmunoassay combines the principles of radioactivity of isotopes and immu-
nological reactions of antigen and antibody. The principle is based on the competi-
tion between labelled and unlabelled antigens to bind with antibody to form antigen-
antibody complexes. The test is employed to determine the concentration of
unlabelled antigens. The antibody specific for antigen is incubated with unlabelled
antigen in the presence of high concentration of antigens labelled with isotope (say I
131
). The presence of both labelled and unlabelled antigens in the sample mixture
creates a competition between these antigens to bind with antibody. Initially labelled
antigens will bind in more amounts due to their high concentration present in sample.
Then amount of unlabelled antigen is increased progressively in the sample. As the
concentration of unlabelled antigens increases, they will replace the labelled antigens
from their already existing antigen-antibody complex. Thus, the concentration of
labelled antigens bound with antibody will be inversely related to unlabelled
antigens, i.e., the higher is the concentration of labeled antigens bound with anti-
body, the less is the concentration of unlabelled antigens or vice versa. The concen-
tration of labelled antigen can be determined by precipitating them and determining
radioactivity present in this antigen-antibody complex. A standard curve is drawn
using different concentrations of unlabelled antigens and same quantities of antibody
and labelled antigens. From this plot the amount of unlabelled antigens present in the
test sample may be determined precisely (Fig. 37.1).
# Springer Nature Singapore Pte Ltd. 2018
V. Kumar, K. D. Gill, Basic Concepts in Clinical Biochemistry: A Practical Guide,
https://doi.org/10.1007/978-981-10-8186-6_37
151
154.
37.2 Advantage
Advantage ofRIA is its high sensitivity. It can measure up to few pictograms of
antigens. The specificity of the assay depends upon the specificity of antiserum.
37.3 Applications
Radioimmunoassay is used to estimate hormones and proteins possessing antigenic
properties. These days, applications of RIA have been extended for detection of
peptides, steroid hormones, drugs, neurotransmitters, antibodies, and structural
proteins. It is also important for blood bank screening for the hepatitis virus, early
cancer detection, measurement of growth hormone levels, and diagnosis and treat-
ment of peptic ulcers.
Fig. 37.1 Principle of RIA
152 37 To Perform Radioimmunoassay
155.
To Perform Enzyme-LinkedImmunosorbent
Assay 38
Enzyme-linked immunosorbent assay (ELISA) is an immunoassay that combines the
specificity of antibody and antigen usually detected in presence of enzyme conju-
gated with antibody. The enzyme linked with the antibody reacts with specific
substrate to produce colored product which is related to antigen or antibody
concentration.
38.1 Principle
Enzyme-linked immunosorbent assay is based on immunochemical principles of
antigen-antibody reaction. The antibody to be determined is coated on an inert
surface. The sample containing protein is applied on antibody-coated surface. The
protein-antibody complex is then reacted with second antibody specific to protein.
This second antibody is enzyme labelled (alkaline phosphatase, horseradish peroxi-
dase, or β-galactosidase). The unbound enzyme-linked second antibody is washed,
and enzyme activity is determined by adding suitable substrate specific to enzyme
bound with second antibody (i.e., diaminobenzidine for horseradish peroxidase).
This gives a colored product that is directly proportional to the protein being
estimated (Fig. 38.1).
The above mentioned method is called indirect ELISA. Other variants of ELISA
are also in use.
38.2 Sandwich ELISA
Sandwich ELISA is named so because the analyte to be measured is bound between
two primary antibodies – the capture antibody and the detection antibody. In this
process, the antibody is immobilized on microwell plate, and the sample containing
antigen is added to this well that reacts with immobilized antibody. The well is
washed to remove unbound antigen, and second antibody that has been conjugated
# Springer Nature Singapore Pte Ltd. 2018
V. Kumar, K. D. Gill, Basic Concepts in Clinical Biochemistry: A Practical Guide,
https://doi.org/10.1007/978-981-10-8186-6_38
153
156.
with enzyme isadded. The substrate specific to enzyme is added to well, and colored
product formed is measured. The sandwich ELISA is useful to detect antigen
concentration.
38.3 Competitive ELISA
Competitive ELISA is also used to measure antigen concentration. The process
involves the incubation of antibody in a sample solution containing antigen. This
antigen-antibody mixture is then transferred to a microplate well coated with anti-
gen. The assay is based on the fact that the presence of more number of antigens in
the sample will bind with more number of antibodies, and hence available free
antibody concentration that can bind with the antigen-coated well will be less. The
concentration of primary antibody that binds with antigen in the well can be detected
by addition of enzyme-conjugated secondary antibody specific for the isotype of the
primary antibody. The absorbance for this reaction will be inversely proportional to
the concentration of antigen in the original sample.
Fig. 38.1 Principle of
ELISA
154 38 To Perform Enzyme-Linked Immunosorbent Assay
157.
38.4 Direct ELISA
Indirect ELISA, the antigen is immobilized on the microwell plate. Then an
enzyme-labelled primary antibody is added to the well that reacts directly with
antigen. Direct detection ELISA is not a frequently used method but is used
commonly for immunohistochemical staining of tissues and cells.
38.5 Applications of ELISA
Enzyme-linked immunosorbent assay is an important tool to find the presence of
antigen or antibody in a sample. It is used commonly to assay various proteins
including insulin, luteinizing hormone, etc. Indirect ELISA is used for diagnosis of
human immunodeficiency virus. It can also be used for the screening of monoclonal
antibodies. The most commonly used pregnancy test is based on ELISA which
detects human chorionic gonadotropin in urine. It is also being used in food industry
for detection of potential food allergens.
38.5 Applications of ELISA 155
158.
Some Important CaseStudies
39
39.1 Case Studies of Sugar Impairment
Q.1. A diabetic patient on insulin therapy was brought to the hospital in a
semiconscious state. He was sweating profusely and had tremors of hands.
What is the possible diagnosis?
Ans: The possibility is hypoglycemia due to excessive dose of insulin.
Q.2. An apparently healthy man underwent for routine laboratory investigations.
The results showed that his fasting blood sugar level was 85 mg/dl while
urine constituents were normal. However, his postprandial blood sugar after
one-and-half hours of food intake was observed to be 155 mg/dl, and urine
sample at that time was also positive for Benedict’s test. What is the
diagnosis?
Ans: The case symptoms indicate toward renal glycosuria. In renal glycosuria,
glucose is excreted in the urine despite the fact that blood glucose levels are
normal or even low. With normal kidney functions, only very high blood
glucose levels can cause its excretion in urine. So, renal glycosuria suggests
abnormal functioning of the renal tubules. Normal renal threshold for
glucose is 180 mg/dl, but in this case renal threshold is lowered.
Q.3. A 35-year-old female was examined for the laboratory tests. The report
showed that her blood sugar (fasting) was 90 mg/dl and blood sugar (P.P.)
was 168 mg/dl. The urinary analysis showed absence of urine sugar
(fasting), but in postprandial state urine was significantly positive for
sugar. Comment on report.
Ans: In this case, the fasting blood sugar is within normal limits, and urine is
negative for reducing sugars. However, under postprandial condition, the
urine tests positive for sugar although blood sugar is less than the normal
renal threshold for glucose (180 mg/dl). This indicates that renal threshold
for glucose in this patient has been lowered and it is a case of renal
glycosuria.
# Springer Nature Singapore Pte Ltd. 2018
V. Kumar, K. D. Gill, Basic Concepts in Clinical Biochemistry: A Practical Guide,
https://doi.org/10.1007/978-981-10-8186-6_39
157
159.
Q.4. A 45-year-oldman was hospitalized with complain of dizziness and weak-
ness. His random blood sugar was 40 mg. History revealed that he had the
skipped breakfast. What is the probable diagnosis?
Ans: Patient has hypoglycemia, probably due to fasting. Under physiological
conditions, brain derives energy from glucose. Hypoglycemia is considered
when blood glucose levels fall below 60 mg/dl, and symptoms begin at this
concentration of glucose. The brain symptoms appear when glucose level
falls below 50 mg/dl.
39.2 Case Studies of Diabetic Ketoacidosis
Q 1. A 45-year-old male was admitted to hospital in an unconscious state. He
appeared moderately dehydrated with increased pulse rate and acetonemic
breath. The urine analysis report showed presence of high amount of sugar,
and Rothera’s test was positive for ketone bodies. What is the probable
diagnosis?
Ans: Excretion of sugar in urine is accompanied by polyuria, which therefore
causes dehydration. This is a case of diabetic ketoacidosis. High levels of
ketone bodies in blood cause acetonemic breath and unconsciousness.
Q.2. A patient was admitted in the hospital in unconscious state. His blood
glucose level was 290 mg/dl. His urine was positive for both Rothera’s
test and Benedict’s test.
What is the diagnosis?
Ans: High blood glucose levels and presence of ketone bodies in urine indicate
diabetic ketoacidosis which is a life-threatening complication arising due to
diabetes mellitus. Ketone bodies in urine occur due to insulin deficiency and
less utilization of glucose by cells.
Q.3. A young boy was admitted to hospital in a delirious state. The examination
showed that he was breathing rapidly and appeared dehydrated. Laboratory
investigation results showed high blood sugar levels (325 mg/dl) and high
serum K+
(6.5 mEq/L) levels, but serum sodium was normal. Urine test was
positive both for ketone bodies and reducing sugars. Give comment on
diagnosis.
Ans: Increased blood glucose value with presence of sugar and ketone bodies in
urine is indicative of diabetic mellitus. Hyperkalemia is seen in insulin
deficiency as K+
uptake by cells requires insulin.
Q.4. A known diabetic patient was admitted to hospital in a semiconscious state.
He had cellulitis on the right foot. The laboratory investigation on blood
sample showed:
158 39 Some Important Case Studies
160.
Glucose: 375 mg/dl
Urea:85 mg/dl
Creatinine: 2.1 mg/dl
Sodium: 135 mmol/L
Potassium: 5.6 mmol/L
Chloride: 95 mmol/L
Urine was positive for glucose and ketone bodies. Discuss the results.
Ans: This is a case of uncontrolled diabetes mellitus with ketoacidosis. Diabetic
patients with chronic hyperglycemia may have prominent skin and soft
tissue infections. High serum glucose levels may lead to hyponatremia.
Ketosis and acidosis elevate the serum potassium levels by causing a shift
of potassium from the intracellular to the extracellular fluid. Urea and
creatinine are increased due to prerenal acute kidney injury.
Q.5. A 45-year-old woman with symptoms of loss of weight, polyphagia, poly-
dipsia, and polyuria was brought to the hospital. Her laboratory reports
depicted:
Serum glucose (Fasting) – 165 mg/dl
Serum glucose (P.P.) – 225 mg/dl
The urine analysis showed absence of sugar (fasting), but sugar was present
significantly in postprandial stage. Comment on report.
Ans: Fasting and postprandial blood sugar levels are increased above normal
range, while postprandial urine sugar is positive. This indicates diabetes
mellitus. Loss of weight, polyphagia, polydipsia, and polyuria are classical
symptoms of diabetes.
39.3 Case Studies of Calcium and Phosphate Impairments
Q.1. The laboratory investigation report of a 55-year-old woman’s blood sample
revealed high calcium (12.8 mg/dl) and low potassium (2.2 mg/dl) levels.
The alkaline phosphatase activity was 45 KAU. What is the probable
diagnosis?
Ans: Increased calcium and alkaline phosphatase and decrease in phosphorus are
suggestive of hyperparathyroidism.
Q.2. A child was brought to pediatric OPD. He had bowlegs, knock-knees, and
protruding abdomen and had suffered mild convulsions. The serum calcium
level was very low. What is the probable diagnosis?
Ans: Low serum calcium levels lead to soft bones which tend to bend and delay in
walking. Hypocalcemia also causes convulsions. This is a probable case of
rickets.
39.3 Case Studies of Calcium and Phosphate Impairments 159
161.
39.4 Case Studiesof Protein Energy Malnutrition
Q.1. A 3-year-old child was observed to have mild generalized edema, intermit-
tent diarrhea, rough skin, and coarse hair and weakness. Laboratory investi-
gation data showed:
Hemoglobin – 8 mg%
Total proteins (serum) – 4.9 g/dl
Albumin (serum) – 1.7 g/dl
Urine constituents – normal
What is the probable diagnosis?
Ans: Generalized edema, intermittent diarrhea, rough skin, and coarse hair indi-
cate protein-deficient diet intake. This appears to be a case of protein
malnutrition called Kwashiorkor. Kwashiorkor is characterized by very
low serum albumin levels that lead to edema. Low hemoglobin levels
indicate anemia due to dietary deficiency of iron.
Q.2. A 2.5-year-old child with history of poor eating for the last 1 month and
having intermittent diarrhea was brought to the hospital. The physical
examination showed that he was underweight with retarded growth and his
abdomen was distended, liver was moderately enlarged, and generalized
edema was present. The blood analysis showed:
Hemoglobin – 6.2 gm/dl
Total protein – 5.2 gm/dl
Albumin – 1.6 gm/dl
What is the probable diagnosis?
Ans: The child is suffering from protein energy malnutrition (kwashiorkor). The
present case indicates a severe form of malnutrition. The presence of edema,
irritability, dermatitis, enlarged liver with fatty infiltration, inadequate
growth, muscles loss, vomiting, and diarrhea are classical symptoms of
kwashiorkor.
39.5 Case Studies of Gout/Uric Acid
Q.1. A 45-year-old, alcoholic patient was complaining of severe pain in joints
and toes. His laboratory report for blood analysis presented:
Sugar (random) – 88 mg/dl
Uric acid – 9.8 mg/dl
Urea – 40 mg/dl
160 39 Some Important Case Studies
162.
Creatinine – 1.8mg/dl
Comment on report.
Ans: The presented reports show increased uric acid levels in serum. High uric
acid levels indicate gout. In gout, uric acid is deposited in joints leading to
inflammation and pain. Here, increased uric acid in serum does not correlate
with normal creatinine; hence possibility of kidney dysfunction is ruled out.
Q.2. A 1-year-old baby having retarded development and showing habits of lips
and finger biting was brought to hospital. The laboratory investigation of
blood sample revealed very high uric acid levels (9.5 mg/dl), while hemo-
globin, urea, creatinine, and sugar were within normal range. Comment on
the report.
Ans: The clinical features of delayed development and high serum uric acid levels
are suggestive of Lesch-Nyhan syndrome. In this syndrome, the deficiency
of the enzyme hypoxanthine-guanine phosphoribosyltransferase causes high
uric acid levels in body fluids. The combination of increased synthesis and
decreased utilization of purines leads to high uric acid levels, a condition
called hyperuricemia.
Q.3. A 45-year-old man was complaining of severe pain in the right toe. He did
not reveal any history of pain in any joints previously. He had been binge
drinking the previous night. On examination, he had fever and was in
distress due to the pain. The right toe was swollen, warm, red, and very
tender. Synovial fluid analysis revealed needle-shaped crystals under
microscopy. Serum uric acid level was 8.9 mg/dl, and 24 hr urinary uric
acid excretion was 500 mg/dl. Random blood sugar was 140 mg/dl. Other
tests were normal. What is the likely diagnosis?
Ans: The likely diagnosis is gouty arthritis. The pain in the big toe is precipitated
by alcohol intake, which is a typical feature of gouty arthritis. Serum uric
acid and synovial fluid analysis results are confirmatory. Gout is
characterized by hyperuricemia. Monosodium urate crystals are deposited
in joints and connective tissues, and there is risk of uric acid nephrolithiasis.
Acute gouty arthritis can be triggered by trauma, stress, vascular occlusions,
surgery, drugs, and purine-rich food including alcohol. Hyperuricemia can
be due to increased production or reduced excretion of uric acid or a
combination of these two.
Q.4. A 40-year-old male consumed much food and alcohol during dinner. The
next morning, he felt excruciating pain in the ankle. On examination, he had
fever. His ankle joint was red and swollen and was very tender and stiff. No
other joints were involved. Lymph glands were normal. The laboratory data
was:
Blood glucose: 120 mg/dl
Blood urea: 40 mg/dl
Serum creatinine: 1.2 mg/dl
Serum uric acid: 10.5 mg/dl
39.5 Case Studies of Gout/Uric Acid 161
163.
Urine pH: 6.0
Whatis the most probable diagnosis?
Ans: The likely diagnosis is gouty arthritis. Gout classically afflicts the big toe,
but other joints may also sometimes be affected.
39.6 Case Studies of Liver Functions
Q.1. A 48-year-old, fat female was admitted to hospital with complain of abdom-
inal pain, vomiting, nausea, and loss of appetite. She passed dark yellow
urine and clay-colored stool. The laboratory blood examination revealed:
Total bilirubin – 12 mg/dl
Indirect (unconjugated) bilirubin – 2.2 mg/dl
Direct (conjugated) bilirubin – 9.8 mg/dl
ALT – 105 U/L
AST – 80 U/L
ALP – 160 U/L
Urine was positive for bile salts and bile pigments. Urobilinogen was absent
in urine. Comment on report.
Ans: The data shows that total bilirubin and conjugated bilirubin are very high as
compared to unconjugated bilirubin. Serum ALT and AST levels are highly
increased (ALT levels are higher than AST). This is a case of obstructive
jaundice. In this case, ALP is also increased significantly. Increase in serum
ALP activity is usually related to hepatobiliary obstruction. In hepatobiliary
disease, the concentration of ALP is increased due to defect in excretion of
ALP through bile. ALP mainly produced in the bone tissue reaches to the
liver and excreted through bile. The presence of conjugated bilirubin in the
urine and excretion of urobilinogen-free urine suggest the case of obstructive
jaundice. When complete obstruction of the bile duct occurs, urobilinogen is
absent in urine because bilirubin is not transported to the intestine. Nor-
mally, bilirubin is converted to urobilinogen by bacterial action in the
intestine, and a portion of it is absorbed by enterohepatic circulation.
Urobilinogen is also converted to urobilin in the kidneys and excreted.
The pale stools and dark urine also confirm obstructive or posthepatic
cause since feces color is contributed from bile pigments.
Q.2. A 45-year-old fat woman complained of recurrent pain in the abdomen
which often aggravated by fatty food intake. She had very high blood
bilirubin levels. The urine examination showed the presence of bile
pigments and bile salts, but urobilinogen was absent. What is the most likely
cause?
162 39 Some Important Case Studies
164.
Ans: This isa case of obstructive jaundice due to cholelithiasis. Obstructive
jaundice is characterized by the absence of urobilinogen in urine as
explained above. In present case, the obstruction of bile ducts by gallstones
may have caused the absence of urobilinogen in urine.
Q.3. A 55-year-old man diagnosed with jaundice was brought to hospital. He had
complain of weight loss and passed pale stools. The laboratory investigation
showed:
Bilirubin – 18 mg/dl
ALT – 95 U/L
AST – 75 U/L
ALP – 330 U/L
Serum glucose – 78 mg/dl
Urine was positive for bile salts and bile pigments. Give the probable
diagnosis.
Ans: Here bilirubin levels are very high with moderate elevation of AST and ALT
and greater increase of ALP. The urine shows the presence of bile salts and
bile pigments. All these diagnosis indicate obstructive jaundice.
Q.4. A young boy was brought to the hospital with history of vomiting, nausea,
loss of appetite, and abdominal pain. The laboratory data showed:
Bilirubin total – 7.5 mg/dl
Indirect bilirubin – 6.5 mg/dl
Direct bilirubin – 4.2 mg/dl
ALT – 78 U/L
AST – 88 U/L
ALP – 110 U/L
Urine was positive for bile pigments and urobilinogen and very dark in
color. Comment on report.
Ans: Bilirubin, AST, ALT, and ALP levels are significantly increased. Urine is
positive for bile pigments and urobilinogen. So, present case indicates
hepatocellular or hepatic jaundice. In hepatic jaundice, levels of both conju-
gated and unconjugated bilirubin rise in the blood. The abnormally high
amount of conjugated bilirubin and bile salts leads to their excretion in the
urine. This conjugated bilirubin provides the urine the dark color.
Q.5. A 35-year-old man with diagnosed jaundice and history of drug and alcohol
abuse was brought to hospital. He showed pitting edema. The blood investi-
gation report revealed:
Total protein – 8.5 g/dl
Albumin – 2.0 g/dl
Globulins – 5.8 g/dl
Bilirubin – 6.5 mg/dl
39.6 Case Studies of Liver Functions 163
165.
ALT – 305U/L
AST – 210 U/L
ALP – 175 U/L
Blood urea nitrogen – 6.0 mg/dl
Urine was positive for bilirubin. Comment on report.
Ans: The laboratory data presents with abnormal liver function tests. The signifi-
cant elevation of AST and ALT reflects chronic liver disease. In acute liver
disease, transaminase levels are much higher but remain moderately higher
in chronic liver disease due to destruction of hepatocytes. Low value of
albumin and blood urea nitrogen suggests impaired synthesis due to loss of
hepatocytes. Overall, it is a probable case of chronic hepatitis.
Q.6. A case with the following laboratory results was presented in a meeting:
Serum bilirubin – 9.0 mg%
Conjugated bilirubin – 0.5 mg%
Unconjugated bilirubin – 8.5 mg%
ALT – 30 U/L
AST – 35 U/L
ALP – 10 KAU
Urine showed negative test for bile salts and bile pigments but positive (++)
for urobilinogen. Feces stercobilinogen was also positive. Comment on
the case, and give the provisional diagnosis.
Ans: This is a case of hemolytic jaundice caused by high destruction of red blood
cells. In prehepatic or hemolytic jaundice, the unconjugated bilirubin is
increased due to increased destruction of red blood cells, and the liver is
unable to cope with the increased demand for conjugation. Hence, deposi-
tion of this unconjugated bilirubin occurs into various tissues leading to a
jaundiced appearance. Urine is deprived of bilirubin because unconjugated
bilirubin is not water-insoluble, so increased urine urobilinogen without
bilirubin in urine is suggestive of hemolytic jaundice. The increased hemo-
lysis of blood cells produces high bilirubin leading to the increased excretion
of urobilinogen in urine.
Q.7. A 30-year-old man was diagnosed with the presence of gallstones. He had
severe abdominal pain also. The laboratory investigations showed:
RBCs: 3 million/cu mm
Reticulocytes: 14%
Hemoglobin: 8.2 g/dl
Serum bilirubin (total): 2.6 mg/dl
The urine was positive for urobilinogen. Comment on probable diagnosis.
Ans: The case indicates severe hemolytic anemia, leading to bilirubinemia. Excre-
tion of large quantities of bilirubin through bile leads to gallstones, made up
of bilirubin. Decreased life span leads to active generation of RBCs, hence
increased reticulocytes.
164 39 Some Important Case Studies
166.
39.7 Case Studiesof Kidney Functions
Q.1. A child having history of fever and abdominal pain since few days was
examined by doctors. He passed red-colored urine since 3 days and also
having pedal edema. His blood examination results were:
Urea – 95 mg/dl
Creatinine – 4.4 mg/dl
Cholesterol – 230 mg/dl
Total proteins – 5.8 g/dl
Albumin – 2.2 g/dl
The urine analysis showed the presence of albumin and blood. Comment on
report.
Ans: The increased serum urea and creatinine levels indicate compromised kidney
functions. Serum total proteins and albumin levels are decreased, while urine
has albumin and blood. This indicates acute glomerulonephritis. The dam-
aged kidney glomeruli can result in nephritic syndrome. Nephritic syndrome
symptoms include low blood albumin causing edema. Fever and abdominal
pain are due to kidney dysfunction.
Q.2. An old man with history of diabetes since 20 years was admitted to hospital.
His urine output was very low and blood pressure was 220/100 mmHg. The
blood investigation results were:
Sugar (random) – 300 mg/dl
Total proteins – 5.0 g/dl
Urea – 200 mg/dl
Creatinine – 12 mg/dl
Cholesterol – 290 mg/dl
Na+
125 mEq/L
K+
5.6 mEq/L
Urine was tested positive for albumin. Comment on report.
Ans: This is a case of chronic renal failure arising from diabetic nephropathy due to
chronic primary hyperglycemia. Increased urea and creatinine levels and pro-
teinuria indicate renal damage. Proteinuria is associated with renal injury,
accompanied by diabetic nephropathy. The renal damage may increase perme-
ability of glomeruli further allowing plasma proteins to escape into the urine.
Chronic renal damage also elevates blood pressure. Decrease in sodium
(hyponatremia) and increased potassium (hyperkalemia) levels further confirm
diagnosis.
Q.3. A 6-year-old boy with complain of fever and facial edema was brought to
hospital. He appeared to be lethargic and pale. The laboratory blood results
were:
39.7 Case Studies of Kidney Functions 165
167.
Sugar (random) –80 mg/dl
Total proteins – 5.0 g/dl
Albumin – 2.2 g/dl
Urea – 42 mg/dl
Creatinine – 1.9 mg/dl
Cholesterol – 380 mg/dl
Na+
125 mEq/L
K+
6.0 mEq/L
Urine was tested positive for protein and hematuria was present. Comment
on report.
Ans: The laboratory results show that urea and creatinine are near normal while
total protein and albumin are decreased. Urine tests positive for proteins, and
there is significant increase in serum cholesterol. These findings are sugges-
tive of nephritic syndrome that generally occurs in glomerulonephritis. In
glomerulonephritis, the glomerular basement membrane becomes thin, and
there is the presence of small pores in podocytes of the glomerulus. These
pores allow proteins and RBCs to pass into the urine. Nephritic syndrome
also decreases serum albumin levels due to its high excretion in urine.
Q.4. A 50-year-old hypertensive patient with facial and lower limb edema
appearance was admitted to hospital. Laboratory blood analysis results
showed:
Sugar (fasting) – 250 mg/dl
Albumin – 2.2 gm/dl
Cholesterol – 275 mg/dl
Creatinine – 2.4 mg/dl
Urea – 105 mg/dl
Urine examination showed positive Benedict’s test with red precipitate, and
urine proteins were very high. What is the possible diagnosis?
Ans: Proteinuria, hypoalbuminemia, and hypercholesterolemia along with acute
renal failure and edema are the classical presentation of nephrotic syndrome.
Patient has diabetes mellitus (urine positive for reducing sugars) and hyper-
tension, and these may have caused nephrotic syndrome.
Q.5. The blood investigation of a 70-year-old woman is shown below:
Sodium – 125 mmol/L
Potassium – 3.8 mmol/L
Urea 205 mg/dL
Creatinine – 4.4 mg/dL
Calcium 6.2 mg/dL
Phosphate 7.5 mg/dL
Alkaline phosphatase 90 U/L
What is the most probable diagnosis?
166 39 Some Important Case Studies
168.
Ans: Increase inblood urea and creatinine indicates renal failure. The commonest
cause of hyperphosphatemia is renal failure. High phosphate levels in this case
indicate a severe degree of renal insufficiency. High phosphorus interferes
with calcium absorption, resulting in hypocalcemia and renal osteodystrophy.
39.8 Case Studies of Cardiac Functions
Q.1. A 55-year-old man was complaining of chest pain and labored breathing.
The laboratory blood examination report was:
CK – 690 U/L
CK-MB – 88 U/L
AST – 90 U/L
LDH – 785 U/L
Cholesterol – 360 mg/dl
HDL cholesterol – 35 mg/dl
LDL cholesterol – 260 mg/dl
Comment on report.
Ans: In acute myocardial infarction, chest pain is the commonest symptom. Pul-
monary edema is the consequence of damage to the heart limiting the output
of the left ventricle and shortening of breath. Here, the serum levels of CK,
CK-MB, AST, and LDH are increased which suggest myocardial infarction.
The serum cholesterol and LDL cholesterol levels are very high, while HDL
levels are decreased which predispose a person to heart disease.
Q.2. A 58-year-old man with known diabetic history since the last 12 years
underwent laboratory examination. The blood test results showed that his
AST, ALT, urea, and creatinine levels were normal while fasting sugar was
150 mg/dl. The lipid profile was:
Cholesterol – 310 mg/dl
HDL cholesterol – 32 mg/dl
LDL cholesterol – 220 mg/dl
Triglyceride – 310 mg/dl
Comment on report.
Ans: The person has uncontrolled diabetes mellitus. His liver and kidney appear
to be normal as reflected by normal AST, ALT, urea, and creatinine levels.
However, serum cholesterol and LDL cholesterol levels as well as triglycer-
ide levels are high indicating hyperlipidemia. In diabetes, increased lipolysis
due to low insulin and high glucagon levels leads to excessive acetyl CoA
production which is diverted for cholesterol and triglyceride synthesis.
39.8 Case Studies of Cardiac Functions 167
169.
Suggested Readings
1. TietzNW (1995) Clinical guide to laboratory tests, 3rd edn. W.B. Saunders Company,
Philadelphia
2. Wallach J (2007) Interpretation of diagnostic tests, 8th edn. Wolters Kluwer/Lippincott Williams
Wilkins, Philadelphia
3. Chawla R (2014) Practical clinical biochemistry: methods and interpretations, 4th edn. Jaypee
Brothers Medical Publishers (P) Ltd, New Delhi
4. David T, Plummer DT (2004) An introduction to practical biochemistry, 3rd edn. Tata McGraw
Hill Education Pvt. Ltd, New Delhi
5. Basten G (2011) Introduction to clinical biochemistry: interpreting blood results. Ventus Pub-
lishing APS
6. Lehmann CA (1998) Saunders manual of clinical laboratory science, 1st edn. W.B. Saunders
Company, Philadelphia
7. Ramakrishnan S (2012) Manual of medical laboratory techniques, 1st edn. Jaypee Brothers
Medical Publishers (P) Ltd, New Delhi
8. Reinhold JG (1953) Manual determination of serum total protein, albumin and globulin fractions
by Biuret method. In: Reiner M (ed) Standard methods in clinical chemistry. Academic Press,
New York, pp 88–97
9. Mohanty B, Basu S (2006) Fundamentals of practical clinical biochemistry. B. I. Publications,
Pvt. Ltd, New Delhi
# Springer Nature Singapore Pte Ltd. 2018
V. Kumar, K. D. Gill, Basic Concepts in Clinical Biochemistry: A Practical Guide,
https://doi.org/10.1007/978-981-10-8186-6
169