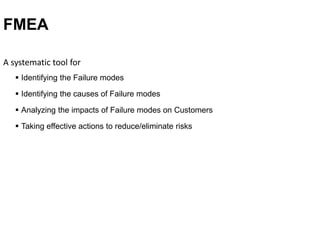
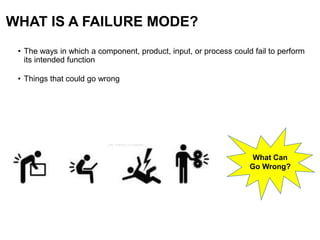
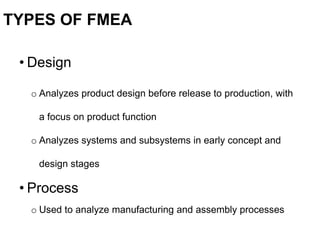
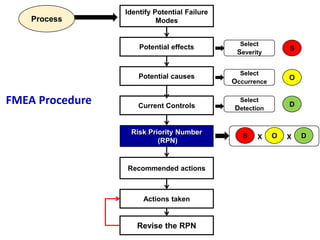
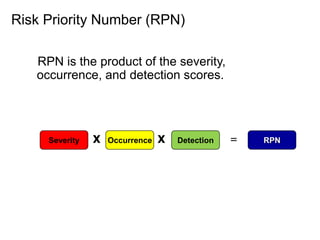
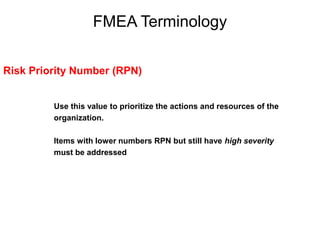
Failure Modes and
Effects Analysis (FMEA)
K.MURUGESAN
• First used in the 1960’s in the Aerospace industry during the Apollo
missions
• Later, the automotive industry saw the advantages of using this tool to
reduce risks related to poor quality
History of FMEA
• FMEA is a Risk Management tool
• A Team approach is necessary
FMEA: A Team Tool
FMEA
A systematic tool for
 Identifying the Failure modes
 Identifying the causes of Failure modes
 Analyzing the impacts of Failure modes on Customers
 Taking effective actions to reduce/eliminate risks
WHAT IS A FAILURE MODE?
• The ways in which a component, product, input, or process could fail to perform
its intended function
• Things that could go wrong
What Can
Go Wrong?
FMEA
A structured approach for
 Identifying the Failure modes
 Identifying the causes of Failure modes
 Analyzing the impacts of Failure modes on Customers
 Taking effective actions to reduce/eliminate risks
RPNS O D
TYPES OF FMEA
• Design
o Analyzes product design before release to production, with
a focus on product function
o Analyzes systems and subsystems in early concept and
design stages
• Process
o Used to analyze manufacturing and assembly processes
FMEA
C&E Matrix
Process Flow
charts
Procedures
Knowledge
Experience
List of actions to
prevent causes or
detect failure modes
History of actions
taken
Inputs
FMEA Inputs and Outputs
Outputs
FMEA Terminology
• Severity
• Impact of the Failure modes on customer requirements
• Occurrence
• Frequency with which a given cause occurs and
creates failure modes (obtain from past data if possible)
• Detection
• The ability of the current control system to detect
(then prevent) a given cause
Identify Potential Failure
ModesProcess
Potential causes
Current Controls
Risk Priority Number
(RPN)
Recommended actions
Actions taken
Revise the RPN
S O DX X
Select
Severity
S
Select
Detection
D
Select
Occurrence
O
FMEA Procedure
Potential effects
Risk Priority Number (RPN)
RPN is the product of the severity,
occurrence, and detection scores.
Severity Occurrence Detection RPNX X =
Risk Priority Number (RPN)
FMEA Terminology
Use this value to prioritize the actions and resources of the
organization.
Items with lower numbers RPN but still have high severity
must be addressed
Severity Rating Scale..
Rating Description Definition of Failure Result:
10 Hazardous Failure could cause bodily injury to the customer or an employee.
9 High Major Failure defined as noncompliance with federal, state or local regulations.
8 Major The unit becomes inoperable when failure occurs.
7 Low Major Failure results in a high degree of customer dissatisfaction.
6 High Moderate The failure exists in a subsystem or partial malfunction of the product.
5 Moderate Failure is noticeable by the customer and may result in warranty or customer complaint.
4 Low Moderate Customer can overcome failure loss with no impact to the product or process.
3 High Minor Failure results in minor performance loss in the customers process. Customer can over
come loss by process change.
2 Minor Failure may not be readily apparent to the customer, but would have minor affects on the
customer’s process or product.
1 Low Minor No impact to the customer or loss of process/product capability.
Occurrence Rating Scale…
Rating Description Failure Rate Metrics
10 Imminent Failure Persistent failures, >= 100,000 ppm.
9 High Major >= 50,000 ppm < 100,000 ppm
8 Major >= 20,000 ppm < 50,000 ppm
7 Low Major Occurrence about 1/month or >= 10,000 ppm < 20,000 ppm
6 High Moderate Occasional Failure of about 1 every 3 months or >= 5,000ppm < 10,000ppm
5 Moderate Occurrence about every 6 to 12 months or >= 2,000 ppm < 5,000 ppm
4 Low Moderate Process capable (very few failures)
3 High Minor Few failures
2 Minor Random failure or 10 ppm
1 Low Minor Failure very unlikely,
Detection Ranking…
Rating Potential of Detection Definition
10 No Detection Detection not possible with current systems.
9 Very Remote Problem may occur without notice using current sampling
plan.
8 Remote Defect can be accepted in the normal inspection criteria
sampling plan of “no defects allowed”
7 Low Product is 100% inspected for defect during the process.
6 Moderately Low Product is 100% inspected using “go – no go” gages.
Process has been Poka Yoked for error elimination.
5 Moderate SPC process in place during the process and product is
also inspected off line…
4 Low Probable SPC used and immediate response to out of tolerance
conditions.
3 Probable Process capability has been demonstrated at 1.33 Cpk and
SPC program in place.
2 High Probability Product 100% inspected by an automation process.
1 Absolute Detection Methodologies created to make the failure obvious and
100% automated inspection utilized.
Summary
• FMEA:
o Identifies the ways in which a product or process can fail
o Estimates the risk associated with specific causes
o Prioritizes the actions that should be taken to reduce risk

FMEA

  • 1.
    Failure Modes and EffectsAnalysis (FMEA) K.MURUGESAN
  • 2.
    • First usedin the 1960’s in the Aerospace industry during the Apollo missions • Later, the automotive industry saw the advantages of using this tool to reduce risks related to poor quality History of FMEA
  • 3.
    • FMEA isa Risk Management tool • A Team approach is necessary FMEA: A Team Tool
  • 4.
    FMEA A systematic toolfor  Identifying the Failure modes  Identifying the causes of Failure modes  Analyzing the impacts of Failure modes on Customers  Taking effective actions to reduce/eliminate risks
  • 5.
    WHAT IS AFAILURE MODE? • The ways in which a component, product, input, or process could fail to perform its intended function • Things that could go wrong What Can Go Wrong?
  • 6.
    FMEA A structured approachfor  Identifying the Failure modes  Identifying the causes of Failure modes  Analyzing the impacts of Failure modes on Customers  Taking effective actions to reduce/eliminate risks RPNS O D
  • 7.
    TYPES OF FMEA •Design o Analyzes product design before release to production, with a focus on product function o Analyzes systems and subsystems in early concept and design stages • Process o Used to analyze manufacturing and assembly processes
  • 8.
    FMEA C&E Matrix Process Flow charts Procedures Knowledge Experience Listof actions to prevent causes or detect failure modes History of actions taken Inputs FMEA Inputs and Outputs Outputs
  • 9.
    FMEA Terminology • Severity •Impact of the Failure modes on customer requirements • Occurrence • Frequency with which a given cause occurs and creates failure modes (obtain from past data if possible) • Detection • The ability of the current control system to detect (then prevent) a given cause
  • 10.
    Identify Potential Failure ModesProcess Potentialcauses Current Controls Risk Priority Number (RPN) Recommended actions Actions taken Revise the RPN S O DX X Select Severity S Select Detection D Select Occurrence O FMEA Procedure Potential effects
  • 11.
    Risk Priority Number(RPN) RPN is the product of the severity, occurrence, and detection scores. Severity Occurrence Detection RPNX X =
  • 12.
    Risk Priority Number(RPN) FMEA Terminology Use this value to prioritize the actions and resources of the organization. Items with lower numbers RPN but still have high severity must be addressed
  • 13.
    Severity Rating Scale.. RatingDescription Definition of Failure Result: 10 Hazardous Failure could cause bodily injury to the customer or an employee. 9 High Major Failure defined as noncompliance with federal, state or local regulations. 8 Major The unit becomes inoperable when failure occurs. 7 Low Major Failure results in a high degree of customer dissatisfaction. 6 High Moderate The failure exists in a subsystem or partial malfunction of the product. 5 Moderate Failure is noticeable by the customer and may result in warranty or customer complaint. 4 Low Moderate Customer can overcome failure loss with no impact to the product or process. 3 High Minor Failure results in minor performance loss in the customers process. Customer can over come loss by process change. 2 Minor Failure may not be readily apparent to the customer, but would have minor affects on the customer’s process or product. 1 Low Minor No impact to the customer or loss of process/product capability.
  • 14.
    Occurrence Rating Scale… RatingDescription Failure Rate Metrics 10 Imminent Failure Persistent failures, >= 100,000 ppm. 9 High Major >= 50,000 ppm < 100,000 ppm 8 Major >= 20,000 ppm < 50,000 ppm 7 Low Major Occurrence about 1/month or >= 10,000 ppm < 20,000 ppm 6 High Moderate Occasional Failure of about 1 every 3 months or >= 5,000ppm < 10,000ppm 5 Moderate Occurrence about every 6 to 12 months or >= 2,000 ppm < 5,000 ppm 4 Low Moderate Process capable (very few failures) 3 High Minor Few failures 2 Minor Random failure or 10 ppm 1 Low Minor Failure very unlikely,
  • 15.
    Detection Ranking… Rating Potentialof Detection Definition 10 No Detection Detection not possible with current systems. 9 Very Remote Problem may occur without notice using current sampling plan. 8 Remote Defect can be accepted in the normal inspection criteria sampling plan of “no defects allowed” 7 Low Product is 100% inspected for defect during the process. 6 Moderately Low Product is 100% inspected using “go – no go” gages. Process has been Poka Yoked for error elimination. 5 Moderate SPC process in place during the process and product is also inspected off line… 4 Low Probable SPC used and immediate response to out of tolerance conditions. 3 Probable Process capability has been demonstrated at 1.33 Cpk and SPC program in place. 2 High Probability Product 100% inspected by an automation process. 1 Absolute Detection Methodologies created to make the failure obvious and 100% automated inspection utilized.
  • 16.
    Summary • FMEA: o Identifiesthe ways in which a product or process can fail o Estimates the risk associated with specific causes o Prioritizes the actions that should be taken to reduce risk