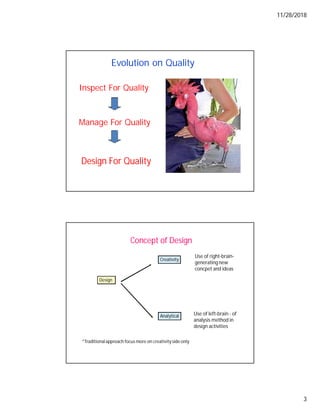
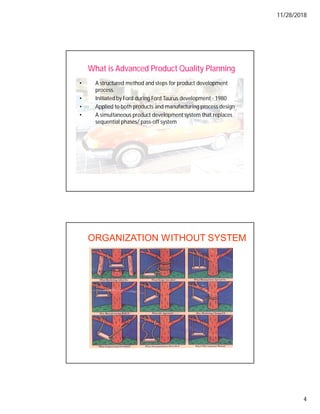
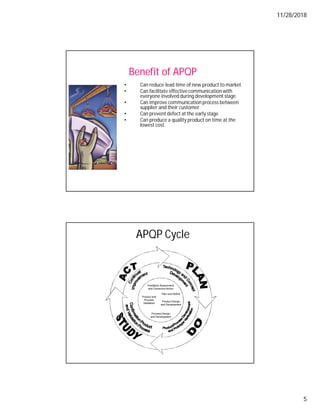
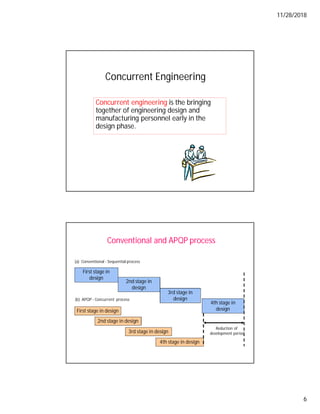
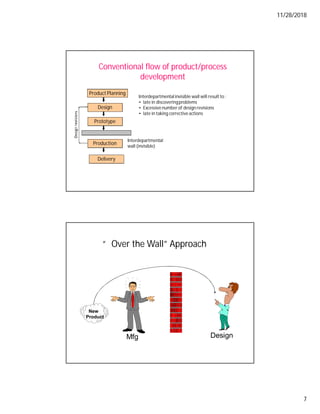
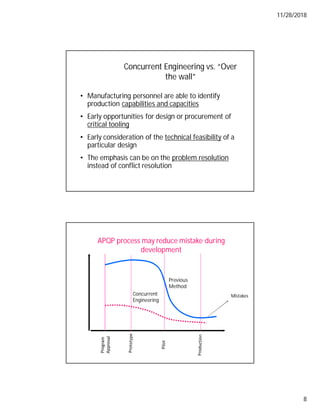
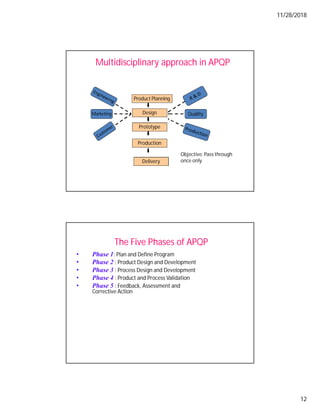
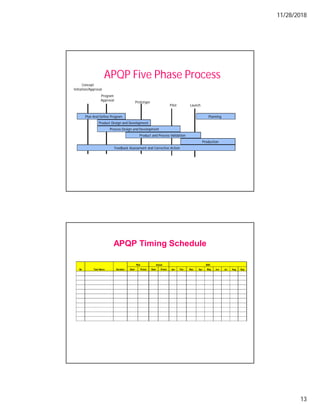
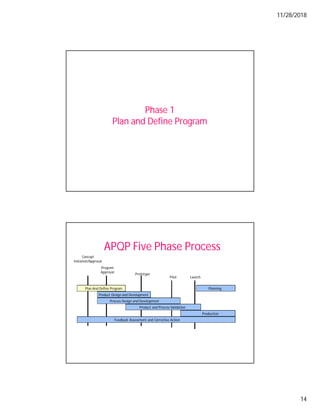
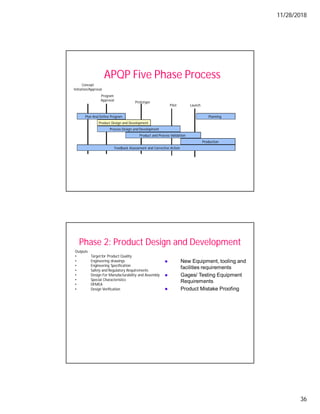
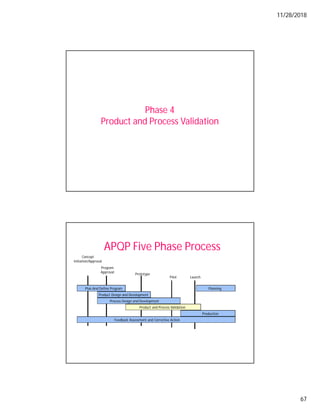
SlideShare a Scribd company logo
11/28/2018
1
Automotive Core Tools APQP Training
on understanding, workshop and
competency assessment
For
FEC CABLES Sdn Bhd
Presented by
ABDUL RASHID HM
ADVANCE PRODUCT QUALITY PLANNING (APQP)
2ND EDITION
PART 1
11/28/2018
2
Course objective
• To understand the purpose of APQP
• To understand appropriate activities for
each phase of APQP
• To understand the required inputs and
outputs of each phase
• To understand the relationship of quality
core tools
• The goal of PQP is to facilitate
communication between all persons and
activities involved during product
development program and ensure that
all required steps are completed on time,
at acceptable cost and quality levels.
The Goal of PQP
11/28/2018
3
Design For Quality
Evolution on Quality
Inspect For Quality
Manage For Quality
Concept of Design
Design
Creativity
Analytical
Use of right-brain-
generating new
concpet and ideas
Use of left-brain - of
analysis method in
design activities
*Traditionalapproach focus more on creativityside only
11/28/2018
4
What is Advanced Product Quality Planning
• A structured method and steps for product development
process.
• Initiated by Ford during Ford Taurus development - 1980
• Applied to both products and manufacturing process design
• A simultaneous product development system that replaces
sequential phases/ pass-off system
ORGANIZATION WITHOUT SYSTEM
11/28/2018
5
• Can reduce lead time of new product to market
• Can facilitate effectivecommunication with
everyone involved during development stage.
• Can improve communication process between
supplier and their customer
• Can prevent defect at the early stage
• Can produce a quality product on time at the
lowest cost.
Benefit of APQP
APQP Cycle
Feedback Assessment
and Corrective Action
Process Design
and Development
Plan and Define
Product Design
and Development
Product and
Process
Validation
11/28/2018
6
Concurrent Engineering
Concurrent engineering is the bringing
together of engineering design and
manufacturing personnel early in the
design phase.
Conventional and APQP process
First stage in
design
2nd stage in
design
3rd stage in
design
4th stage in
design
First stage in design
2nd stage in design
3rd stage in design
4th stage in design
(a) Conventional - Sequential process
(b) APQP - Concurrent process
Reduction of
development period
11/28/2018
7
Conventional flow of product/process
development
Product Planning
Design
Prototype
Production
Delivery
Interdepartmental
wall (invisible)
Interdepartmentalinvisible wall will result to :
• late in discoveringproblems
• Excessive number of design revisions
• late in taking corrective actions
“Over the Wall” Approach
Design
Mfg
New
Product
11/28/2018
8
Concurrent Engineering vs. “Over
the wall”
• Manufacturing personnel are able to identify
production capabilities and capacities
• Early opportunities for design or procurement of
critical tooling
• Early consideration of the technical feasibility of a
particular design
• The emphasis can be on the problem resolution
instead of conflict resolution
APQP process may reduce mistake during
development
Mistakes
Previous
Method
Concurrent
Engineering
11/28/2018
9
Engineering Changes during development
Company B
Company A
Time
The effect of design on manufacturing cost
Poor Design Average Design Good Design
Efficient Manufacturing
Average Manufacturing
Inefficient Manufacturing
11/28/2018
10
Team Organization
• Select team leader
• Understanding of “How we work as a team”
• Team should understand etc
11/28/2018
11
Multidisciplinary approach in APQP
• To assign responsibility to a multidisciplinaryteam that include
different function such as:
– Design
– Marketing
– Quality Assurance
– Manufacturing
– other appropriate personnel
• Encourageto involve customer/ supplier
Function
Process
Product
Planning
Design Purchasing W’housing Sales Marketing
Quality
Cost
Delivery
a)New
Products
b)Existing
Products
Cross
Function
Management
Customers
Cross
Function
Management
Customers
functional Management
Strong Relation
Strong Relation Relation
Relation Little Relation
Little Relation
Cross Functional
Management
11/28/2018
12
Multidisciplinary approach in APQP
Product Planning
Design
Prototype
Production
Delivery
Quality
Marketing
Objective: Pass through
once only
The Five Phases of APQP
• Phase 1: Plan and Define Program
• Phase 2 : Product Design and Development
• Phase 3 : Process Design and Development
• Phase 4 : Product and Process Validation
• Phase 5 : Feedback, Assessment and
Corrective Action
11/28/2018
13
APQP Five Phase Process
Plan And Define Program
Product Design and Development
Process Design and Development
Product and Process Validation
Production
Feedback Assessment and Corrective Action
Pilot Launch
Concept
Initiation/Approval
Program
Approval
Prototype
Planning
APQP Timing Schedule
Start Finish Start Finish Jan Feb Mac Apr May Jun Jul Aug Sep
Task Name
No
Plan Actual 2003
Duration
11/28/2018
14
Phase 1
Plan and Define Program
APQP Five Phase Process
Plan And Define Program
Product Design and Development
Process Design and Development
Product and Process Validation
Production
Feedback Assessment and Corrective Action
Pilot Launch
Concept
Initiation/Approval
Program
Approval
Prototype
Planning
11/28/2018
15
Phase 1: Plan and Define Program
• Early stage of the APQP
• To ensure that customer needs and expectations are
clearly understood
• Shall use customer needs and expectations to plan and
define a quality program.
Phase 1: Plan and Define Program
• Inputs
– Voice of customer (VOC)
• Market Research
• HistoricalWarranty and Quality Information
• Lesson learnt from past experience
– Product Concept
– Product Benchmark data
11/28/2018
16
Voice Of Customer
Conventional design process
focus more on engineering
capabilities and less on
customer needs
WHAT IS QUALITY ?
Customer requirements
As manufactured
As delivered
Quality gap
“Qualityis meeting customer
requirements and expectation”
“The only real measure of business
successis a satisfiedcustomer,all else
is a distraction”
Barrie Hopson
11/28/2018
17
Increased
productivity
Quality
Meets
Customer
requirements
Meets
customer
expectations
Exceeds
customer
expectations
Reduced
rework/repair
Reduced
costs
Satisfy
Customer
Reduced
returns,
complaints,
warranty
Repeat
Order
Delight
Customer
Customer
Loyalty
Increased
profit
CUSTOMER SATISFACTION
Voice Of Customer
Customer
A process used to capture the requirements/feedback from customerto provide
with the best service/product quality
Market Research
Historical Warrant
Past Experiences
Other methods may be used such as focus group,etc
11/28/2018
18
Market Research
Surveyquestionaire
The following is a list of vehicle features. Please read the entire
list and
place an X next to those of that you particlularly like
Room & Comfort
Front Room
Front Seat Comfort
Entry & Exit from front
Cargo Capacity
Cargo loading
Interior Appearance
Seat Appearance
Instrument Panel
Door Panels
Console Box
Carpeting
• Customer
Interviews
• Customer
questionaires and
surveys
• New product
quality and
reliability studies
• Competitive
product quality
studies
Historical Warranty and Quality Information
• Complaints
analysis
• Things gone Wrong
reports
• Warranty reports
• Customer plants
returns and
rejections analysis
• Field return
product analysis
Complaints Analysis
12
10
8
7
5
Paint mist
Color difference between body
panel
Uneven color on one body panel
Paint peel off
Rust, corrosion
5 Scratch paint
4
3
2
Dirt in paint
Chipped paint
Runs in paint
11/28/2018
19
Lessons learnt from past experience
• Input from higher systemlevel or past QFD project
• Media commentary and analysis
• Customer letters and suggestions
• Dealer Comments
• Operator comments
• Problems and issues reported from Internal Customer
• Government requirements or regulations
Design Concept
• Get information related to the product
• Define the overall system
• Find the overall function that needs to be accomplishes
• Create sub-function description
• Generate concept alternative
– Brainstorming
– Use analogies in design
– Use extreme and inverse
– Find ideas in reference book
– Using experts to help generate concept
– Using ideas from competitor
– morphological method
11/28/2018
20
Product Information
• Product Information shall include the
following:
– What is the intended use of this product; heavy duty,
normal duty,
– Who are using this product; youngster,family
– Where it shall be used; town, corrosive environment
– When it will be used; at night, morning, evening
– How it will be used;
Define the overall system
• Shall understand the appropriate level -
System, subsystem or component
• The team member must decide on what
constitutes a system,subsystem or
component
• The actual boundaries that divide a system,
subsystem and component are arbitrary
11/28/2018
21
Television
RF
tuner
Video
detecteor
Video
Amplifier
Picture
Tube
Electron
gun
Deflectio
n coils
Final
anode
Screen
System
Sub-
System
Component
Determine level of system
Determine the product function
• Determine the function of the product to meet design intent
• An accurate statement of product function will effect the work
performance and desired result
• FUNCTION OF PICTURE TUBE
– To convert the video (electrical) signals into optical (picture) signal
Input Desired results
Product Function
11/28/2018
22
Create sub-function description
• Electron gun : To shoot and control flow of electrons to the
screen.
• Deflection coils: To deflect the electron beam in horizontal and
vertical direction using electromagnetic system
• Final anode; to provide sufficient and energy for the electron
beam.
• Screen: To integrate the electron into color and optical view
Design concept alternative
11/28/2018
23
To consider the following issues:
• Legal requirements
– Any regulation that related to the product
• Safety (Product liability);
– a manufacturer is liable for any injuries or damages caused by a
faulty product.
• Environmental
– A manufacturer is liable for any aspect that would
impact the environment.
Legal, Safety, and Environmental Issues
Product Benchmark Data
• To gather ideas from competitor’s practices
• To provide inputs for establishing performance targets
• Method for successful benchmarking:
– Identify benchmark subject
– Identify benchmark partner (best practice)
– Collect data
– Find reason for gap between your status and
benchmark
– Develop plan for closing gap, meeting or exceeding
benchmark
11/28/2018
24
THE BENCHMARKING MENU
Internal best practicesby
function
Functional best practices-any
company
Industrybest practices (includes non
competitors)
Competitors best practices
Functional best practices-world class
THE BENCHMARKING MODEL
Company Process
American Express Collections
American Hospital Supply Inventory control
AT & T Research and development
Baxter International Employee recognition and human management
Cumming Engine Plant layout and design; supplier certification
Dow Chemical Supplier Certification
Florida power & Light The quality process
Hewlett Packard Research & Development engineering
L.L. Bean Inventory control; distribution; telephonic
Marriott Customer survey techniques
Milliken Employee recognition
USAA Telephonic
11/28/2018
25
Identify benchmarking partners
Industry survey
Customer/Supplier
interview
Knowledge sharing
consortium
1:1
Easy to get, cheap
Hard to get, costly
Benchmark with other industry
No
1
Long admission times in
hospitals
Hotel
Receptions
2 Lengthy machine setup
Formula One pit
crew
3 Delivery of fresh concrete
Hot pizza
delivery
4
Unstructured maintenance
of power turbines
Maintenance of
aircraft engines
5
Difficult to manufacture
cylindrical shape
Manufacturing of
lipstick tubes
Problem
Compared
with
11/28/2018
26
Product Benchmark Data
Weighting 2 4 1 1
Competitor A 5 5 2 2 34 RM25
Competitor B 5 3 4 7 33 RM23
Competitor C 4 5 5 5 38 RM30
Competitor D 5 6 9 3 46 RM37
• Useful tools for plan and define stage.
– Needs-Metrics Tables
– Quality Function Deployment- QFD
– Competitive Benchmarking
Analyze Data
vs. Requirements
Correlate Requirements
with Measures
measure
requirements
11/28/2018
27
Quality Function
Deployment (Example)
Phase 1: Plan and Define Program
• Outputs
– APQP timing schedule
– Design and Quality goals
– Product Costing
– Preliminary Listing of Special Characteristics
– Feasibility and risk analysis
11/28/2018
28
To plan and control the process of design and development
Shall include :
design and developments stages
The required activities in development stages
Responsibilities and authorities
To manage the interfaces between groups involved
To update Plan as and when required
APQP Timing schedule
APQP Timing Schedule
Start Finish Start Finish Jan Feb Mac Apr May Jun Jul Aug Sep
Task Name
No
Plan Actual 2003
Duration
11/28/2018
29
Product Costing
• First estimation should made early and be precise
enough to be use in making decisions :
– not to continue
– to proceed
• Other decision to be made for components:
– purchase component from vendor
– manufacture in hour
• Accuracy normally based on previous experience
The Effect of design on manufacturing cost
Poor design Average Design Good Design
EfficientManufacturing
Average Manufacturing
InefficientManufacturing
Manufacturing cost
11/28/2018
30
Product Costing
• Fixed costs
– Overhead; all cost for administration,engineering, utilities that occur
day to day, even if no product rolls out of door.
– Tooling; cost include all jig, fixtures and mold
• Variable Costs
– Purchased part; expenses of all the materials/part that are purchased
for a product including scrap
– Labor; cost of wages and benefits to the workforce
– Selling expenses
– Profit
Fixed Costs vs. Variable Costs
• Fixed Costs – incurred in a predetermined
amount, regardless of number of units
produced (i.e. setting up the factory work
area or cost of an injection mold)
• Variable Costs – incurred in direct proportion
to the number of units produced (i.e. cost of
raw materials)
11/28/2018
31
Product Costing
Purchased parts
Labor
Tooling
Overhead
Selling Expenses
Profit
Fixed costs
Variable costs
Manufacturing costs
Total costs
Estimate the Manufacturing Costs
Finished Goods
Manufacturing System
Equipment Information Tooling
Waste
Services
Supplies
Energy
Raw Materials
Labor
Purchased
Components
11/28/2018
32
Significant factor affecting cost
• From what material is the component to be manufactured?
• What type of machine is used to manufactured the component?
• What are the major dimensions of the component?
• How many machined surfaced are there, and how much material is to
be removed?
• How many components are made?
• What tolerance and surface finishes are required?
• What tolerance and surface finished are required?
• What is the labor rate for machinists?
Preliminary listing of Special Characteristic
• Product characteristic or manufacturing process parameter that can
affect:
– safety
– compliance with regulations
– fit
– function
– performance
• Identified by customer or selected by the supplier
• use symbol provided by customer(if any)
S
S
11/28/2018
33
Feasibility and risk analysis
• Shall investigate, confirm and document manufacturing feasibility of the
proposed products.
• Shall determine whether the proposed design can be manufactured,
assembled, tested, packaged and delivered in sufficient quantity, at an
acceptable cost
• Proposed design should be documentedand presented to management
for their support.
Feasibility and risk analysis
• Usually has one or three reactions:
– It is not feasible, it will never work
– It might work if something else happens
– It is worth considering
11/28/2018
34
Risk Assessment
• Risk analysis should include :
– High warranty of current models
– New supplier
– New manufacturing location
– New product or manufacturing technology
– High product or process complexity
– Program timing is compressed
– Cost targets are aggressive
– Reliability goals will be difficultto achieve
Feasibility Analysis (example)
Customer: ____________________________________ Date: ___________________
Part Number : _________________________________ Part Name :______________
YES NO CONSIDERATION
Is product adequately defined (application requirements, etc) to enable feasibility
evaluation ?
Can Engineering Performance Specifications be met as written ?
Can product be manufactured to tolerance specified on drawing ?
Can product be manufactured with Cpk's that meet requirements ?
Is there adequate capacity to produce product
Does the design allow the use of efficient material handling techniques ?
Can the product be manufactured without incurring any unusual:
* Costs for capital equipment?
* Cost for tooling ?
Alternative manufacturing methods ?
Is statistical process control required on product?
Is statistical process control presently used on similar products:
* Are the process in control and stable ?
* Are the Cpk's greater than 1.33 ?
Conclusion
Feasible Product can be produced as specified with no revisions
Feasible Change recommended (see attached)
Not Feasible Design revision required to produce product within the specified requirements
Sign-Off
TEAM FEASIBILITY COMMITMENT
11/28/2018
35
Risk Assessment
No. Type of Risk Risk
(low, medium or
high)
1
Product failure due to new design
2 Product failure due to manufacturing techniques are new to
industry
3 Product failure due to high product or process complexity
4 Product failure because the product is strategically important
due to high visibility or functional performance
5 Design goal is difficult to achieve
6
Reliability goals are difficult to achieve
7 Quality goals (warranty, TGW, scrap rates, rework rates) will
be difficult to achieve
8 Prototype is not able to deliver on time because program
timing is compressed
9 Product is not able to deliver on time because program timing
is compressed
10 Chance of a product recall
11
Others
For risk evaluated to be high or medium, controls or action plans are required. If
controls or action plans are deemed to be ineffective, the company should consider to
decline the order.
Conclusion:
_______________________________________________________________
Phase 2
Product Design and Development
11/28/2018
36
APQP Five Phase Process
Plan And Define Program
Product Design and Development
Process Design and Development
Product and Process Validation
Production
Feedback Assessment and Corrective Action
Pilot Launch
Concept
Initiation/Approval
Program
Approval
Prototype
Planning
Phase 2: Product Design and Development
Outputs
• Target for Product Quality
• Engineering drawings
• Engineering Specification
• Safety and Regulatory Requirements
• Design For Manufacturability and Assembly
• Special Characteristics
• DFMEA
• Design Verification
New Equipment, tooling and
facilities requirements
Gages/ Testing Equipment
Requirements
Product Mistake Proofing
11/28/2018
37
Target for Product Quality
• To identify, document and review targets for product design:
• Eg:
– MTBF = Mean Time Between Failure
– MTTR = Mean Time To Repair
– Life
– Reliability
– Durability
– Maintainability
– Timing and cost
• Customer Needs lead to Product Specs
The Customer expresses the need in terms of What the
product must do.
The robot can quickly change alignment without forward
motion.
The Product Specification sets metrics and values that allow
quantification of the user need.
The Robot can rotate 360 degrees in 2 secs without
forward motion .
11/28/2018
38
A extension of the short-term memory after idea generation.
To represent concept that are more abstract and best represented.
To archive the geometric form of design
Communicate ideas between designers and other related personnel.
Simulate the operation of the product
To check the completeness of design
Engineering Drawings
Layout drawings
refer as working drawing; made to scale
Only important dimensions are shown in a layout drawing
Tolerances are usually not shown, unless they are critical
As detail drawings and assembly drawing developed, the
layout drawing becomes less useful.
Focus on system and sub-system
Detail drawings
Include all dimension and tolerance
Include material and manufacturing detail
Shall be approved by management
Address to single component
Type of drawing
11/28/2018
39
Assembly drawings
Use to show how the components fit together
Include bill of materials
References can be made to other drawings and specific
assembly instructions a for additional needed information.
Shall be approved by management
Type of drawing
Shall be reviewed to determine:
Sufficient information for dimensional layout
Dimensions and tolerance are feasible to be manufactured
Tolerance are compatible to gage accuracy
Information for fitting, function, durability
Any governmental regulatory safety requirements
Any special characteristics
Shall be able to communicate in customer specified language
Engineering Drawings
11/28/2018
40
Engineering Drawings
Shall be established to meet customer
requirements or contracts.
Shall transform qualitative into quantitative
information. Eg: speed, length, dimension, stress,
etc
Shall include acceptance criteria - target to be met
Shall be reviewed to ensure:
Sufficient information including the acceptance criteria
Capability to meet such requirements
Complete and no ambiguous information
Engineering Specification
11/28/2018
41
To review material specification such as:
Physical properties
Performance
Environmental
Handling
Storage
To communicate to relevant supplier
Material Specification
Bill of Material
• The bill material is like an index to the product
• To identify what exactly will go into the product
• To identify the quantities of each component part required to make
up the total package
• Based on product/ process assumptions
11/28/2018
42
Bill of Material
Typical information in bill of material
• The item number
• The part number
• The quantity needed in the assembly
• The name or description of the component
• The material flow from which the component is made
• The source of the component
Bill of Material
No Item Product Code Quantity used Weight Supplier
11/28/2018
43
Safety and Regulatory Requirements
• To identify applicable safety standards and regulation
• To analyze safety in design, purchased component and manufacturing.
• carry out design evaluation test for safety
• Prepare instruction and warning to the user, maintenance manual and
labeling
To improve the design concept for easy
and low-cost assembly/ manufacturing by:
reducing the number of parts
optimising manufacturing processes
simplifying parts handling
improving product assembly
Design for manufacture and Assembly (DFMA)
11/28/2018
44
AEM & DFS: Pneumatic Pump
•Assembly Sequence:
6. Two screws
5. One cover
4. One spring
3. One piston stop
2. One piston
1. One main body
•Tool:
–A screw driver
DFMA : Example
11/28/2018
45
DFMA : Example
Advantages of Standardization
• Fewer parts to deal with in inventory & manufacturing
• Design costs are generally lower
• Reduced training costs and time
• More routine purchasing, handling, and inspection procedures
• Orders fillable from inventory
• Opportunities for long production runs and automation
• Need for fewer parts justifies increased expenditures on
perfecting designs and improving quality control procedures
11/28/2018
46
Design for Reliability
• To ensure quality over the long term
• Is the ability of product to perform its
intended function over a period of time and
under prescribed environmental conditions.
THE FAILURE ‘BATH TUB’
CHANGE FAILURE
PHASES
WEAROUT
PHASES
EARLY FAILURE
PHASE
Operating Time (Componentage or time)
11/28/2018
47
DESIGN FOR RELIABILITY
Equipment
deterioration
Safety Margin
Design Strength
Distribution of stress
Areas where the two
(stesses and strength)
overlap
(Time ), t
Be aware of the environmental
effects of the materials used in
product
Design the product with high
separability
Design components that can be
reused or recycle
Be aware of the environmental
effects of the material not reused.
Design for Environment (DFE)
11/28/2018
48
To analyse what could go wrong in the design system
such as component, subsystem or system
To develop a ranked list of potential failure modes
according to their effects on system and vehicle
operations
To establish a priority system for design improvements,
development and validation
Design FMEA
Design FMEA
Item Potential Potential Current R. Recommended Action Results R.
Function Failure Effect(s) of Process P. Action(s) Taken P.
Mode Failure Controls N. N.
Requirements
S
e
v
C
l
a
s
s
O
c
c
u
r
D
e
t
e
c
ofFailure
Action Results
Potential Responsibility S
e
v
O
c
c
D
e
t
Cause (s) / & Target
Mechanism(s) Completion Date
11/28/2018
49
Design Verification Result
• Perform in accordance with planned arrangement
• Method of verification such as:
– Alternate calculation - strength, force, strain, etc
– Stress analysis
– Computer software calculation
• Review verificationresult
• May review the correctness of design calculation
New tooling and facilities requirements
• To identify requirements for new tooling
• To provide soft / hard tooling development plan
• To identify sub-contractor for tooling
• To ensure development meet timing plan and delivered on
time
• To provide technical guidance to sub-contractor
• To verify new tooling prior to accept
11/28/2018
50
Gages and testing Equipment requirements
• To identify new inspection, test and measurement
equipment
• To identify the accuracy required
• To ensure equipment is ready on time
Gages and testing Equipment requirements
No Testing required Test Equipment unit available Accuracy
GAGES/ TESTING REQUIREMENT
11/28/2018
51
Special Characteristics
• Upgrade preliminary list stated in Phase 1
• Identify customer-specifieddefinitions and symbols or organization’s
equivalent symbol
• Include in the control plan
• Identify process control documents including drawings,FMEAs, control
plans, and operator instructions
Product error-proofing
• To design product in achieving zero defect
• To avoid errors due to human mistake.
• May reduce occurrence and detection ranking in
FMEA
11/28/2018
52
Product error-proofing
Prototype Program
• Shall have a prototype program and control plan when required by
customer
• Whenever possible, use same suppliers, tooling and manufacturing
processes
• Monitor Performance-testingfor timely completion and conformity to
requirements
• Provide technical leadership for any services outsource
11/28/2018
53
Phase 3
Process Design and Development
APQP Five Phase Process
Plan And Define Program
Product Design and Development
Process Design and Development
Product and Process Validation
Production
Feedback Assessment and Corrective Action
Pilot Launch
Concept
Initiation/Approval
Program
Approval
Prototype
Planning
11/28/2018
54
Phase 3: Process Design And Development
Outputs
• Target for Manufacturing
process
• Process Flow Chart
• Control Plan
• Process FMEA
• Work Instructions
• Packaging Standards
• Floor Plant Layout
• Process Error Proofing
Measurement Systems
Analysis Plan
Preliminary Process Capability
Study Plan
Management Support
Target for manufacturing Process
• To identify, document and review targets for
manufacturing process design:
• Eg:
– Quality
– process capability
– productivity
– Manufacturibility
– Timing
11/28/2018
55
Process Flow Chart
• May upgrade from preliminary process flow chart in phase 1
• Schematic representation of the current or proposed process
flow from receiving to final product
• Can assist the team to conduct PFMEA and develop control plan
• Any changes required should be updated in the
manual/procedure
Process Flow Chart
Virgin
QC
Mixing
Pre-heat
Moulding
QC
Recycle
QC
triming Assembly
Packing
11/28/2018
56
Control Plan
• Type of control plan:
– prototype
– pre-launch
– production
• The control plan shall :
– list the control used for the manufacturing process
control
– Include methods for monitoring of control exercised
over special characteristics
– identify the specified reaction plan and corrective
action
• Shall be reviewed when any change occurs
Control Plan
• The control plan shall include:
– Process name
– Machine
– Product characteristics
– Process characteristics
– Special characteristics
– Product/process specification
– Measuring technique
– Sample size and frequency
– Control method
– Reaction Plan
– Corrective Action
11/28/2018
57
Control Plan
No
11 a Overall height of form cup Ø 24.0 ± 0.4 Height gauge issue CAR for
b Inside diameter Ø 15.6 ref Caliper repeated problem
c Appearance Free from chip mark Visual
d Setting parameter Refer Tool Setting Sheet (BMSB 0915)
12 a Overall diameter Ø163.5 ref Caliper issue CAR for
b Distance from center to center holes 90.0 ± 0.5 Caliper repeated problem
c Hole diameter Ø36.0 ± 0.3 Caliper
d Appearance Free from burr Visual
e Setting parameter Refer Tool Setting Sheet (BMSB 0915)
13 a Redrawheight (outside) 2.2 -0/ +0.4 Height gauge issue CAR for
b Redrawheight (inside) 1.9 -0/ +0.5 Height gauge repeated problem
c Waviness 0.15 max Height gauge
d Appearance Free from chip mark Visual
e Setting parameter Refer Tool Setting Sheet (BMSB 0915)
14 a Overall diameter Ø161.0 ± 0.1 Caliper issue CAR for
b Appearance Free from burr Visual repeated problem
Corrective
Action
1/4 hours
batch Periodical insp
1 batch 1st sample
Every
F
1/4 hours
set up
set up C
H
Process
Size
Measuring
Technique
1st sample
Characteristic
Special
Char.
1
1
batch
1
1
1/4 hours
batch
F
Control
Method
2
Reaction
Plan
Sample
H
OP 130
HME 30T
OP 110
Center piercing
Redraw Li Chin H 250T
1
Method
Clip & Pierce Li Chin 200T
No Process Name/ Machine, Jig Product/ Process Spec/
Tol
Product
Visual insp.
batch
Freq
batch
1st sample C
1st sample C
C
Visual C
part
set up
Every
2
1st sample C
E
batch 1st sample
1st sample
1st sample
1st sample
Visual insp.
OP120 batch H
H
H
1
Visual insp.
2
batch 1st sample
1
Every C
1st sample
Every
C
OP 140
Trimming Suga 5
Update the Control Plan
Process
Flow
Control
Plan
FMEA Work
Instruction
Scrap, Rework Data
Warranty & Assembly Plant Data
11/28/2018
58
Process FMEA
• To identify potential failure due to manufacturing or assembly
process.
• To assess the effects of the potential failures on the customer
• To focus controls for occurrence reduction or detection
• To establish a ranked list of potential failure modes based on RPN
calculated
FMEA
Design
Potential
Failure
PotentialCause Effects
11/28/2018
59
Establish Potential Failure Mode
Process Function / Requirements PotentialFailure Mode
Component Insertion
Insert LED of differentcolours on to PC Board
with the right polarity and in the right sequence
1. Wrong colour LED used
2. Wrong polarity
3. Wrong sequence
Soldering of components
Solder the component leads to PC Board using
soldering iron
1. Cold Solder Joint
2. Not enough solder
Trim Leads
Cut the component leads to shorter length
1. Lead length too long
2. Burrs on lead
Burn in
Stabilize the LED and eliminateinfant
1. ElectricalOver stress
Example :
Product
Function
Potential
Failure
Mode
Potential
Effect(s) of
failure
S
e
v
C
l
a
s
s
Potential
Cause(s) of
Failure
O
c
c
ur
Current
Control
(Prevention)
Current
Control
(Detection)
D
et
ec
R
P
N
Recommend
ed Action
Responsibility
and
Completion
Date
Action
Taken
Severity
Occurrence
Detection
RPN
PROCESS FAILURE MODE AND EFFECTS ANALYSIS (PFMEA)
Add positive
depth stop to
sprayer
Use Design of
Experiements
(DOE)
None
Install spray
timer
A Tate-Body
Engrg
9X 15 15
Mfg Eng
9X 10 01
Maintenance
9X 09 15
Stop added,
sprayer
checked on-
line
Temp and
pressure were
determined -
result Cpk =
1.85
Automatic
spray timer
installed,
Cpk = 2.05
7 2 5 70
7 1 5 35
7 1 7 49
280
175
70
392
2
5
8
8
Manually
inserted - spray
head not
inserted far
enough
Spray heads
clogged
Spray head
deformed
due to impact
Spray time
insufficient
Front Door
L.H
H8HX-0000-A
• Ingress to
and egress
from
vehicle
• Occupant
protection
from
weather,
noise and
side impact
• Support
anchorage
for door
hardware
including
mirror,hing
es, lacth
and
window
regulator
Corroded
interior lower
door panels
Deteriorated
life of door
leading to:
•
unsatisfactor
y
appearance
due to rust
through
paint over
time
• Impaire
function of
interior door
hardware
7++
Test spray
pattern at
start-up and
after ideal
period
Preventive
maintenance
program
Visual check
each hour for
film thickness
and coverage
Visual check
each hour for
film thickness
Visual check
each hour for
film thickness
Lot sampling(10
doors/shift) to
check coverage
for critical areas
5
5
5
7
11/28/2018
60
Work Instructions
• Prepare documented work instruction for employees having responsibilities for
operation that impact quality
• Instruction shall be accessible for use at the work station
• Derived from sources such as:
– control plan,
– PFMEA
– Engineering drawing
– DFMEA
Part Number: KB 01/19 Op. Number: - 140
Issue - 1
Part Description: - PULLEY: -
(POWER STEERING )
Op. Description: Trim & Chamfer
Date : 17/6/2002
Process Eng: - CM TAN
PPC: - WY SIT QA: - HUSAINI
(2)
Kasut Keselamatan
Persiapan
Keselamatan Diri
Penutup
Telinga
Sarung
Tangan
MINYAKDAN
GRIS BOLEH
MEROSAKAN
KULIT
Gambarajah Aliran Proses
Arahan Proses / Work Instructions
(1) (4)
(3) (5)
(6)
Rev. : 0
Doc. No. : WI-KB01/19-140/A
(1) Ambil ‘Part’dari bin (2) Letakkan ‘part’ pada
‘mandrel’
denganbetul.
(3) Pasangkanpemegang ‘part’
melalui lubangskru, dan
pastikania dimasukkandengan
betul.
(4) Pulaskantuaske fungsi ‘Auto’
mengetatkan ‘part’pada mandrel.
Panel Operasi Mesin
Butang ‘cycle
start’ atauoperasi
(A) Butang
kecemasan
‘return’
(B)
Butang
Kecemasan
berhenti
(C)
Keadaan Tempat Kerja
(1) Pastikansemuasisalebihankerjaseperti
sarung tangan,kainburukdansisabesi
dibersihkandari mesin sebelummesin
digunakan.
(2) Jikaterdapat‘part’pada mesin,
asingkanyakedalam‘polybox’ataubakul
‘reject’merah.
(3) Pastikanterdapatsekurang-kurangnya1
bin
WIP & binkosongdisediakanuntuksyif
berikutnyasebelumpulang.
(4) Pastikan’machine&operatormonitoring
sheet’
di isi denganbetul setiapjamapabilamesin
beroperasi.,sertaisikan‘Route card’untuk
setiapbinyang telahdisiapkan
Kawalan Kualiti
(1) Perhatikan‘part’ denganmata kasar
untukmasalahseperti berikut:
a) ‘Burr’ yangberlebihanpada
bahagian‘part’yangdipotong.
b) Pemotonganbersudutyangtidak
seragam.
c) Bahan terkupasdari permukaan
‘part’.
( 2) Jikamasalahseperti diatas dikenal
pasti olehoperatordania berlaku
5 kali berturut-turut,berhentikan
mesindanrujukkepadasupervisor
untuk langkahseterusnya.
(3) ‘Part’yang dikenalpastisebagai
‘reject’harusdibuangke dalam
‘polybox’ ataubakul ‘reject’
merah.
Keselamatan & Kecemasan
1) Pastikanpintumesinditutupapabilamesinberoperasi supayasisadari ‘part’
tidakterkenaanggotabadanoperator.
2) Pastikanpemegang‘Part’dipegangdenganbetul seperti gambar3untuk
mengelak dari terkepitnyajari.
3) Jikakeadaankecemasanberlakupadamesinketikaiadioperasikan,tekan
butang(B) danjikaia tidakberhasil gunakanbutang (C) seperti yang
ditunjukkanpada‘PanelOperasi Mesin’.
(5) Tutup pintukeselamatan
mesin
Machine Type: Suga (T1)
Ulangi langkah 1 untuk
langkah seterusnya.
(6) Tekan butanghitam‘cycle
start’ untuk memulakan
operasi.
(8)
(7) (10)
(8) Keluarkan pemegang
‘part’
(7) Setelah ‘part’siap dipotong
pulaskantuas ke fungsi
‘manual’untukmelonggarkan
pemegang ‘part’dari
‘mandrel’
(9)
(9) Keluarkan ‘part’yang
telah siapdan
masukkankedalam bin.
Mandrel
Part
Pemegang ‘part’
11/28/2018
61
Floor Plan Layout
• The organization of a company’s
physical facilities to promote the
efficient use of equipment, material
and people
• To determine material and process
flow, storage, inspection and test
points, rework or repair stations,
non-conforming material
• Shall optimize material travel,
handling and value added use of
floor space
• Shall facilitate synchronous material
flow
Process Flow analysis
Team member:
Qty Time Qty Time Qty Time
Monthly production :
Date:
Process Name: Approved by:
Improvement : Before/ After
1 2 3 4 Avg
1
2
3
13
14
15
16
17
18
19
20
21
22
23
24
25
26
27
28
Total
Symbol
Operation
No
Current
Time
Distance
After Different
Problem Action
PROCESS ANALYSIS
Operation
Move
Inspection
Delay
Storage
11/28/2018
62
Process
Flow
analysis
PROCESS ANALYSIS
Machining and job
operation
1. Can it be out
2. Can it be combined with another operation
3. Can the operational order be changed
4. How about changing materials, machine or operator
5. Can it be improved by some other means
Inspection 1. Can any of the inspection procedure be cut out ?
2. Can some sort of mistake proofing device or other
apparatus be used to simplify the testing procedure ?
3. Can tests carried out during the course of machining or
transportation?
4. Are the inspection criteria appropriate ? Are they stricter
than necessary?
5. Can it be improved by any other means?
Delay/ wait 1. Can the delay (wait) be eliminate ?
2. Can slow movement of some sort be achieved?
3. Can the number of delays (waits) be reduced?
4. Can anything else be done while the delay is in progress?
5. Can it be improved by any other means?
Transportation/
Movement
1. Can the transportation (movement) be cut out?
2. Can the number of transportation operations be reduced?
3. Can some other operation or test be carried out while
transportation is in progress?
4. Can the distance or time taken on transportation be
reduced?
5. Can it be improved by any other means?
Storage 1. Can the storage requirement be eliminated?
2. Can the storage time or lot numbers be reduced ?
3. Can the materials or parts be made more uniform?
4. Can anything else be done during storage?
5. Can improvement be achieved by other means?
7 Waste
• Defective Product
• Overproduction
• Inventories
• Transportation
• Motion
• Waiting
• Processing
WASTE
11/28/2018
63
lean thinking
To design process, gages, tooling, and fixtures in order to
prevent errors during manufacturing.
Control - eliminates the possibility of a mistake to occur
Warning - signals that a mistake can occur (blinking light, alarm, etc.)
Mistake Proofing in Process
11/28/2018
64
BEFORE
LH (Left Hand) FSS is sometimes
assembled to RH (RightHand)
Damper.
RH Damper cannot be loaded on
Fixture, so wrong part assemblyis
impossible.
AFTER
EXAMPLE MISTAKE PROOFING : FOULING
PIN
After Improvement :
Detecting pins were installed on the jig used for
checking the circuit boards after wiring. Circuit
boards without the proper holes cannot be
mounted on the jig. All circuit boards that lack
mounting holes are now detected before they
sent on to assembly.
Before Improvement :
Sometimes circuit boards could not be
mounted into their assemblies because screw
holes had not been drilled in them. The
workers in earlier processes relied on visual
checks to determine whether screw holes had
been drilled.
Description of Processes : Circuit boards are inspected, then later mounted into assemblies
EXAMPLE MISTAKE PROOFING :
ASSEMBLY JIG
11/28/2018
65
Packaging Standard
• To identify any packaging standard required by customer
• Must assure packaging design meet customer requirements
• Packaging design must assure product performance and
characteristics remain unchanged during packing and delivery
• Compatibility with all material handling equipment including
robots
Packaging Standard
Part Name Length
Part No. Width
Model Height
Customer Weight/pcs
Sensitive to:
Packaging Method Packaging Type
Quantity / Packing No of Layer
Packaging Weight Layering material
Packaging Size Packaging Identification
Sketch
Date Name Sign Date Name Sign Date Name Sign
Customer Review
Supplier Proposal
Approved By
Approved By
Prepared By
Part Information
Packaging Information
Part Packaging Data Sheet
Part
Dimension
(mm)
ARI-FRM-QA-007
11/28/2018
66
Measurement System Analysis Plan
• Plan to accomplish the required MSA
• Include as a minimum, the responsibility to ensure
gage linearity, accuracy, repeatability and
reproducibility
Preliminary Process Capability Plan
• Must include characteristics identified in control plan
• Include as a minimum:
– responsibility
– Cpk/ Ppk value
– time
11/28/2018
67
Phase 4
Product and Process Validation
APQP Five Phase Process
Plan And Define Program
Product Design and Development
Process Design and Development
Product and Process Validation
Production
Feedback Assessment and Corrective Action
Pilot Launch
Concept
Initiation/Approval
Program
Approval
Prototype
Planning
11/28/2018
68
Phase 4: Product and Process Validation
Outputs
• Measurement System Evaluation
• Preliminary Process Capability Study
• Production Validation Testing
• Packaging Evaluation
• Competency Evaluation
• Prototype making
• Cost Evaluation
• Production Trial
Measurement System Analysis
• To make sure that the measurement system - gages, personnel,
methods and procedure is stable and capable of measuring your data.
• Apply to measurement system referenced in the control plan
• Acceptance criteria shall conformto those in customer reference
manuals
11/28/2018
69
What Is a Measurement System Analysis
Input Measurement
System
Measurements
Outputs
Instruments
Methods
Materials
(Reference)
Manpower
Environment
Measurement System Analysis (MSA)
Continuous Improvement
Numbers (data)
• To assess the quality of a measurement system.
• To ensure that the variation in the measurement system is acceptable.
• To minimize the effects of measurement system error
• product decision
• process decision
• New process Acceptance
PURPOSE OF MSA
11/28/2018
70
Variation in MSA
Measurement SystemAnalysis
Location Variation (Accuracy) Width Variation(Precision)
Bias
Linearity
Stability
Repeatability
Reproducibility
MSA Studies Report
11/28/2018
71
Preliminary Process Capability Study
• Study the new process capability to ensure customer requirements
are met.
• Provide additional input for process control.
• Process Capability performance can be specified by customer.
• Focus on special characteristics
Traditional view - Inspection oriented
Loss
N
USL
LSL
Tolerance limits
11/28/2018
72
Quality view - SPC oriented
• The Idea of Taguchi: Even Small Deviations are Quality Losses
• It is not enough to look at “Good” vs “Bad” Outcomes
X1 X2
Loss
Scrap or
reworkcost
Taguchi loss
Loss
Capability / variance
• Variation of output of a process can give rise to defects
internally and/or passed onto customer
• Aim to reduce process variation to increase reliability of a
process
Nominal
Upper
specification
limit
Lower
specification
limit
±3
±6
Defects 1350 parts per million
Defects 0.001 ppm
11/28/2018
73
• Actual
• Meet Specification
• Improvement
USL
T
LSL
USL
T
LSL
T
USL
LSL
USL’
LSL’
The Strategy
The goal should not be 100% conformanceto specification(zero defect), but
the never-ending reduction of processes variation so that product/services are
as close to nominal
UCL
LCL
LCL
LCL
UCL
UCL
Process not centered
and not stable
Process centered
and stable
Additional improvements
made to the process
Improvements
11/28/2018
74
1 2 3 4 5 6 7 8 9 10 11 12 13 14 15 16 17
n 1 2 3 4 5 6 7 8 9 10 11 12 13 14 15 16 17
1 44.46 44.43 44.45 44.44 44.46 44.44 44.44 44.46 44.44 44.43 44.44 44.44 44.45 44.47 44.46 44.44 44.44
2 44.46 44.46 44.46 44.44 44.47 44.45 44.43 44.43 44.45 44.44 44.44 44.45 44.46 44.42 44.47 44.42 44.43
3 44.44 44.45 44.45 44.43 44.45 44.43 44.44 44.42 44.46 44.43 44.44 44.45 44.48 44.43 44.45 44.43 44.44
4 44.45 44.46 44.44 44.44 44.48 44.45 44.43 44.45 44.43 44.45 44.45 44.46 44.48 44.46 44.48 44.45 44.46
5 44.43 44.45 44.45 44.45 44.45 44.44 44.43 44.46 44.45 44.45 44.43 44.45 44.45 44.45 44.43 44.44 44.43
Average 44.448 44.45 44.45 44.44 44.462 44.442 44.434 44.444 44.446 44.44 44.44 44.45 44.464 44.446 44.458 44.436 44.44
Ra nge 0.03 0.03 0.02 0.02 0.03 0.02 0.01 0.04 0.03 0.02 0.02 0.02 0.03 0.05 0.05 0.03 0.03
Value
21 22 23 24 25 125
44.48
n 21 22 23 24 25 44.42
1 44.44 44.44 44.45 44.44 44.44 45.7
2 44.44 44.44 44.46 44.47 44.47 44.3
3 44.44 44.45 44.44 44.45 44.45 105.762
4 44.45 44.46 44.44 44.45 44.44 12.427
5 44.46 44.45 44.45 44.45 44.45 17.879
3.75968
19.698
12.427
4.142
0 25
ITEM
Number of readings
Max
imum
Minim um
Upper Spec Lim it (USL)
Lower Spec Lim it (LSL)
ZUSL
ZLSL
Perform ance index (Pp)
Capability Index (Cpk)
SW-34253 Characteristic
Company XYZ Sdn Bhd Part Name
AVERAGE X BAR AND R CONTROL CHART
Specification Lower Spe c 44.3
Description Bra cket Sample Size 5
Part Number
Performance Index (Ppk)
Capability Index (Cp)
Zm in
Upper Spe c 45.7
AV ERAGES ( X BAR CHART)
44.425
44.43
44.435
44.44
44.445
44.45
44.455
44.46
44.465
44.47
1 2 3 4 5 6 7 8 9 10 11 12 13 14 15 16 17 18 19 20 21 22
X BAR A VG OF X BAR UCL-XBAR LCL-XBAR
HIST OGR A M
44. 3
44.45
19
34
38
20
20
30
40
50
60
70
80
HISTOGRAM WITHOUT LIM IT
19
34
38
20
7
10
15
20
25
30
35
40
RANGE (R CHART)
0
0.01
0.02
0.03
0.04
0.05
0.06
0.07
1 2 3 4 5 6 7 8 9 10 11 12 13 14 15 16 17 18 19 20 21 22
R
A
N
G
E
R R BAR UCL-R LCL-R
Production Validation Testing
• Shall be performed in accordance with planned arrangement
• To ensure resulting product is capable to meet specified requirements
• Validation required such as
– material specification
– functional
– Dimensional
– Realibility/ Durability
11/28/2018
75
Product Validation (Example)
Prepared by:
No: Characteristic or parameter to be validated Specification Result Remarks
No:
Approved by:
Effective date:
TITLE:
Packaging Evaluation
• Assess the protection of the product from normal
transportation damage and adverse environmental factors
• Customer-specified packaging does not preclude in
evaluating the packaging method
11/28/2018
76
Packaging Evaluation: Example
Parts Packaging/Shipping Specifications
STATUS
(G/Y/R)
1 1 Has adequate protective packaging for finished product been defined?
1 2 Have records of test shipping containers and trips been documented? (Ex: What was used on PV build?)
1 3 Does the label meet AIAG and ASG requirements?
1 4 Have you completed and submitted ASG Packaging Data Forms (PDF) for all components?
1 5 Is your system ready to send Advance Ship Notices (ASN) for these parts?
1 6 Have you received a copy of the ASG routing instructions?
1 7
Has the shipping system been established to include:
1) Ship to Location & Dock Code
2) Shipment Frequency & Window
3) Primary Carrier
4) Expedite Carrier (Use NLM's One-Call only!)
5) Container Return/Maintenance
6) Saturday <Weekend?> Shipments
7
Quality Planning Sign-Off
• To review relevant documents to ensure
– Process instructions in place and followed
– Flow charts in place and followed
– Process Instruction is consistent with PFMEA and control plan
– GR&R meets the acceptable limit
11/28/2018
77
Quality Planning Sign-Off
DATE :
PRODUCT NAME PART NUMBER
CUSTOMER MANUFACTURING PLANT
1. PRELIMINARY PROCES S CAPABILITY STUDY
Ppk- SPECIAL CHARACTERISTICS
2. CONTROL PLAN APPROVAL (If required) APPROVED : YES/NO * DATE APPROVED :
3. INITIAL PRODUCTION S AMPLES
CHARACTERIS TIC CATEGORY
S AMPLES PENDING
DIMENSIONAL
VISUAL
LABORATORY
PERFORMANCE
4. GAGE AND TEST EQUIPMENT
MEASUREMENT SYSTEM ANALYSIS
SPECIAL CHARACTERISTIC
5. PROCESS MONITORING
PROCESS MONITORING INSTRUCTIONS
PROCESS SHEETS
VISUAL AIDS
6. PACKAGING / SHIPPING
PACKAGING APPROVAL
SHIPPING TRIALS
7. SIGN-OFF
QUANTITY
REQUIRED ACCEPTABLE PENDING *
QUANTITY
REQUIRED ACCEPTABLE PENDING *
QUANTITY
REQUIRED ACCEPTABLE PENDING *
QUANTITY
CHARACTERIS TICS
PER SAMPLE ACCEPTABLE
PRODUCT QUALITY PLANNING SUMMARY AND SIGN-OFF
QUANTITY
REQUIRED ACCEPTABLE PENDING *
Reduce the Cost of Components
• Understand the Process Constraints and Cost Drivers
• Redesign Components to Eliminate Processing Steps
• Choose the Appropriate Economic Scale for the Part
Process
• Standardize Components and Processes
• Adhere to “Black Box” Component Procurement
11/28/2018
78
Reduce the Costs of Assembly
• Design for Assembly (DFA) index
• Integrated Parts (Advantages and
Disadvantages)
• Maximize Ease of Assembly
• Consider Customer Assembly
Redesign Components to Eliminate
Processing Steps
• Reduce the number of steps of the
production process
– Will usually result in reduce costs
• Eliminate unnecessary steps.
• Use substitution steps, where applicable.
• Analysis Tool – Process Flow Chart and Value
Stream Mapping
11/28/2018
79
Production Trial Run
• Shall be conducted using production tooling,
equipment, environment, facility and cycle time
• Minimum quantity for a production trial run is
usually set by the customer
Product Approval Process
• The organization shall conform to a product and
manufacturing process approval procedure recognized by
the customer.
• This product and manufacturing process approval
procedure shall also be applied to suppliers
11/28/2018
80
Phase 5
Feedback Assessment and Corrective
Action
Phase 5: Outputs
• Reduce variation
• Corrective and Preventive Action
• Customer satisfaction
11/28/2018
81
Common techniques for process improvement
Input/output analysis Flow charts Scatter diagrams
Cause-effect diagrams Pareto diagrams Why-why analysis
Input Output
x
x
x x
x x
x
x
x
x x
Why?
Why?
Why?
Corrective Action Log
Quest. # Issue
Person
Responsible
Target
due date
Completion
date
Corrective Action Plan
11/28/2018
82
Drawing and Specification Change
• May be initiated during design review, design verification or
validation
• May be initiated upon Corrective action or continual improvement
activities,
• Change shall be reviewed, verify and revalidate where necessary
• To indicate the version number for any changed document
• To communicate changes to related personnel - distribution of
latest version
Design Change Flow
Engineering
Change Review
EngineeringChange
Verification
Perform
Design Change
Is revalidation
required
Perform
Design Validation
Engineering
ChangeNotice
Engineering
ChangeRequest
No
Yes
Result Ok
11/28/2018
83
Design Change Linkages
Work Instructions
PFMEA
Change in detection
Change in occurence
Change in severity
Control Plan
Design Change
Other Action
Control of document and records
• Shall determine appropriate level of control over
development activities. Control may include:
– Receiving of specification
– Distribution of specification
– Changes of specification
– Disposition of specification
– Drawing Format
– Electronic format
– Record retention

More Related Content

Similar to Automotive Core Tools APQP Training.pdf

Agile software development development explained
Agile software development development explainedAgile software development development explained
Agile software development development explained
Servan Huegen
 
Project management
Project managementProject management
Project managementAbhiMandyify
 
Ops 571 ops571 ops 571 best tutorials guide uopstudy.com
Ops 571 ops571 ops 571 best tutorials guide  uopstudy.comOps 571 ops571 ops 571 best tutorials guide  uopstudy.com
Ops 571 ops571 ops 571 best tutorials guide uopstudy.com
ULLPTT
 
Ops 571 ops571 ops 571 effective communication uopstudy.com
Ops 571 ops571 ops 571 effective communication   uopstudy.comOps 571 ops571 ops 571 effective communication   uopstudy.com
Ops 571 ops571 ops 571 effective communication uopstudy.com
ULLPTT
 
Ops 571 ops571 ops 571 forecasting and strategic planning -uopstudy.com
Ops 571 ops571 ops 571 forecasting and strategic planning -uopstudy.comOps 571 ops571 ops 571 forecasting and strategic planning -uopstudy.com
Ops 571 ops571 ops 571 forecasting and strategic planning -uopstudy.com
ULLPTT
 
Ops 571 ops571 ops 571 education for service uopstudy.com
Ops 571 ops571 ops 571 education for service   uopstudy.comOps 571 ops571 ops 571 education for service   uopstudy.com
Ops 571 ops571 ops 571 education for service uopstudy.com
ULLPTT
 
Yaswanth reddy 4.7 years.docx
Yaswanth reddy 4.7 years.docxYaswanth reddy 4.7 years.docx
Yaswanth reddy 4.7 years.docx
YASWANTH REDDY KETHIREDDY
 
Agile Project Management
Agile Project ManagementAgile Project Management
Agile Project Management
Syed Zaid Irshad
 
Prototype to production a startup perspective
Prototype to production   a startup perspectivePrototype to production   a startup perspective
Prototype to production a startup perspective
Witmer Health | i-calQ | Elado
 
Episode 21 : Project Scope Management
Episode 21 :  Project Scope ManagementEpisode 21 :  Project Scope Management
Episode 21 : Project Scope Management
SAJJAD KHUDHUR ABBAS
 
Collaboration Case Study Antec 2016
Collaboration Case Study Antec 2016Collaboration Case Study Antec 2016
Collaboration Case Study Antec 2016David Tucker
 
Unit 1 .pptx
Unit 1 .pptxUnit 1 .pptx
Unit 1 .pptx
Aditya Dhobale
 
Eliminate Bottlenecks in Software Development & Delivery
Eliminate Bottlenecks in Software Development & DeliveryEliminate Bottlenecks in Software Development & Delivery
Eliminate Bottlenecks in Software Development & Delivery
Micro Focus
 
Apqp bumming you out briefing may 30 2013
Apqp bumming you out briefing may 30 2013Apqp bumming you out briefing may 30 2013
Apqp bumming you out briefing may 30 2013
John Cachat
 
Tools and Techniques of Quality Planning
Tools and Techniques of Quality PlanningTools and Techniques of Quality Planning
Tools and Techniques of Quality Planning
Nicola Mezzetti
 
Episode 20 :PROJECT MANAGEMENT CONTEXT
Episode 20 :PROJECT MANAGEMENT CONTEXTEpisode 20 :PROJECT MANAGEMENT CONTEXT
Episode 20 :PROJECT MANAGEMENT CONTEXT
SAJJAD KHUDHUR ABBAS
 
APQP and PPAP Complete presentation .pdf
APQP and PPAP Complete presentation .pdfAPQP and PPAP Complete presentation .pdf
APQP and PPAP Complete presentation .pdf
nguyenanvuong2007
 

Similar to Automotive Core Tools APQP Training.pdf (20)

Agile software development development explained
Agile software development development explainedAgile software development development explained
Agile software development development explained
 
Project management
Project managementProject management
Project management
 
Ops 571 ops571 ops 571 best tutorials guide uopstudy.com
Ops 571 ops571 ops 571 best tutorials guide  uopstudy.comOps 571 ops571 ops 571 best tutorials guide  uopstudy.com
Ops 571 ops571 ops 571 best tutorials guide uopstudy.com
 
Ops 571 ops571 ops 571 effective communication uopstudy.com
Ops 571 ops571 ops 571 effective communication   uopstudy.comOps 571 ops571 ops 571 effective communication   uopstudy.com
Ops 571 ops571 ops 571 effective communication uopstudy.com
 
Ops 571 ops571 ops 571 forecasting and strategic planning -uopstudy.com
Ops 571 ops571 ops 571 forecasting and strategic planning -uopstudy.comOps 571 ops571 ops 571 forecasting and strategic planning -uopstudy.com
Ops 571 ops571 ops 571 forecasting and strategic planning -uopstudy.com
 
Ops 571 ops571 ops 571 education for service uopstudy.com
Ops 571 ops571 ops 571 education for service   uopstudy.comOps 571 ops571 ops 571 education for service   uopstudy.com
Ops 571 ops571 ops 571 education for service uopstudy.com
 
Yaswanth reddy 4.7 years.docx
Yaswanth reddy 4.7 years.docxYaswanth reddy 4.7 years.docx
Yaswanth reddy 4.7 years.docx
 
Chap002
Chap002Chap002
Chap002
 
Agile Project Management
Agile Project ManagementAgile Project Management
Agile Project Management
 
Prototype to production a startup perspective
Prototype to production   a startup perspectivePrototype to production   a startup perspective
Prototype to production a startup perspective
 
Episode 21 : Project Scope Management
Episode 21 :  Project Scope ManagementEpisode 21 :  Project Scope Management
Episode 21 : Project Scope Management
 
Collaboration Case Study Antec 2016
Collaboration Case Study Antec 2016Collaboration Case Study Antec 2016
Collaboration Case Study Antec 2016
 
Unit 1 .pptx
Unit 1 .pptxUnit 1 .pptx
Unit 1 .pptx
 
Eliminate Bottlenecks in Software Development & Delivery
Eliminate Bottlenecks in Software Development & DeliveryEliminate Bottlenecks in Software Development & Delivery
Eliminate Bottlenecks in Software Development & Delivery
 
Apqp bumming you out briefing may 30 2013
Apqp bumming you out briefing may 30 2013Apqp bumming you out briefing may 30 2013
Apqp bumming you out briefing may 30 2013
 
Tools and Techniques of Quality Planning
Tools and Techniques of Quality PlanningTools and Techniques of Quality Planning
Tools and Techniques of Quality Planning
 
Nisha DeThomas CV
Nisha  DeThomas CVNisha  DeThomas CV
Nisha DeThomas CV
 
Episode 20 :PROJECT MANAGEMENT CONTEXT
Episode 20 :PROJECT MANAGEMENT CONTEXTEpisode 20 :PROJECT MANAGEMENT CONTEXT
Episode 20 :PROJECT MANAGEMENT CONTEXT
 
APQP and PPAP Complete presentation .pdf
APQP and PPAP Complete presentation .pdfAPQP and PPAP Complete presentation .pdf
APQP and PPAP Complete presentation .pdf
 
Apqp la
Apqp laApqp la
Apqp la
 

Recently uploaded

What Does the PARKTRONIC Inoperative, See Owner's Manual Message Mean for You...
What Does the PARKTRONIC Inoperative, See Owner's Manual Message Mean for You...What Does the PARKTRONIC Inoperative, See Owner's Manual Message Mean for You...
What Does the PARKTRONIC Inoperative, See Owner's Manual Message Mean for You...
Autohaus Service and Sales
 
What do the symbols on vehicle dashboard mean?
What do the symbols on vehicle dashboard mean?What do the symbols on vehicle dashboard mean?
What do the symbols on vehicle dashboard mean?
Hyundai Motor Group
 
Tyre Industrymarket overview with examples of CEAT
Tyre Industrymarket overview with examples of CEATTyre Industrymarket overview with examples of CEAT
Tyre Industrymarket overview with examples of CEAT
kshamashah95
 
gtyccccccccccccccccccccccccccccccccccccccccccccccccccccccc
gtycccccccccccccccccccccccccccccccccccccccccccccccccccccccgtyccccccccccccccccccccccccccccccccccccccccccccccccccccccc
gtyccccccccccccccccccccccccccccccccccccccccccccccccccccccc
4thzenzstar
 
Why Is Your BMW X3 Hood Not Responding To Release Commands
Why Is Your BMW X3 Hood Not Responding To Release CommandsWhy Is Your BMW X3 Hood Not Responding To Release Commands
Why Is Your BMW X3 Hood Not Responding To Release Commands
Dart Auto
 
Digital Fleet Management - Why Your Business Need It?
Digital Fleet Management - Why Your Business Need It?Digital Fleet Management - Why Your Business Need It?
Digital Fleet Management - Why Your Business Need It?
jennifermiller8137
 
Ec330B Lc Excavator Volvo Service Repair.pdf
Ec330B Lc Excavator Volvo Service Repair.pdfEc330B Lc Excavator Volvo Service Repair.pdf
Ec330B Lc Excavator Volvo Service Repair.pdf
Excavator
 
Wondering if Your Mercedes EIS is at Fault Here’s How to Tell
Wondering if Your Mercedes EIS is at Fault Here’s How to TellWondering if Your Mercedes EIS is at Fault Here’s How to Tell
Wondering if Your Mercedes EIS is at Fault Here’s How to Tell
Vic Auto Collision & Repair
 
欧洲杯比赛投注官网-欧洲杯比赛投注官网网站-欧洲杯比赛投注官网|【​网址​🎉ac123.net🎉​】
欧洲杯比赛投注官网-欧洲杯比赛投注官网网站-欧洲杯比赛投注官网|【​网址​🎉ac123.net🎉​】欧洲杯比赛投注官网-欧洲杯比赛投注官网网站-欧洲杯比赛投注官网|【​网址​🎉ac123.net🎉​】
欧洲杯比赛投注官网-欧洲杯比赛投注官网网站-欧洲杯比赛投注官网|【​网址​🎉ac123.net🎉​】
ahmedendrise81
 
Core technology of Hyundai Motor Group's EV platform 'E-GMP'
Core technology of Hyundai Motor Group's EV platform 'E-GMP'Core technology of Hyundai Motor Group's EV platform 'E-GMP'
Core technology of Hyundai Motor Group's EV platform 'E-GMP'
Hyundai Motor Group
 
Statistics5,c.xz,c.;c.;d.c;d;ssssss.pptx
Statistics5,c.xz,c.;c.;d.c;d;ssssss.pptxStatistics5,c.xz,c.;c.;d.c;d;ssssss.pptx
Statistics5,c.xz,c.;c.;d.c;d;ssssss.pptx
coc7987515756
 
Ec460b lc Excavator Volvo Service Repair.pdf
Ec460b lc Excavator Volvo Service Repair.pdfEc460b lc Excavator Volvo Service Repair.pdf
Ec460b lc Excavator Volvo Service Repair.pdf
Excavator
 
Why Isn't Your BMW X5's Comfort Access Functioning Properly Find Out Here
Why Isn't Your BMW X5's Comfort Access Functioning Properly Find Out HereWhy Isn't Your BMW X5's Comfort Access Functioning Properly Find Out Here
Why Isn't Your BMW X5's Comfort Access Functioning Properly Find Out Here
Masters European & Gapanese Auto Repair
 
5 Warning Signs Your BMW's Intelligent Battery Sensor Needs Attention
5 Warning Signs Your BMW's Intelligent Battery Sensor Needs Attention5 Warning Signs Your BMW's Intelligent Battery Sensor Needs Attention
5 Warning Signs Your BMW's Intelligent Battery Sensor Needs Attention
Bertini's German Motors
 
What Causes 'Trans Failsafe Prog' to Trigger in BMW X5
What Causes 'Trans Failsafe Prog' to Trigger in BMW X5What Causes 'Trans Failsafe Prog' to Trigger in BMW X5
What Causes 'Trans Failsafe Prog' to Trigger in BMW X5
European Service Center
 
Things to remember while upgrading the brakes of your car
Things to remember while upgrading the brakes of your carThings to remember while upgrading the brakes of your car
Things to remember while upgrading the brakes of your car
jennifermiller8137
 
Bài tập - Tiếng anh 11 Global Success UNIT 1 - Bản HS.doc
Bài tập - Tiếng anh 11 Global Success UNIT 1 - Bản HS.docBài tập - Tiếng anh 11 Global Success UNIT 1 - Bản HS.doc
Bài tập - Tiếng anh 11 Global Success UNIT 1 - Bản HS.doc
daothibichhang1
 
What Exactly Is The Common Rail Direct Injection System & How Does It Work
What Exactly Is The Common Rail Direct Injection System & How Does It WorkWhat Exactly Is The Common Rail Direct Injection System & How Does It Work
What Exactly Is The Common Rail Direct Injection System & How Does It Work
Motor Cars International
 
一比一原版(AIS毕业证)奥克兰商学院毕业证成绩单如何办理
一比一原版(AIS毕业证)奥克兰商学院毕业证成绩单如何办理一比一原版(AIS毕业证)奥克兰商学院毕业证成绩单如何办理
一比一原版(AIS毕业证)奥克兰商学院毕业证成绩单如何办理
eygkup
 
Empowering Limpopo Entrepreneurs Consulting SMEs.pptx
Empowering Limpopo Entrepreneurs  Consulting SMEs.pptxEmpowering Limpopo Entrepreneurs  Consulting SMEs.pptx
Empowering Limpopo Entrepreneurs Consulting SMEs.pptx
Precious Mvulane CA (SA),RA
 

Recently uploaded (20)

What Does the PARKTRONIC Inoperative, See Owner's Manual Message Mean for You...
What Does the PARKTRONIC Inoperative, See Owner's Manual Message Mean for You...What Does the PARKTRONIC Inoperative, See Owner's Manual Message Mean for You...
What Does the PARKTRONIC Inoperative, See Owner's Manual Message Mean for You...
 
What do the symbols on vehicle dashboard mean?
What do the symbols on vehicle dashboard mean?What do the symbols on vehicle dashboard mean?
What do the symbols on vehicle dashboard mean?
 
Tyre Industrymarket overview with examples of CEAT
Tyre Industrymarket overview with examples of CEATTyre Industrymarket overview with examples of CEAT
Tyre Industrymarket overview with examples of CEAT
 
gtyccccccccccccccccccccccccccccccccccccccccccccccccccccccc
gtycccccccccccccccccccccccccccccccccccccccccccccccccccccccgtyccccccccccccccccccccccccccccccccccccccccccccccccccccccc
gtyccccccccccccccccccccccccccccccccccccccccccccccccccccccc
 
Why Is Your BMW X3 Hood Not Responding To Release Commands
Why Is Your BMW X3 Hood Not Responding To Release CommandsWhy Is Your BMW X3 Hood Not Responding To Release Commands
Why Is Your BMW X3 Hood Not Responding To Release Commands
 
Digital Fleet Management - Why Your Business Need It?
Digital Fleet Management - Why Your Business Need It?Digital Fleet Management - Why Your Business Need It?
Digital Fleet Management - Why Your Business Need It?
 
Ec330B Lc Excavator Volvo Service Repair.pdf
Ec330B Lc Excavator Volvo Service Repair.pdfEc330B Lc Excavator Volvo Service Repair.pdf
Ec330B Lc Excavator Volvo Service Repair.pdf
 
Wondering if Your Mercedes EIS is at Fault Here’s How to Tell
Wondering if Your Mercedes EIS is at Fault Here’s How to TellWondering if Your Mercedes EIS is at Fault Here’s How to Tell
Wondering if Your Mercedes EIS is at Fault Here’s How to Tell
 
欧洲杯比赛投注官网-欧洲杯比赛投注官网网站-欧洲杯比赛投注官网|【​网址​🎉ac123.net🎉​】
欧洲杯比赛投注官网-欧洲杯比赛投注官网网站-欧洲杯比赛投注官网|【​网址​🎉ac123.net🎉​】欧洲杯比赛投注官网-欧洲杯比赛投注官网网站-欧洲杯比赛投注官网|【​网址​🎉ac123.net🎉​】
欧洲杯比赛投注官网-欧洲杯比赛投注官网网站-欧洲杯比赛投注官网|【​网址​🎉ac123.net🎉​】
 
Core technology of Hyundai Motor Group's EV platform 'E-GMP'
Core technology of Hyundai Motor Group's EV platform 'E-GMP'Core technology of Hyundai Motor Group's EV platform 'E-GMP'
Core technology of Hyundai Motor Group's EV platform 'E-GMP'
 
Statistics5,c.xz,c.;c.;d.c;d;ssssss.pptx
Statistics5,c.xz,c.;c.;d.c;d;ssssss.pptxStatistics5,c.xz,c.;c.;d.c;d;ssssss.pptx
Statistics5,c.xz,c.;c.;d.c;d;ssssss.pptx
 
Ec460b lc Excavator Volvo Service Repair.pdf
Ec460b lc Excavator Volvo Service Repair.pdfEc460b lc Excavator Volvo Service Repair.pdf
Ec460b lc Excavator Volvo Service Repair.pdf
 
Why Isn't Your BMW X5's Comfort Access Functioning Properly Find Out Here
Why Isn't Your BMW X5's Comfort Access Functioning Properly Find Out HereWhy Isn't Your BMW X5's Comfort Access Functioning Properly Find Out Here
Why Isn't Your BMW X5's Comfort Access Functioning Properly Find Out Here
 
5 Warning Signs Your BMW's Intelligent Battery Sensor Needs Attention
5 Warning Signs Your BMW's Intelligent Battery Sensor Needs Attention5 Warning Signs Your BMW's Intelligent Battery Sensor Needs Attention
5 Warning Signs Your BMW's Intelligent Battery Sensor Needs Attention
 
What Causes 'Trans Failsafe Prog' to Trigger in BMW X5
What Causes 'Trans Failsafe Prog' to Trigger in BMW X5What Causes 'Trans Failsafe Prog' to Trigger in BMW X5
What Causes 'Trans Failsafe Prog' to Trigger in BMW X5
 
Things to remember while upgrading the brakes of your car
Things to remember while upgrading the brakes of your carThings to remember while upgrading the brakes of your car
Things to remember while upgrading the brakes of your car
 
Bài tập - Tiếng anh 11 Global Success UNIT 1 - Bản HS.doc
Bài tập - Tiếng anh 11 Global Success UNIT 1 - Bản HS.docBài tập - Tiếng anh 11 Global Success UNIT 1 - Bản HS.doc
Bài tập - Tiếng anh 11 Global Success UNIT 1 - Bản HS.doc
 
What Exactly Is The Common Rail Direct Injection System & How Does It Work
What Exactly Is The Common Rail Direct Injection System & How Does It WorkWhat Exactly Is The Common Rail Direct Injection System & How Does It Work
What Exactly Is The Common Rail Direct Injection System & How Does It Work
 
一比一原版(AIS毕业证)奥克兰商学院毕业证成绩单如何办理
一比一原版(AIS毕业证)奥克兰商学院毕业证成绩单如何办理一比一原版(AIS毕业证)奥克兰商学院毕业证成绩单如何办理
一比一原版(AIS毕业证)奥克兰商学院毕业证成绩单如何办理
 
Empowering Limpopo Entrepreneurs Consulting SMEs.pptx
Empowering Limpopo Entrepreneurs  Consulting SMEs.pptxEmpowering Limpopo Entrepreneurs  Consulting SMEs.pptx
Empowering Limpopo Entrepreneurs Consulting SMEs.pptx
 

Automotive Core Tools APQP Training.pdf

  • 1. 11/28/2018 1 Automotive Core Tools APQP Training on understanding, workshop and competency assessment For FEC CABLES Sdn Bhd Presented by ABDUL RASHID HM ADVANCE PRODUCT QUALITY PLANNING (APQP) 2ND EDITION PART 1
  • 2. 11/28/2018 2 Course objective • To understand the purpose of APQP • To understand appropriate activities for each phase of APQP • To understand the required inputs and outputs of each phase • To understand the relationship of quality core tools • The goal of PQP is to facilitate communication between all persons and activities involved during product development program and ensure that all required steps are completed on time, at acceptable cost and quality levels. The Goal of PQP
  • 3. 11/28/2018 3 Design For Quality Evolution on Quality Inspect For Quality Manage For Quality Concept of Design Design Creativity Analytical Use of right-brain- generating new concpet and ideas Use of left-brain - of analysis method in design activities *Traditionalapproach focus more on creativityside only
  • 4. 11/28/2018 4 What is Advanced Product Quality Planning • A structured method and steps for product development process. • Initiated by Ford during Ford Taurus development - 1980 • Applied to both products and manufacturing process design • A simultaneous product development system that replaces sequential phases/ pass-off system ORGANIZATION WITHOUT SYSTEM
  • 5. 11/28/2018 5 • Can reduce lead time of new product to market • Can facilitate effectivecommunication with everyone involved during development stage. • Can improve communication process between supplier and their customer • Can prevent defect at the early stage • Can produce a quality product on time at the lowest cost. Benefit of APQP APQP Cycle Feedback Assessment and Corrective Action Process Design and Development Plan and Define Product Design and Development Product and Process Validation
  • 6. 11/28/2018 6 Concurrent Engineering Concurrent engineering is the bringing together of engineering design and manufacturing personnel early in the design phase. Conventional and APQP process First stage in design 2nd stage in design 3rd stage in design 4th stage in design First stage in design 2nd stage in design 3rd stage in design 4th stage in design (a) Conventional - Sequential process (b) APQP - Concurrent process Reduction of development period
  • 7. 11/28/2018 7 Conventional flow of product/process development Product Planning Design Prototype Production Delivery Interdepartmental wall (invisible) Interdepartmentalinvisible wall will result to : • late in discoveringproblems • Excessive number of design revisions • late in taking corrective actions “Over the Wall” Approach Design Mfg New Product
  • 8. 11/28/2018 8 Concurrent Engineering vs. “Over the wall” • Manufacturing personnel are able to identify production capabilities and capacities • Early opportunities for design or procurement of critical tooling • Early consideration of the technical feasibility of a particular design • The emphasis can be on the problem resolution instead of conflict resolution APQP process may reduce mistake during development Mistakes Previous Method Concurrent Engineering
  • 9. 11/28/2018 9 Engineering Changes during development Company B Company A Time The effect of design on manufacturing cost Poor Design Average Design Good Design Efficient Manufacturing Average Manufacturing Inefficient Manufacturing
  • 10. 11/28/2018 10 Team Organization • Select team leader • Understanding of “How we work as a team” • Team should understand etc
  • 11. 11/28/2018 11 Multidisciplinary approach in APQP • To assign responsibility to a multidisciplinaryteam that include different function such as: – Design – Marketing – Quality Assurance – Manufacturing – other appropriate personnel • Encourageto involve customer/ supplier Function Process Product Planning Design Purchasing W’housing Sales Marketing Quality Cost Delivery a)New Products b)Existing Products Cross Function Management Customers Cross Function Management Customers functional Management Strong Relation Strong Relation Relation Relation Little Relation Little Relation Cross Functional Management
  • 12. 11/28/2018 12 Multidisciplinary approach in APQP Product Planning Design Prototype Production Delivery Quality Marketing Objective: Pass through once only The Five Phases of APQP • Phase 1: Plan and Define Program • Phase 2 : Product Design and Development • Phase 3 : Process Design and Development • Phase 4 : Product and Process Validation • Phase 5 : Feedback, Assessment and Corrective Action
  • 13. 11/28/2018 13 APQP Five Phase Process Plan And Define Program Product Design and Development Process Design and Development Product and Process Validation Production Feedback Assessment and Corrective Action Pilot Launch Concept Initiation/Approval Program Approval Prototype Planning APQP Timing Schedule Start Finish Start Finish Jan Feb Mac Apr May Jun Jul Aug Sep Task Name No Plan Actual 2003 Duration
  • 14. 11/28/2018 14 Phase 1 Plan and Define Program APQP Five Phase Process Plan And Define Program Product Design and Development Process Design and Development Product and Process Validation Production Feedback Assessment and Corrective Action Pilot Launch Concept Initiation/Approval Program Approval Prototype Planning
  • 15. 11/28/2018 15 Phase 1: Plan and Define Program • Early stage of the APQP • To ensure that customer needs and expectations are clearly understood • Shall use customer needs and expectations to plan and define a quality program. Phase 1: Plan and Define Program • Inputs – Voice of customer (VOC) • Market Research • HistoricalWarranty and Quality Information • Lesson learnt from past experience – Product Concept – Product Benchmark data
  • 16. 11/28/2018 16 Voice Of Customer Conventional design process focus more on engineering capabilities and less on customer needs WHAT IS QUALITY ? Customer requirements As manufactured As delivered Quality gap “Qualityis meeting customer requirements and expectation” “The only real measure of business successis a satisfiedcustomer,all else is a distraction” Barrie Hopson
  • 17. 11/28/2018 17 Increased productivity Quality Meets Customer requirements Meets customer expectations Exceeds customer expectations Reduced rework/repair Reduced costs Satisfy Customer Reduced returns, complaints, warranty Repeat Order Delight Customer Customer Loyalty Increased profit CUSTOMER SATISFACTION Voice Of Customer Customer A process used to capture the requirements/feedback from customerto provide with the best service/product quality Market Research Historical Warrant Past Experiences Other methods may be used such as focus group,etc
  • 18. 11/28/2018 18 Market Research Surveyquestionaire The following is a list of vehicle features. Please read the entire list and place an X next to those of that you particlularly like Room & Comfort Front Room Front Seat Comfort Entry & Exit from front Cargo Capacity Cargo loading Interior Appearance Seat Appearance Instrument Panel Door Panels Console Box Carpeting • Customer Interviews • Customer questionaires and surveys • New product quality and reliability studies • Competitive product quality studies Historical Warranty and Quality Information • Complaints analysis • Things gone Wrong reports • Warranty reports • Customer plants returns and rejections analysis • Field return product analysis Complaints Analysis 12 10 8 7 5 Paint mist Color difference between body panel Uneven color on one body panel Paint peel off Rust, corrosion 5 Scratch paint 4 3 2 Dirt in paint Chipped paint Runs in paint
  • 19. 11/28/2018 19 Lessons learnt from past experience • Input from higher systemlevel or past QFD project • Media commentary and analysis • Customer letters and suggestions • Dealer Comments • Operator comments • Problems and issues reported from Internal Customer • Government requirements or regulations Design Concept • Get information related to the product • Define the overall system • Find the overall function that needs to be accomplishes • Create sub-function description • Generate concept alternative – Brainstorming – Use analogies in design – Use extreme and inverse – Find ideas in reference book – Using experts to help generate concept – Using ideas from competitor – morphological method
  • 20. 11/28/2018 20 Product Information • Product Information shall include the following: – What is the intended use of this product; heavy duty, normal duty, – Who are using this product; youngster,family – Where it shall be used; town, corrosive environment – When it will be used; at night, morning, evening – How it will be used; Define the overall system • Shall understand the appropriate level - System, subsystem or component • The team member must decide on what constitutes a system,subsystem or component • The actual boundaries that divide a system, subsystem and component are arbitrary
  • 21. 11/28/2018 21 Television RF tuner Video detecteor Video Amplifier Picture Tube Electron gun Deflectio n coils Final anode Screen System Sub- System Component Determine level of system Determine the product function • Determine the function of the product to meet design intent • An accurate statement of product function will effect the work performance and desired result • FUNCTION OF PICTURE TUBE – To convert the video (electrical) signals into optical (picture) signal Input Desired results Product Function
  • 22. 11/28/2018 22 Create sub-function description • Electron gun : To shoot and control flow of electrons to the screen. • Deflection coils: To deflect the electron beam in horizontal and vertical direction using electromagnetic system • Final anode; to provide sufficient and energy for the electron beam. • Screen: To integrate the electron into color and optical view Design concept alternative
  • 23. 11/28/2018 23 To consider the following issues: • Legal requirements – Any regulation that related to the product • Safety (Product liability); – a manufacturer is liable for any injuries or damages caused by a faulty product. • Environmental – A manufacturer is liable for any aspect that would impact the environment. Legal, Safety, and Environmental Issues Product Benchmark Data • To gather ideas from competitor’s practices • To provide inputs for establishing performance targets • Method for successful benchmarking: – Identify benchmark subject – Identify benchmark partner (best practice) – Collect data – Find reason for gap between your status and benchmark – Develop plan for closing gap, meeting or exceeding benchmark
  • 24. 11/28/2018 24 THE BENCHMARKING MENU Internal best practicesby function Functional best practices-any company Industrybest practices (includes non competitors) Competitors best practices Functional best practices-world class THE BENCHMARKING MODEL Company Process American Express Collections American Hospital Supply Inventory control AT & T Research and development Baxter International Employee recognition and human management Cumming Engine Plant layout and design; supplier certification Dow Chemical Supplier Certification Florida power & Light The quality process Hewlett Packard Research & Development engineering L.L. Bean Inventory control; distribution; telephonic Marriott Customer survey techniques Milliken Employee recognition USAA Telephonic
  • 25. 11/28/2018 25 Identify benchmarking partners Industry survey Customer/Supplier interview Knowledge sharing consortium 1:1 Easy to get, cheap Hard to get, costly Benchmark with other industry No 1 Long admission times in hospitals Hotel Receptions 2 Lengthy machine setup Formula One pit crew 3 Delivery of fresh concrete Hot pizza delivery 4 Unstructured maintenance of power turbines Maintenance of aircraft engines 5 Difficult to manufacture cylindrical shape Manufacturing of lipstick tubes Problem Compared with
  • 26. 11/28/2018 26 Product Benchmark Data Weighting 2 4 1 1 Competitor A 5 5 2 2 34 RM25 Competitor B 5 3 4 7 33 RM23 Competitor C 4 5 5 5 38 RM30 Competitor D 5 6 9 3 46 RM37 • Useful tools for plan and define stage. – Needs-Metrics Tables – Quality Function Deployment- QFD – Competitive Benchmarking Analyze Data vs. Requirements Correlate Requirements with Measures measure requirements
  • 27. 11/28/2018 27 Quality Function Deployment (Example) Phase 1: Plan and Define Program • Outputs – APQP timing schedule – Design and Quality goals – Product Costing – Preliminary Listing of Special Characteristics – Feasibility and risk analysis
  • 28. 11/28/2018 28 To plan and control the process of design and development Shall include : design and developments stages The required activities in development stages Responsibilities and authorities To manage the interfaces between groups involved To update Plan as and when required APQP Timing schedule APQP Timing Schedule Start Finish Start Finish Jan Feb Mac Apr May Jun Jul Aug Sep Task Name No Plan Actual 2003 Duration
  • 29. 11/28/2018 29 Product Costing • First estimation should made early and be precise enough to be use in making decisions : – not to continue – to proceed • Other decision to be made for components: – purchase component from vendor – manufacture in hour • Accuracy normally based on previous experience The Effect of design on manufacturing cost Poor design Average Design Good Design EfficientManufacturing Average Manufacturing InefficientManufacturing Manufacturing cost
  • 30. 11/28/2018 30 Product Costing • Fixed costs – Overhead; all cost for administration,engineering, utilities that occur day to day, even if no product rolls out of door. – Tooling; cost include all jig, fixtures and mold • Variable Costs – Purchased part; expenses of all the materials/part that are purchased for a product including scrap – Labor; cost of wages and benefits to the workforce – Selling expenses – Profit Fixed Costs vs. Variable Costs • Fixed Costs – incurred in a predetermined amount, regardless of number of units produced (i.e. setting up the factory work area or cost of an injection mold) • Variable Costs – incurred in direct proportion to the number of units produced (i.e. cost of raw materials)
  • 31. 11/28/2018 31 Product Costing Purchased parts Labor Tooling Overhead Selling Expenses Profit Fixed costs Variable costs Manufacturing costs Total costs Estimate the Manufacturing Costs Finished Goods Manufacturing System Equipment Information Tooling Waste Services Supplies Energy Raw Materials Labor Purchased Components
  • 32. 11/28/2018 32 Significant factor affecting cost • From what material is the component to be manufactured? • What type of machine is used to manufactured the component? • What are the major dimensions of the component? • How many machined surfaced are there, and how much material is to be removed? • How many components are made? • What tolerance and surface finishes are required? • What tolerance and surface finished are required? • What is the labor rate for machinists? Preliminary listing of Special Characteristic • Product characteristic or manufacturing process parameter that can affect: – safety – compliance with regulations – fit – function – performance • Identified by customer or selected by the supplier • use symbol provided by customer(if any) S S
  • 33. 11/28/2018 33 Feasibility and risk analysis • Shall investigate, confirm and document manufacturing feasibility of the proposed products. • Shall determine whether the proposed design can be manufactured, assembled, tested, packaged and delivered in sufficient quantity, at an acceptable cost • Proposed design should be documentedand presented to management for their support. Feasibility and risk analysis • Usually has one or three reactions: – It is not feasible, it will never work – It might work if something else happens – It is worth considering
  • 34. 11/28/2018 34 Risk Assessment • Risk analysis should include : – High warranty of current models – New supplier – New manufacturing location – New product or manufacturing technology – High product or process complexity – Program timing is compressed – Cost targets are aggressive – Reliability goals will be difficultto achieve Feasibility Analysis (example) Customer: ____________________________________ Date: ___________________ Part Number : _________________________________ Part Name :______________ YES NO CONSIDERATION Is product adequately defined (application requirements, etc) to enable feasibility evaluation ? Can Engineering Performance Specifications be met as written ? Can product be manufactured to tolerance specified on drawing ? Can product be manufactured with Cpk's that meet requirements ? Is there adequate capacity to produce product Does the design allow the use of efficient material handling techniques ? Can the product be manufactured without incurring any unusual: * Costs for capital equipment? * Cost for tooling ? Alternative manufacturing methods ? Is statistical process control required on product? Is statistical process control presently used on similar products: * Are the process in control and stable ? * Are the Cpk's greater than 1.33 ? Conclusion Feasible Product can be produced as specified with no revisions Feasible Change recommended (see attached) Not Feasible Design revision required to produce product within the specified requirements Sign-Off TEAM FEASIBILITY COMMITMENT
  • 35. 11/28/2018 35 Risk Assessment No. Type of Risk Risk (low, medium or high) 1 Product failure due to new design 2 Product failure due to manufacturing techniques are new to industry 3 Product failure due to high product or process complexity 4 Product failure because the product is strategically important due to high visibility or functional performance 5 Design goal is difficult to achieve 6 Reliability goals are difficult to achieve 7 Quality goals (warranty, TGW, scrap rates, rework rates) will be difficult to achieve 8 Prototype is not able to deliver on time because program timing is compressed 9 Product is not able to deliver on time because program timing is compressed 10 Chance of a product recall 11 Others For risk evaluated to be high or medium, controls or action plans are required. If controls or action plans are deemed to be ineffective, the company should consider to decline the order. Conclusion: _______________________________________________________________ Phase 2 Product Design and Development
  • 36. 11/28/2018 36 APQP Five Phase Process Plan And Define Program Product Design and Development Process Design and Development Product and Process Validation Production Feedback Assessment and Corrective Action Pilot Launch Concept Initiation/Approval Program Approval Prototype Planning Phase 2: Product Design and Development Outputs • Target for Product Quality • Engineering drawings • Engineering Specification • Safety and Regulatory Requirements • Design For Manufacturability and Assembly • Special Characteristics • DFMEA • Design Verification New Equipment, tooling and facilities requirements Gages/ Testing Equipment Requirements Product Mistake Proofing
  • 37. 11/28/2018 37 Target for Product Quality • To identify, document and review targets for product design: • Eg: – MTBF = Mean Time Between Failure – MTTR = Mean Time To Repair – Life – Reliability – Durability – Maintainability – Timing and cost • Customer Needs lead to Product Specs The Customer expresses the need in terms of What the product must do. The robot can quickly change alignment without forward motion. The Product Specification sets metrics and values that allow quantification of the user need. The Robot can rotate 360 degrees in 2 secs without forward motion .
  • 38. 11/28/2018 38 A extension of the short-term memory after idea generation. To represent concept that are more abstract and best represented. To archive the geometric form of design Communicate ideas between designers and other related personnel. Simulate the operation of the product To check the completeness of design Engineering Drawings Layout drawings refer as working drawing; made to scale Only important dimensions are shown in a layout drawing Tolerances are usually not shown, unless they are critical As detail drawings and assembly drawing developed, the layout drawing becomes less useful. Focus on system and sub-system Detail drawings Include all dimension and tolerance Include material and manufacturing detail Shall be approved by management Address to single component Type of drawing
  • 39. 11/28/2018 39 Assembly drawings Use to show how the components fit together Include bill of materials References can be made to other drawings and specific assembly instructions a for additional needed information. Shall be approved by management Type of drawing Shall be reviewed to determine: Sufficient information for dimensional layout Dimensions and tolerance are feasible to be manufactured Tolerance are compatible to gage accuracy Information for fitting, function, durability Any governmental regulatory safety requirements Any special characteristics Shall be able to communicate in customer specified language Engineering Drawings
  • 40. 11/28/2018 40 Engineering Drawings Shall be established to meet customer requirements or contracts. Shall transform qualitative into quantitative information. Eg: speed, length, dimension, stress, etc Shall include acceptance criteria - target to be met Shall be reviewed to ensure: Sufficient information including the acceptance criteria Capability to meet such requirements Complete and no ambiguous information Engineering Specification
  • 41. 11/28/2018 41 To review material specification such as: Physical properties Performance Environmental Handling Storage To communicate to relevant supplier Material Specification Bill of Material • The bill material is like an index to the product • To identify what exactly will go into the product • To identify the quantities of each component part required to make up the total package • Based on product/ process assumptions
  • 42. 11/28/2018 42 Bill of Material Typical information in bill of material • The item number • The part number • The quantity needed in the assembly • The name or description of the component • The material flow from which the component is made • The source of the component Bill of Material No Item Product Code Quantity used Weight Supplier
  • 43. 11/28/2018 43 Safety and Regulatory Requirements • To identify applicable safety standards and regulation • To analyze safety in design, purchased component and manufacturing. • carry out design evaluation test for safety • Prepare instruction and warning to the user, maintenance manual and labeling To improve the design concept for easy and low-cost assembly/ manufacturing by: reducing the number of parts optimising manufacturing processes simplifying parts handling improving product assembly Design for manufacture and Assembly (DFMA)
  • 44. 11/28/2018 44 AEM & DFS: Pneumatic Pump •Assembly Sequence: 6. Two screws 5. One cover 4. One spring 3. One piston stop 2. One piston 1. One main body •Tool: –A screw driver DFMA : Example
  • 45. 11/28/2018 45 DFMA : Example Advantages of Standardization • Fewer parts to deal with in inventory & manufacturing • Design costs are generally lower • Reduced training costs and time • More routine purchasing, handling, and inspection procedures • Orders fillable from inventory • Opportunities for long production runs and automation • Need for fewer parts justifies increased expenditures on perfecting designs and improving quality control procedures
  • 46. 11/28/2018 46 Design for Reliability • To ensure quality over the long term • Is the ability of product to perform its intended function over a period of time and under prescribed environmental conditions. THE FAILURE ‘BATH TUB’ CHANGE FAILURE PHASES WEAROUT PHASES EARLY FAILURE PHASE Operating Time (Componentage or time)
  • 47. 11/28/2018 47 DESIGN FOR RELIABILITY Equipment deterioration Safety Margin Design Strength Distribution of stress Areas where the two (stesses and strength) overlap (Time ), t Be aware of the environmental effects of the materials used in product Design the product with high separability Design components that can be reused or recycle Be aware of the environmental effects of the material not reused. Design for Environment (DFE)
  • 48. 11/28/2018 48 To analyse what could go wrong in the design system such as component, subsystem or system To develop a ranked list of potential failure modes according to their effects on system and vehicle operations To establish a priority system for design improvements, development and validation Design FMEA Design FMEA Item Potential Potential Current R. Recommended Action Results R. Function Failure Effect(s) of Process P. Action(s) Taken P. Mode Failure Controls N. N. Requirements S e v C l a s s O c c u r D e t e c ofFailure Action Results Potential Responsibility S e v O c c D e t Cause (s) / & Target Mechanism(s) Completion Date
  • 49. 11/28/2018 49 Design Verification Result • Perform in accordance with planned arrangement • Method of verification such as: – Alternate calculation - strength, force, strain, etc – Stress analysis – Computer software calculation • Review verificationresult • May review the correctness of design calculation New tooling and facilities requirements • To identify requirements for new tooling • To provide soft / hard tooling development plan • To identify sub-contractor for tooling • To ensure development meet timing plan and delivered on time • To provide technical guidance to sub-contractor • To verify new tooling prior to accept
  • 50. 11/28/2018 50 Gages and testing Equipment requirements • To identify new inspection, test and measurement equipment • To identify the accuracy required • To ensure equipment is ready on time Gages and testing Equipment requirements No Testing required Test Equipment unit available Accuracy GAGES/ TESTING REQUIREMENT
  • 51. 11/28/2018 51 Special Characteristics • Upgrade preliminary list stated in Phase 1 • Identify customer-specifieddefinitions and symbols or organization’s equivalent symbol • Include in the control plan • Identify process control documents including drawings,FMEAs, control plans, and operator instructions Product error-proofing • To design product in achieving zero defect • To avoid errors due to human mistake. • May reduce occurrence and detection ranking in FMEA
  • 52. 11/28/2018 52 Product error-proofing Prototype Program • Shall have a prototype program and control plan when required by customer • Whenever possible, use same suppliers, tooling and manufacturing processes • Monitor Performance-testingfor timely completion and conformity to requirements • Provide technical leadership for any services outsource
  • 53. 11/28/2018 53 Phase 3 Process Design and Development APQP Five Phase Process Plan And Define Program Product Design and Development Process Design and Development Product and Process Validation Production Feedback Assessment and Corrective Action Pilot Launch Concept Initiation/Approval Program Approval Prototype Planning
  • 54. 11/28/2018 54 Phase 3: Process Design And Development Outputs • Target for Manufacturing process • Process Flow Chart • Control Plan • Process FMEA • Work Instructions • Packaging Standards • Floor Plant Layout • Process Error Proofing Measurement Systems Analysis Plan Preliminary Process Capability Study Plan Management Support Target for manufacturing Process • To identify, document and review targets for manufacturing process design: • Eg: – Quality – process capability – productivity – Manufacturibility – Timing
  • 55. 11/28/2018 55 Process Flow Chart • May upgrade from preliminary process flow chart in phase 1 • Schematic representation of the current or proposed process flow from receiving to final product • Can assist the team to conduct PFMEA and develop control plan • Any changes required should be updated in the manual/procedure Process Flow Chart Virgin QC Mixing Pre-heat Moulding QC Recycle QC triming Assembly Packing
  • 56. 11/28/2018 56 Control Plan • Type of control plan: – prototype – pre-launch – production • The control plan shall : – list the control used for the manufacturing process control – Include methods for monitoring of control exercised over special characteristics – identify the specified reaction plan and corrective action • Shall be reviewed when any change occurs Control Plan • The control plan shall include: – Process name – Machine – Product characteristics – Process characteristics – Special characteristics – Product/process specification – Measuring technique – Sample size and frequency – Control method – Reaction Plan – Corrective Action
  • 57. 11/28/2018 57 Control Plan No 11 a Overall height of form cup Ø 24.0 ± 0.4 Height gauge issue CAR for b Inside diameter Ø 15.6 ref Caliper repeated problem c Appearance Free from chip mark Visual d Setting parameter Refer Tool Setting Sheet (BMSB 0915) 12 a Overall diameter Ø163.5 ref Caliper issue CAR for b Distance from center to center holes 90.0 ± 0.5 Caliper repeated problem c Hole diameter Ø36.0 ± 0.3 Caliper d Appearance Free from burr Visual e Setting parameter Refer Tool Setting Sheet (BMSB 0915) 13 a Redrawheight (outside) 2.2 -0/ +0.4 Height gauge issue CAR for b Redrawheight (inside) 1.9 -0/ +0.5 Height gauge repeated problem c Waviness 0.15 max Height gauge d Appearance Free from chip mark Visual e Setting parameter Refer Tool Setting Sheet (BMSB 0915) 14 a Overall diameter Ø161.0 ± 0.1 Caliper issue CAR for b Appearance Free from burr Visual repeated problem Corrective Action 1/4 hours batch Periodical insp 1 batch 1st sample Every F 1/4 hours set up set up C H Process Size Measuring Technique 1st sample Characteristic Special Char. 1 1 batch 1 1 1/4 hours batch F Control Method 2 Reaction Plan Sample H OP 130 HME 30T OP 110 Center piercing Redraw Li Chin H 250T 1 Method Clip & Pierce Li Chin 200T No Process Name/ Machine, Jig Product/ Process Spec/ Tol Product Visual insp. batch Freq batch 1st sample C 1st sample C C Visual C part set up Every 2 1st sample C E batch 1st sample 1st sample 1st sample 1st sample Visual insp. OP120 batch H H H 1 Visual insp. 2 batch 1st sample 1 Every C 1st sample Every C OP 140 Trimming Suga 5 Update the Control Plan Process Flow Control Plan FMEA Work Instruction Scrap, Rework Data Warranty & Assembly Plant Data
  • 58. 11/28/2018 58 Process FMEA • To identify potential failure due to manufacturing or assembly process. • To assess the effects of the potential failures on the customer • To focus controls for occurrence reduction or detection • To establish a ranked list of potential failure modes based on RPN calculated FMEA Design Potential Failure PotentialCause Effects
  • 59. 11/28/2018 59 Establish Potential Failure Mode Process Function / Requirements PotentialFailure Mode Component Insertion Insert LED of differentcolours on to PC Board with the right polarity and in the right sequence 1. Wrong colour LED used 2. Wrong polarity 3. Wrong sequence Soldering of components Solder the component leads to PC Board using soldering iron 1. Cold Solder Joint 2. Not enough solder Trim Leads Cut the component leads to shorter length 1. Lead length too long 2. Burrs on lead Burn in Stabilize the LED and eliminateinfant 1. ElectricalOver stress Example : Product Function Potential Failure Mode Potential Effect(s) of failure S e v C l a s s Potential Cause(s) of Failure O c c ur Current Control (Prevention) Current Control (Detection) D et ec R P N Recommend ed Action Responsibility and Completion Date Action Taken Severity Occurrence Detection RPN PROCESS FAILURE MODE AND EFFECTS ANALYSIS (PFMEA) Add positive depth stop to sprayer Use Design of Experiements (DOE) None Install spray timer A Tate-Body Engrg 9X 15 15 Mfg Eng 9X 10 01 Maintenance 9X 09 15 Stop added, sprayer checked on- line Temp and pressure were determined - result Cpk = 1.85 Automatic spray timer installed, Cpk = 2.05 7 2 5 70 7 1 5 35 7 1 7 49 280 175 70 392 2 5 8 8 Manually inserted - spray head not inserted far enough Spray heads clogged Spray head deformed due to impact Spray time insufficient Front Door L.H H8HX-0000-A • Ingress to and egress from vehicle • Occupant protection from weather, noise and side impact • Support anchorage for door hardware including mirror,hing es, lacth and window regulator Corroded interior lower door panels Deteriorated life of door leading to: • unsatisfactor y appearance due to rust through paint over time • Impaire function of interior door hardware 7++ Test spray pattern at start-up and after ideal period Preventive maintenance program Visual check each hour for film thickness and coverage Visual check each hour for film thickness Visual check each hour for film thickness Lot sampling(10 doors/shift) to check coverage for critical areas 5 5 5 7
  • 60. 11/28/2018 60 Work Instructions • Prepare documented work instruction for employees having responsibilities for operation that impact quality • Instruction shall be accessible for use at the work station • Derived from sources such as: – control plan, – PFMEA – Engineering drawing – DFMEA Part Number: KB 01/19 Op. Number: - 140 Issue - 1 Part Description: - PULLEY: - (POWER STEERING ) Op. Description: Trim & Chamfer Date : 17/6/2002 Process Eng: - CM TAN PPC: - WY SIT QA: - HUSAINI (2) Kasut Keselamatan Persiapan Keselamatan Diri Penutup Telinga Sarung Tangan MINYAKDAN GRIS BOLEH MEROSAKAN KULIT Gambarajah Aliran Proses Arahan Proses / Work Instructions (1) (4) (3) (5) (6) Rev. : 0 Doc. No. : WI-KB01/19-140/A (1) Ambil ‘Part’dari bin (2) Letakkan ‘part’ pada ‘mandrel’ denganbetul. (3) Pasangkanpemegang ‘part’ melalui lubangskru, dan pastikania dimasukkandengan betul. (4) Pulaskantuaske fungsi ‘Auto’ mengetatkan ‘part’pada mandrel. Panel Operasi Mesin Butang ‘cycle start’ atauoperasi (A) Butang kecemasan ‘return’ (B) Butang Kecemasan berhenti (C) Keadaan Tempat Kerja (1) Pastikansemuasisalebihankerjaseperti sarung tangan,kainburukdansisabesi dibersihkandari mesin sebelummesin digunakan. (2) Jikaterdapat‘part’pada mesin, asingkanyakedalam‘polybox’ataubakul ‘reject’merah. (3) Pastikanterdapatsekurang-kurangnya1 bin WIP & binkosongdisediakanuntuksyif berikutnyasebelumpulang. (4) Pastikan’machine&operatormonitoring sheet’ di isi denganbetul setiapjamapabilamesin beroperasi.,sertaisikan‘Route card’untuk setiapbinyang telahdisiapkan Kawalan Kualiti (1) Perhatikan‘part’ denganmata kasar untukmasalahseperti berikut: a) ‘Burr’ yangberlebihanpada bahagian‘part’yangdipotong. b) Pemotonganbersudutyangtidak seragam. c) Bahan terkupasdari permukaan ‘part’. ( 2) Jikamasalahseperti diatas dikenal pasti olehoperatordania berlaku 5 kali berturut-turut,berhentikan mesindanrujukkepadasupervisor untuk langkahseterusnya. (3) ‘Part’yang dikenalpastisebagai ‘reject’harusdibuangke dalam ‘polybox’ ataubakul ‘reject’ merah. Keselamatan & Kecemasan 1) Pastikanpintumesinditutupapabilamesinberoperasi supayasisadari ‘part’ tidakterkenaanggotabadanoperator. 2) Pastikanpemegang‘Part’dipegangdenganbetul seperti gambar3untuk mengelak dari terkepitnyajari. 3) Jikakeadaankecemasanberlakupadamesinketikaiadioperasikan,tekan butang(B) danjikaia tidakberhasil gunakanbutang (C) seperti yang ditunjukkanpada‘PanelOperasi Mesin’. (5) Tutup pintukeselamatan mesin Machine Type: Suga (T1) Ulangi langkah 1 untuk langkah seterusnya. (6) Tekan butanghitam‘cycle start’ untuk memulakan operasi. (8) (7) (10) (8) Keluarkan pemegang ‘part’ (7) Setelah ‘part’siap dipotong pulaskantuas ke fungsi ‘manual’untukmelonggarkan pemegang ‘part’dari ‘mandrel’ (9) (9) Keluarkan ‘part’yang telah siapdan masukkankedalam bin. Mandrel Part Pemegang ‘part’
  • 61. 11/28/2018 61 Floor Plan Layout • The organization of a company’s physical facilities to promote the efficient use of equipment, material and people • To determine material and process flow, storage, inspection and test points, rework or repair stations, non-conforming material • Shall optimize material travel, handling and value added use of floor space • Shall facilitate synchronous material flow Process Flow analysis Team member: Qty Time Qty Time Qty Time Monthly production : Date: Process Name: Approved by: Improvement : Before/ After 1 2 3 4 Avg 1 2 3 13 14 15 16 17 18 19 20 21 22 23 24 25 26 27 28 Total Symbol Operation No Current Time Distance After Different Problem Action PROCESS ANALYSIS Operation Move Inspection Delay Storage
  • 62. 11/28/2018 62 Process Flow analysis PROCESS ANALYSIS Machining and job operation 1. Can it be out 2. Can it be combined with another operation 3. Can the operational order be changed 4. How about changing materials, machine or operator 5. Can it be improved by some other means Inspection 1. Can any of the inspection procedure be cut out ? 2. Can some sort of mistake proofing device or other apparatus be used to simplify the testing procedure ? 3. Can tests carried out during the course of machining or transportation? 4. Are the inspection criteria appropriate ? Are they stricter than necessary? 5. Can it be improved by any other means? Delay/ wait 1. Can the delay (wait) be eliminate ? 2. Can slow movement of some sort be achieved? 3. Can the number of delays (waits) be reduced? 4. Can anything else be done while the delay is in progress? 5. Can it be improved by any other means? Transportation/ Movement 1. Can the transportation (movement) be cut out? 2. Can the number of transportation operations be reduced? 3. Can some other operation or test be carried out while transportation is in progress? 4. Can the distance or time taken on transportation be reduced? 5. Can it be improved by any other means? Storage 1. Can the storage requirement be eliminated? 2. Can the storage time or lot numbers be reduced ? 3. Can the materials or parts be made more uniform? 4. Can anything else be done during storage? 5. Can improvement be achieved by other means? 7 Waste • Defective Product • Overproduction • Inventories • Transportation • Motion • Waiting • Processing WASTE
  • 63. 11/28/2018 63 lean thinking To design process, gages, tooling, and fixtures in order to prevent errors during manufacturing. Control - eliminates the possibility of a mistake to occur Warning - signals that a mistake can occur (blinking light, alarm, etc.) Mistake Proofing in Process
  • 64. 11/28/2018 64 BEFORE LH (Left Hand) FSS is sometimes assembled to RH (RightHand) Damper. RH Damper cannot be loaded on Fixture, so wrong part assemblyis impossible. AFTER EXAMPLE MISTAKE PROOFING : FOULING PIN After Improvement : Detecting pins were installed on the jig used for checking the circuit boards after wiring. Circuit boards without the proper holes cannot be mounted on the jig. All circuit boards that lack mounting holes are now detected before they sent on to assembly. Before Improvement : Sometimes circuit boards could not be mounted into their assemblies because screw holes had not been drilled in them. The workers in earlier processes relied on visual checks to determine whether screw holes had been drilled. Description of Processes : Circuit boards are inspected, then later mounted into assemblies EXAMPLE MISTAKE PROOFING : ASSEMBLY JIG
  • 65. 11/28/2018 65 Packaging Standard • To identify any packaging standard required by customer • Must assure packaging design meet customer requirements • Packaging design must assure product performance and characteristics remain unchanged during packing and delivery • Compatibility with all material handling equipment including robots Packaging Standard Part Name Length Part No. Width Model Height Customer Weight/pcs Sensitive to: Packaging Method Packaging Type Quantity / Packing No of Layer Packaging Weight Layering material Packaging Size Packaging Identification Sketch Date Name Sign Date Name Sign Date Name Sign Customer Review Supplier Proposal Approved By Approved By Prepared By Part Information Packaging Information Part Packaging Data Sheet Part Dimension (mm) ARI-FRM-QA-007
  • 66. 11/28/2018 66 Measurement System Analysis Plan • Plan to accomplish the required MSA • Include as a minimum, the responsibility to ensure gage linearity, accuracy, repeatability and reproducibility Preliminary Process Capability Plan • Must include characteristics identified in control plan • Include as a minimum: – responsibility – Cpk/ Ppk value – time
  • 67. 11/28/2018 67 Phase 4 Product and Process Validation APQP Five Phase Process Plan And Define Program Product Design and Development Process Design and Development Product and Process Validation Production Feedback Assessment and Corrective Action Pilot Launch Concept Initiation/Approval Program Approval Prototype Planning
  • 68. 11/28/2018 68 Phase 4: Product and Process Validation Outputs • Measurement System Evaluation • Preliminary Process Capability Study • Production Validation Testing • Packaging Evaluation • Competency Evaluation • Prototype making • Cost Evaluation • Production Trial Measurement System Analysis • To make sure that the measurement system - gages, personnel, methods and procedure is stable and capable of measuring your data. • Apply to measurement system referenced in the control plan • Acceptance criteria shall conformto those in customer reference manuals
  • 69. 11/28/2018 69 What Is a Measurement System Analysis Input Measurement System Measurements Outputs Instruments Methods Materials (Reference) Manpower Environment Measurement System Analysis (MSA) Continuous Improvement Numbers (data) • To assess the quality of a measurement system. • To ensure that the variation in the measurement system is acceptable. • To minimize the effects of measurement system error • product decision • process decision • New process Acceptance PURPOSE OF MSA
  • 70. 11/28/2018 70 Variation in MSA Measurement SystemAnalysis Location Variation (Accuracy) Width Variation(Precision) Bias Linearity Stability Repeatability Reproducibility MSA Studies Report
  • 71. 11/28/2018 71 Preliminary Process Capability Study • Study the new process capability to ensure customer requirements are met. • Provide additional input for process control. • Process Capability performance can be specified by customer. • Focus on special characteristics Traditional view - Inspection oriented Loss N USL LSL Tolerance limits
  • 72. 11/28/2018 72 Quality view - SPC oriented • The Idea of Taguchi: Even Small Deviations are Quality Losses • It is not enough to look at “Good” vs “Bad” Outcomes X1 X2 Loss Scrap or reworkcost Taguchi loss Loss Capability / variance • Variation of output of a process can give rise to defects internally and/or passed onto customer • Aim to reduce process variation to increase reliability of a process Nominal Upper specification limit Lower specification limit ±3 ±6 Defects 1350 parts per million Defects 0.001 ppm
  • 73. 11/28/2018 73 • Actual • Meet Specification • Improvement USL T LSL USL T LSL T USL LSL USL’ LSL’ The Strategy The goal should not be 100% conformanceto specification(zero defect), but the never-ending reduction of processes variation so that product/services are as close to nominal UCL LCL LCL LCL UCL UCL Process not centered and not stable Process centered and stable Additional improvements made to the process Improvements
  • 74. 11/28/2018 74 1 2 3 4 5 6 7 8 9 10 11 12 13 14 15 16 17 n 1 2 3 4 5 6 7 8 9 10 11 12 13 14 15 16 17 1 44.46 44.43 44.45 44.44 44.46 44.44 44.44 44.46 44.44 44.43 44.44 44.44 44.45 44.47 44.46 44.44 44.44 2 44.46 44.46 44.46 44.44 44.47 44.45 44.43 44.43 44.45 44.44 44.44 44.45 44.46 44.42 44.47 44.42 44.43 3 44.44 44.45 44.45 44.43 44.45 44.43 44.44 44.42 44.46 44.43 44.44 44.45 44.48 44.43 44.45 44.43 44.44 4 44.45 44.46 44.44 44.44 44.48 44.45 44.43 44.45 44.43 44.45 44.45 44.46 44.48 44.46 44.48 44.45 44.46 5 44.43 44.45 44.45 44.45 44.45 44.44 44.43 44.46 44.45 44.45 44.43 44.45 44.45 44.45 44.43 44.44 44.43 Average 44.448 44.45 44.45 44.44 44.462 44.442 44.434 44.444 44.446 44.44 44.44 44.45 44.464 44.446 44.458 44.436 44.44 Ra nge 0.03 0.03 0.02 0.02 0.03 0.02 0.01 0.04 0.03 0.02 0.02 0.02 0.03 0.05 0.05 0.03 0.03 Value 21 22 23 24 25 125 44.48 n 21 22 23 24 25 44.42 1 44.44 44.44 44.45 44.44 44.44 45.7 2 44.44 44.44 44.46 44.47 44.47 44.3 3 44.44 44.45 44.44 44.45 44.45 105.762 4 44.45 44.46 44.44 44.45 44.44 12.427 5 44.46 44.45 44.45 44.45 44.45 17.879 3.75968 19.698 12.427 4.142 0 25 ITEM Number of readings Max imum Minim um Upper Spec Lim it (USL) Lower Spec Lim it (LSL) ZUSL ZLSL Perform ance index (Pp) Capability Index (Cpk) SW-34253 Characteristic Company XYZ Sdn Bhd Part Name AVERAGE X BAR AND R CONTROL CHART Specification Lower Spe c 44.3 Description Bra cket Sample Size 5 Part Number Performance Index (Ppk) Capability Index (Cp) Zm in Upper Spe c 45.7 AV ERAGES ( X BAR CHART) 44.425 44.43 44.435 44.44 44.445 44.45 44.455 44.46 44.465 44.47 1 2 3 4 5 6 7 8 9 10 11 12 13 14 15 16 17 18 19 20 21 22 X BAR A VG OF X BAR UCL-XBAR LCL-XBAR HIST OGR A M 44. 3 44.45 19 34 38 20 20 30 40 50 60 70 80 HISTOGRAM WITHOUT LIM IT 19 34 38 20 7 10 15 20 25 30 35 40 RANGE (R CHART) 0 0.01 0.02 0.03 0.04 0.05 0.06 0.07 1 2 3 4 5 6 7 8 9 10 11 12 13 14 15 16 17 18 19 20 21 22 R A N G E R R BAR UCL-R LCL-R Production Validation Testing • Shall be performed in accordance with planned arrangement • To ensure resulting product is capable to meet specified requirements • Validation required such as – material specification – functional – Dimensional – Realibility/ Durability
  • 75. 11/28/2018 75 Product Validation (Example) Prepared by: No: Characteristic or parameter to be validated Specification Result Remarks No: Approved by: Effective date: TITLE: Packaging Evaluation • Assess the protection of the product from normal transportation damage and adverse environmental factors • Customer-specified packaging does not preclude in evaluating the packaging method
  • 76. 11/28/2018 76 Packaging Evaluation: Example Parts Packaging/Shipping Specifications STATUS (G/Y/R) 1 1 Has adequate protective packaging for finished product been defined? 1 2 Have records of test shipping containers and trips been documented? (Ex: What was used on PV build?) 1 3 Does the label meet AIAG and ASG requirements? 1 4 Have you completed and submitted ASG Packaging Data Forms (PDF) for all components? 1 5 Is your system ready to send Advance Ship Notices (ASN) for these parts? 1 6 Have you received a copy of the ASG routing instructions? 1 7 Has the shipping system been established to include: 1) Ship to Location & Dock Code 2) Shipment Frequency & Window 3) Primary Carrier 4) Expedite Carrier (Use NLM's One-Call only!) 5) Container Return/Maintenance 6) Saturday <Weekend?> Shipments 7 Quality Planning Sign-Off • To review relevant documents to ensure – Process instructions in place and followed – Flow charts in place and followed – Process Instruction is consistent with PFMEA and control plan – GR&R meets the acceptable limit
  • 77. 11/28/2018 77 Quality Planning Sign-Off DATE : PRODUCT NAME PART NUMBER CUSTOMER MANUFACTURING PLANT 1. PRELIMINARY PROCES S CAPABILITY STUDY Ppk- SPECIAL CHARACTERISTICS 2. CONTROL PLAN APPROVAL (If required) APPROVED : YES/NO * DATE APPROVED : 3. INITIAL PRODUCTION S AMPLES CHARACTERIS TIC CATEGORY S AMPLES PENDING DIMENSIONAL VISUAL LABORATORY PERFORMANCE 4. GAGE AND TEST EQUIPMENT MEASUREMENT SYSTEM ANALYSIS SPECIAL CHARACTERISTIC 5. PROCESS MONITORING PROCESS MONITORING INSTRUCTIONS PROCESS SHEETS VISUAL AIDS 6. PACKAGING / SHIPPING PACKAGING APPROVAL SHIPPING TRIALS 7. SIGN-OFF QUANTITY REQUIRED ACCEPTABLE PENDING * QUANTITY REQUIRED ACCEPTABLE PENDING * QUANTITY REQUIRED ACCEPTABLE PENDING * QUANTITY CHARACTERIS TICS PER SAMPLE ACCEPTABLE PRODUCT QUALITY PLANNING SUMMARY AND SIGN-OFF QUANTITY REQUIRED ACCEPTABLE PENDING * Reduce the Cost of Components • Understand the Process Constraints and Cost Drivers • Redesign Components to Eliminate Processing Steps • Choose the Appropriate Economic Scale for the Part Process • Standardize Components and Processes • Adhere to “Black Box” Component Procurement
  • 78. 11/28/2018 78 Reduce the Costs of Assembly • Design for Assembly (DFA) index • Integrated Parts (Advantages and Disadvantages) • Maximize Ease of Assembly • Consider Customer Assembly Redesign Components to Eliminate Processing Steps • Reduce the number of steps of the production process – Will usually result in reduce costs • Eliminate unnecessary steps. • Use substitution steps, where applicable. • Analysis Tool – Process Flow Chart and Value Stream Mapping
  • 79. 11/28/2018 79 Production Trial Run • Shall be conducted using production tooling, equipment, environment, facility and cycle time • Minimum quantity for a production trial run is usually set by the customer Product Approval Process • The organization shall conform to a product and manufacturing process approval procedure recognized by the customer. • This product and manufacturing process approval procedure shall also be applied to suppliers
  • 80. 11/28/2018 80 Phase 5 Feedback Assessment and Corrective Action Phase 5: Outputs • Reduce variation • Corrective and Preventive Action • Customer satisfaction
  • 81. 11/28/2018 81 Common techniques for process improvement Input/output analysis Flow charts Scatter diagrams Cause-effect diagrams Pareto diagrams Why-why analysis Input Output x x x x x x x x x x x Why? Why? Why? Corrective Action Log Quest. # Issue Person Responsible Target due date Completion date Corrective Action Plan
  • 82. 11/28/2018 82 Drawing and Specification Change • May be initiated during design review, design verification or validation • May be initiated upon Corrective action or continual improvement activities, • Change shall be reviewed, verify and revalidate where necessary • To indicate the version number for any changed document • To communicate changes to related personnel - distribution of latest version Design Change Flow Engineering Change Review EngineeringChange Verification Perform Design Change Is revalidation required Perform Design Validation Engineering ChangeNotice Engineering ChangeRequest No Yes Result Ok
  • 83. 11/28/2018 83 Design Change Linkages Work Instructions PFMEA Change in detection Change in occurence Change in severity Control Plan Design Change Other Action Control of document and records • Shall determine appropriate level of control over development activities. Control may include: – Receiving of specification – Distribution of specification – Changes of specification – Disposition of specification – Drawing Format – Electronic format – Record retention