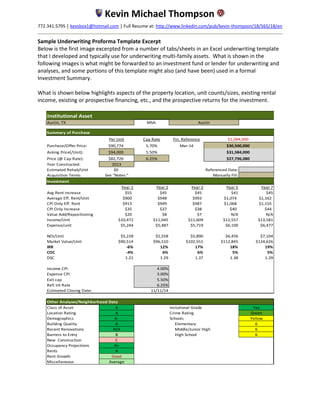
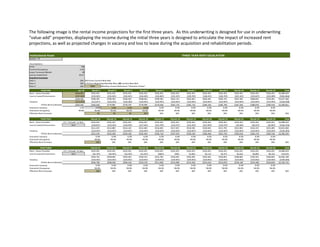
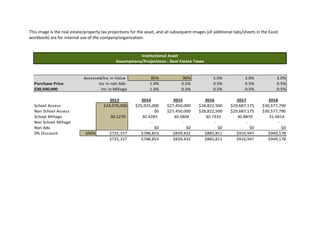
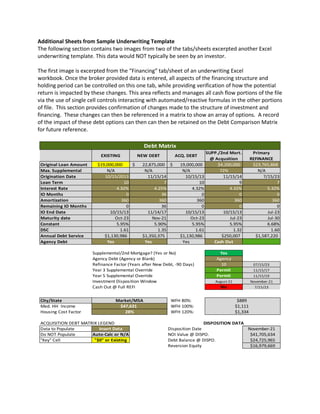
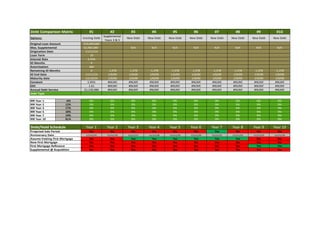
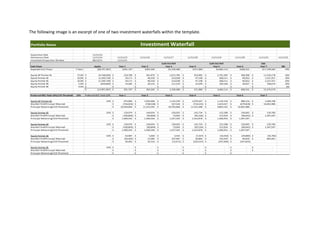
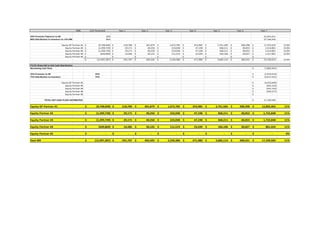
Kevin Michael Thompson
772.341.5795 │ kevsbox1@hotmail.com │ Full Resume at: http://www.linkedin.com/pub/kevin-thompson/18/565/18/en
Sample Underwriting Proforma Template Excerpt
Below is the first image excerpted from a number of tabs/sheets in an Excel underwriting template
that I developed and typically use for underwriting multi-family assets. What is shown in the
following images is what might be forwarded to an investment fund or lender for underwriting and
analyses, and some portions of this template might also (and have been) used in a formal
Investment Summary.
What is shown below highlights aspects of the property location, unit counts/sizes, existing rental
income, existing or prospective financing, etc., and the prospective returns for the investment.
Institutional Asset
MSA:
Summary of Purchase
Per Unit Cap Rate Fin. Reference
Purchase/Offer Price: $90,774 5.70% Mar-14
Asking Price(/Unit): $94,000 5.50%
Price (@ Cap Rate): $82,726 6.25%
Year Constructed: 2013
Estimated Rehab/Unit $0 Referenced Data:
Acquisition Terms: See "Notes:" Manually Fill:
Investment
Year 1 Year 2 Year 3 Year 5 Year 7
Avg Rent Increase $55 $45 $45 $41 $45
Average Eff. Rent/Unit $900 $948 $993 $1,074 $1,162
CPI Only Eff. Rent $913 $949 $987 $1,068 $1,155
CPI Only Increase $35 $37 $38 $40 $44
Value Add/Repositioning $20 $8 $7 N/A N/A
Income/Unit $10,472 $11,045 $11,609 $12,557 $13,581
Expense/unit $5,244 $5,487 $5,719 $6,100 $6,477
NOI/Unit $5,228 $5,558 $5,890 $6,456 $7,104
Market Value/Unit $90,514 $96,510 $102,551 $112,845 $124,626
IRR -6% 12% 17% 18% 19%
COC -4% 6% 6% 5% 5%
DSC 1.21 1.29 1.37 1.38 1.29
Income CPI 4.00%
Expense CPI 3.00%
Exit cap 5.50%
Refi Int Rate 6.25%
Estimated Closing Date: 11/11/14
Class of Asset A Instutional Grade Yes
Location Rating A Green
Demographics A- Yellow
Building Quality A 6
Recent Renovations N/A 6
Barriers to Entry B 6
New Construction C
Occupancy Projections A+
Rents A
Rent Growth Good
Miscellaneous Average
Austin, TX Austin
Crime Rating
Schools
Elementary
Middle/Junior High
High School
Other Analyses/Neighborhood Data
$1,084,000
$30,500,000
$31,584,000
$27,796,080
Both the preceding and subsequent image are from the same tab, which provides a good general overview of the asset. What is shown is
the asset unit counts/sizes, existing rental income, qualitative data about the asset and seller, and an area to include rudimentary
information on assets acquired within the competitive market.
Notes:
Acq Comps: Institutional Asset
Yr Built 2013
Price/Unit $90,774
All In/Unit $95,260
Avg Unit SF 739
In Cap 5.70%
Exit Cap 5.50%
Inc/Unit $10,317
In-Place Rents/Unit Mix
Unit Size # Units Mkt Rent PSF LTL Eff Rent PSF Annual Rent
1 bedroom 1 bathroom 525 24 $851 $1.62 ($112) $739 $1.41 $245,088 7%
1 bedroom 1 bathroom 525 48 $848 $1.62 ($112) $736 $1.40 $488,448 14%
1 bedroom 1 bathroom 625 28 $902 $1.44 ($112) $790 $1.26 $303,072 8%
1 bedroom 1 bathroom 625 28 $899 $1.44 ($112) $787 $1.26 $302,064 8%
1 bedroom 1 bathroom 625 28 $898 $1.44 ($112) $786 $1.26 $301,728 8%
1 bedroom 1 bathroom 775 32 $998 $1.29 ($112) $886 $1.14 $383,232 10%
1 bedroom 1 bathroom 775 32 $981 $1.27 ($112) $869 $1.12 $376,704 10%
1 bedroom 1 bathroom 775 32 $969 $1.25 ($112) $857 $1.11 $372,096 10% 75.0%
2 bedroom 2 bathroom 995 28 $1,237 $1.24 ($112) $1,125 $1.13 $415,632 8%
2 bedroom 2 bathroom 995 28 $1,203 $1.21 ($112) $1,091 $1.10 $404,208 8%
2 bedroom 2 bathroom 995 28 $1,182 $1.19 ($112) $1,070 $1.08 $397,152 8% 25.0%
336 $989 $1.34 ($450,154) $878 $1.19 $3,989,424
739 ($37,513) $332,452
($112)
Eff Rent: $878
Vacancy Jan-14 4.2% 5% $44 6% $53 7% $61 8% $70
unit types Unit Mix
248,280
Acquisition Comp #1 Acquisition Comp #2 Acquisition Comp #3 Acquisition Comp #4 Acquisition Comp #5
The unit mix lends itself to young techno-geek tenants (smaller, and A+), resulting in a good tenant profile. Nice A-Class asset, but with small units. This is both a pro and con due to the
demographics and market appeal. Selling Motive: two partners are divesting. Developer's mistakes: Vacant land nearby prepared for development, units are currently being built in the
neighborhood (nearby competitor is 40% leased, but at $1.23/SF. Velocity is +40 units month), and getting the loan product they did at that point in time. The seller is now building 80,000+ SF of
office space. Lender has been approached about supplemental (to bring debt up to 75% AT THE SAME I.R., but NOT confirmed yet). Crime: Green. Schools Avg: "6." Austin is a stronger/more growth-
oriented market than San Antonio or Dallas. Higher increases in rents during the last two years than S.A., but new product is coming on line as the price per unit is making new construction feasible.
High net worth family from Winnipeg is behind the equity, but Ledcor fund is out of Vancover. Westwood Residential was the builder. Park and ride is nearby.
The following two images are from the “Income Analysis” tab where the most significant analysis is displayed.
KEY RATIOS
A
p 0 Mar-14 Year 1 Year 2 Year 3 Year 4 Year 5 Year 6 Year 7
Rent Increase $55 $45 $45 $40 $41 $43 $45
Economic Occupancy: #DIV/0! 96% 94% 94% 94% 94% 94% 94% 94%
Economic Vacancy: #DIV/0! 4% 6% 6% 6% 6% 6% 6% 6%
Average Rent/Unit $0 $858 $900 $948 $993 $1,033 $1,074 $1,117 $1,162
Loss to Lease: #DIV/0! 12.24% 9.08% 4.18% -0.37% -0.37% -0.37% -0.37% -0.37%
Bad Debt #DIV/0! 0.57% 1.0% 1.0% 1.0% 1.0% 1.0% 1.0% 1.0%
Income/Unit $0.00 $10,317 $10,472 $11,045 $11,609 $12,074 $12,557 $13,059 $13,581
Expenses/Unit $0 $4,896 $5,244 $5,487 $5,719 $5,907 $6,100 $6,286 $6,477
NOI/Unit $0 $5,420 $5,228 $5,558 $5,890 $6,167 $6,456 $6,773 $7,104
Cap Rate of ALL In Costs 5.69% 5.49% 5.83% 6.18% 6.47% 6.78% 7.11% 7.46%
DSCR 0 1.26 1.21 1.29 1.37 1.31 1.38 1.22 1.29
PROFORMA
INCOME Appraisal Mar-14 Nov-14 Nov-15 Nov-16 Nov-17 Nov-18 Nov-19 Nov-20
Rent - Gross Possible $3,941,186 $11,873 /unit $3,989,424 $3,989,424 $3,989,424 $4,149,001 $4,314,961 $4,487,559 $4,667,062
Loss to Lease/Concessions ($482,487) $1,078 /unit ($362,064) ($166,764) $14,676 $15,263 $15,874 $16,509 $17,169
$0 $3,458,699 $3,627,360 $3,822,660 $4,004,100 $4,164,264 $4,330,835 $4,504,068 $4,684,231
Vacancy ($152,366) ($679) /unit ($228,309) ($239,365) ($239,365) ($248,940) ($258,898) ($269,254) ($280,024)
Bad Debt ($21,572) 1% /unit ($37,611) ($37,501) ($37,501) ($39,001) ($40,561) ($42,183) ($43,870)
Admin Unit incl models ($17,205) 3.5 ($41,557) ($41,557) ($41,557) ($43,219) ($44,948) ($46,745) ($48,615)
Other Income $198,845 $592 /unit $198,845 $206,799 $215,071 $223,674 $232,621 $241,925 $251,602
Effective Gross Revenue $0 $3,466,401 CPIInc 4.00% $3,518,729 $3,711,036 $3,900,748 $4,056,778 $4,219,049 $4,387,811 $4,563,324
1.51% 5.47% 5.11% 4.00% 4.00% 4.00% 4.00%
EXPENSES Appraisal 0 Mar-14 Year 1 Year 2 Year 3 Year 4 Year 5 Year 6 Year 7
Administrative $61,864 $220 /unit $73,920 $76,138 $78,422 $80,774 $83,198 $85,694 $88,264
Marketing Expense $80,323 $250 /unit $84,000 $86,520 $89,116 $91,789 $94,543 $97,379 $100,300
R&M $86,807 $600 /unit $201,600 $207,648 $213,877 $220,294 $226,903 $233,710 $240,721
Utilities $97,345 $298 /unit $100,265 $103,273 $106,372 $109,563 $112,850 $116,235 $119,722
Payroll $380,047 $1,100 /unit $369,600 $380,688 $392,109 $403,872 $415,988 $428,468 $441,322
Insurance $70,290 $218 /unit $73,416 $75,618 $77,887 $80,223 $82,630 $85,109 $87,662
RE Taxes (Peor Projection) $761,000 $2,265 /unit $788,853 $839,432 $885,811 $916,947 $949,178 $977,653 $1,006,983
Management Fees $107,470 2.0% /unit $70,375 $74,221 $78,015 $81,136 $84,381 $87,756 $91,266
Total Expenses $0 $1,645,146 336 units $1,762,028 $1,843,538 $1,921,607 $1,984,598 $2,049,669 $2,112,003 $2,176,241
CPIExp 3.00% 7.10% 4.63% 4.23% 3.28% 3.28% 3.04% 3.04%
NOI Before RR $0 $1,821,255 $1,756,700 $1,867,498 $1,979,141 $2,072,180 $2,169,380 $2,275,808 $2,387,083
-4% 6% 6% 5% 5% 5% 5%
Replacement Reserve $84,000 $250 /unit $84,000 $84,000 $84,000 $84,000 $84,000 $84,000 $84,000
NOI After RR $0 $1,737,255 $1,672,700 $1,783,498 $1,895,141 $1,988,180 $2,085,380 $2,191,808 $2,303,083
ACTUAL
Normalized
Normalized
Normalized
CASH FLOW Nov-15 Nov-16 Nov-17 Nov-18 Nov-19 Nov-20 Nov-21
NOI after RR $1,672,700 $1,783,498 $1,895,141 $1,988,180 $2,085,380 $2,191,808 $2,303,083
Annual Debt Service $1,130,986 $1,130,986 $1,130,986 $1,130,986 $1,130,986 $1,130,986 $1,130,986
Supp/2nd Mortgage $250,007 $250,007 $250,007 $385,215 $385,215 $660,291 $660,291
Cash Flow after Debt Service $291,707 $402,505 $514,147 $471,980 $569,179 $400,531 $511,806
PMT(Financing!F21/12,Financing!E20*12,Financing!F15,0)
RETURN OF CAPITAL Year 1 Year 2 Year 3 Year 4 Year 5 Year 6 Year 7
Equity Balance Equity Override: $8,797,864 $9,385,943 $9,922,032 $8,683,856 $9,080,261 $6,306,174 $6,536,260
Cash Flow for Distribution Rehab Costs: $291,707 $402,505 $514,147 $471,980 $569,179 $400,531 $511,806
Capital Event Distribution $0 $0 $1,716,233 $0 $3,112,935 $0 $9,774,522
Preferred Return 10.0% $879,786 $938,594 $992,203 $868,386 $908,026 $630,617 $653,626
ROC/Shortfall ($588,079) ($536,089) $1,238,177 ($396,406) $2,774,088 ($230,086) $9,632,702
CoC 3.3% 4.3% 5.2% 5.4% 6.3% 6.4% 7.8%
Cumulative Distribution $291,707 $694,212 $2,924,592 $3,396,572 $7,078,686 $7,479,217 $24,301,805
REFINANCE SCENARIO Oct-13 Year 1 Year 2 Year 3 Year 4 Year 5 Year 6 Year 7
Value at Cap Rate $31,586,455 5.50% $30,412,731 $32,427,240 $34,457,104 $36,148,734 $37,915,999 $39,851,055 $41,874,233
Per Unit Exit Cap Override 0.00% $90,514 $96,510 $102,551 $107,586 $112,845 $118,604 $124,626
Maximum Financing 68% $20,680,657 $22,050,523 $23,430,831 $24,581,139 $25,782,879 $27,098,717 $28,474,478
Payoff 1st Mortgage ($18,325,076) ($17,978,933) ($17,617,537) ($17,240,216) ($16,846,268) ($16,434,960) ($16,005,528)
Supplemental Loan $5,813,294 $0 $8,936,611 $0 $0
Cost of Loan 2.00% ($116,266) $0 ($178,732) $0 $0
Payoff 2nd Mortgage ($3,980,795) ($5,644,944)
Available For Distribution If negative, no distrbution/supplemental: $1,716,233 $0 $3,112,935 $0 $0
SALES SCENARIO Year 1 Year 2 Year 3 Year 4 Year 5 Year 6 Year 7
Value at Cap Rate 5.50% $30,412,731 $32,427,240 $34,457,104 $36,148,734 $37,915,999 $39,851,055 $41,874,233
Per Unit $90,514 $96,510 $102,551 $107,586 $112,845 $118,604 $124,626
Cost of Sale 2.00% ($608,255) ($648,545) ($689,142) ($722,975) ($758,320) ($797,021) ($837,485)
Equity Returned ($8,797,864) ($9,385,943) ($9,922,032) ($8,683,856) ($9,080,261) ($6,306,174) ($6,536,260)
Return of Escrows and Reserves $591,230 $591,230 $591,230 $591,230 $591,230 $591,230 $591,230
Payoff 1st Mortgage ($18,325,076) ($17,978,933) ($17,617,537) ($17,240,216) ($16,846,268) ($16,434,960) ($16,005,528)
Payoff 2nd Mortgage ($4,130,059) ($4,057,036) ($3,980,795) ($5,731,323) ($5,644,944) ($8,831,892) ($8,720,438)
Remaining Dollars ($857,292) $948,013 $2,838,828 $4,361,595 $5,586,205 $7,481,008 $9,774,522
ESTIMATED IRR Total Return IRR Equity Year 1 Year 2 Year 3 Year 4 Year 5 Year 6 Year 7
N/A N/A Yes Yes
Yes
1 yr Leveraged $8,232,279 -6% $8,232,279
2 yr Leveraged $11,028,168 12% $291,707 $10,736,461
3 yr Leveraged $13,969,219 17% $291,707 $402,505 $13,275,008
4 yr Leveraged $16,442,022 18% $291,707 $402,505 $2,230,380 $13,517,430
5 yr Leveraged $18,632,217 18% $291,707 $402,505 $2,230,380 $471,980 $15,235,646
7 yr Leveraged $24,301,804 19% $291,707 $402,505 $2,230,380 $471,980 $3,682,114 $400,531 $16,822,588
3 yr Unleveraged $39,710,532 8% $1,672,700 $1,783,498 $36,254,333
5 yr Unleveraged $47,173,808 9% $1,672,700 $1,783,498 $1,895,141 $1,988,180 $39,834,289
7 yr Unleveraged $55,547,768 9% $1,672,700 $1,783,498 $1,895,141 $1,988,180 $2,085,380 $2,191,808 $43,931,061
$0
($31,997,864)
($8,797,864)
($31,997,864)
Asset Pricing/Debt Equivalent
$30,500,000 $0
$0
($31,997,864)
Selective Cash-Out Refinance:
($8,797,864)
($8,797,864)
$1,130,986
$250,007
($8,797,864)
($8,797,864)
Disposition
($8,797,864)
The following image is the rental income projections for the first three years. As this underwriting is designed for use in underwriting
“value-add” properties, displaying the income during the initial three years is designed to articulate the impact of increased rent
projections, as well as projected changes in vacancy and loss to lease during the acquisition and rehabilitation periods.
Institutional Asset
Austin, TX
Assumptions:
Units 336
Current Occupancy 4.2%
Lease Turnover/Month 28
Loss to Lease/Unit $112
Avg Rent Increases
Year 1 $55 B15 From Current Rent Roll
Year 2 $45 C15 from Beginning Monthly Rent OR Current Rent Roll
Year 3 $45 100% Monthly Income Reference "Selection Factor"
YEAR ONE Jan-14 Month 1 Month 2 Month 3 Month 4 Month 5 Month 6 Month 7 Month 8 Month 9 Month 10 Month 11 Month 12 Total
Rent - Gross Possible $334,007 $332,452 $332,452 $332,452 $332,452 $332,452 $332,452 $332,452 $332,452 $332,452 $332,452 $332,452 $332,452 $3,989,424
Loss to Lease/Concessions ($37,502) ($35,947) ($35,947) ($35,947) ($34,407) ($32,867) ($31,327) ($29,787) ($28,247) ($26,707) ($25,167) ($23,627) ($22,087) ($362,064)
$296,505 $296,505 $296,505 $296,505 $298,045 $299,585 $301,125 $302,665 $304,205 $305,745 $307,285 $308,825 $310,365 $3,627,360
Vacancy ($13,942) ($13,877) ($16,623) ($18,285) ($19,947) ($19,947) ($19,947) ($19,947) ($19,947) ($19,947) ($19,947) ($19,947) ($19,947) ($228,309)
TOTAL Rent Collected $282,563 $282,628 $279,882 $278,220 $278,098 $279,638 $281,178 $282,718 $284,258 $285,798 $287,338 $288,878 $290,418 $3,399,051
Economic Vacancy 4.2% 4.2% 5.0% 5.5% 6.0% 6.0% 6.0% 6.0% 6.0% 6.0% 6.0% 6.0% 6.0%
Economic Occupancy 95.8% 95.8% 95.0% 94.5% 94.0% 94.0% 94.0% 94.0% 94.0% 94.0% 94.0% 94.0% 94.0%
Effective Rent Increase $0 $0 $0 $55 $55 $55 $55 $55 $55 $55 $55 $55 $55
YEAR TWO Month 13 Month 14 Month 15 Month 16 Month 17 Month 18 Month 19 Month 20 Month 21 Month 22 Month 23 Month 24 Total
Rent - Gross Possible LTL: "Include" or Not: $332,452 $332,452 $332,452 $332,452 $332,452 $332,452 $332,452 $332,452 $332,452 $332,452 $332,452 $332,452 $3,989,424
Loss to Lease/Concessions N/A ($20,827) ($19,567) ($18,307) ($17,047) ($15,787) ($14,527) ($13,267) ($12,007) ($10,747) ($9,487) ($8,227) ($6,967) ($166,764)
$311,625 $312,885 $314,145 $315,405 $316,665 $317,925 $319,185 $320,445 $321,705 $322,965 $324,225 $325,485 $3,822,660
Vacancy ($19,947) ($19,947) ($19,947) ($19,947) ($19,947) ($19,947) ($19,947) ($19,947) ($19,947) ($19,947) ($19,947) ($19,947) ($239,365)
TOTAL Rent Collected $291,678 $292,938 $294,198 $295,458 $296,718 $297,978 $299,238 $300,498 $301,758 $303,018 $304,278 $305,538 $3,583,295
Economic Vacancy 6.0% 6.0% 6.0% 6.0% 6.0% 6.0% 6.0% 6.0% 6.0% 6.0% 6.0% 6.0%
Economic Occupancy 94.0% 94.0% 94.0% 94.0% 94.0% 94.0% 94.0% 94.0% 94.0% 94.0% 94.0% 94.0%
Effective Rent Increase $45 $45 $45 $45 $45 $45 $45 $45 $45 $45 $45 $45 $45
YEAR THREE Month 25 Month 26 Month 27 Month 28 Month 29 Month 30 Month 31 Month 32 Month 33 Month 34 Month 35 Month 36 Total
Rent - Gross Possible LTL: "Include" or Not: $332,452 $332,452 $332,452 $332,452 $332,452 $332,452 $332,452 $332,452 $332,452 $332,452 $332,452 $332,452 $3,989,424
Loss to Lease/Concessions N/A ($5,707) ($4,447) ($3,187) ($1,927) ($667) $593 $1,853 $3,113 $4,373 $5,633 $6,893 $8,153 $14,676
$326,745 $328,005 $329,265 $330,525 $331,785 $333,045 $334,305 $335,565 $336,825 $338,085 $339,345 $340,605 $4,004,100
Vacancy ($19,947) ($19,947) ($19,947) ($19,947) ($19,947) ($19,947) ($19,947) ($19,947) ($19,947) ($19,947) ($19,947) ($19,947) ($239,365)
TOTAL Rent Collected $306,798 $308,058 $309,318 $310,578 $311,838 $313,098 $314,358 $315,618 $316,878 $318,138 $319,398 $320,658 $3,764,735
Economic Vacancy 6.0% 6.0% 6.0% 6.0% 6.0% 6.0% 6.0% 6.0% 6.0% 6.0% 6.0% 6.0%
Economic Occupancy 94.0% 94.0% 94.0% 94.0% 94.0% 94.0% 94.0% 94.0% 94.0% 94.0% 94.0% 94.0%
Effective Rent Increase $45 $45 $45 $45 $45 $45 $45 $45 $45 $45 $45 $45 $45
THREE YEAR RENT ESCALATION
This image is the real estate/property tax projections for the asset, and all subsequent images (of additional tabs/sheets in the Excel
workbook) are for internal use of the company/organization.
Assessed/Inc in Value 85% 90% 5.0% 3.0% 3.0%
Purchase Price Inc in non Adv 1.0% 0.5% 0.5% 0.5% 0.5%
$30,500,000 Inc in Millage 1.0% 0.5% 0.5% 0.5% 0.5%
2013 2014 2015 2016 2017 2018
School Assess $24,070,000 $25,925,000 $27,450,000 $28,822,500 $29,687,175 $30,577,790
Non School Assess $0 $27,450,000 $28,822,500 $29,687,175 $30,577,790
School Millage 30.1270 30.4283 30.5804 30.7333 30.8870 31.0414
Non School Millage - - - - -
Non Adv $0 $0 $0 $0 $0
0% Discount 100% $725,157 $788,853 $839,432 $885,811 $916,947 $949,178
$725,157 $788,853 $839,432 $885,811 $916,947 $949,178
Institutional Asset
Assumptions/Projections - Real Estate Taxes
The rehabilitation of a “Value-Add” asset includes all construction costs and associated fees for
repairs and upgrades in an integrated “Rehab” tab/worksheet associated with each asset. With a
value add asset, this displayed in the following three images.
Units 336
Bedrooms 420
Bathrooms 420
IMMEDIATE REPAIRS Budget
months 10,000$
months
months
months
Total Immediate Repairs 10,000$
AMENITY UPGRADES Budget
Site Signage 30,000$
Landscape and Tree Trim 75,000$
Irrigation 20,000$
Security Cameras 10,000$
Handi Trac 15,000$
Trash Compactor 52,000$
Club House/ Leasing center 65,000$
Pergula's # of 4,000$
Coffee Shop 2,500$
Fitness Center 7,500$
Fitness equipment 15,000$
Pools / # of
Sports court / type 8,000$
Laundry Facilities # of
Golf Cart
Kids center 5,000$
Dog park 7,500$
BBQ Area 4,000$
Wi-Fi 5,000$
Office Equipment/ Computers 5,000$
Office Furniture 10,000$
Club House Furniture 25,000$
Model Furniture # of 10,000$
Pool Furniture # 0f 12,500$
Total Amenities Costs 388,000$
Time to Complete Repairs
Rehab. Budget Section One
EXTERIOR # of Units Cost per Unit Budget
Roofs Repairs / Replace
Siding
Soffit and Facia
Gutters, Down Spouts, Pads
Exterior Painting $ 350 -$
Patio Decks
Hallways / Entrences (Railings
Painted/Stairways)
Exterior Lighting
Fencing
Parking Lot Repairs Concrete / Asphalt
Seal and Stripe
Walk ways / Flat work
Pavers
Retaining Walls
Locksets
Misc -$
Total Exterior Costs -$
KITCHENS/BATHS # of Units Per Unit Budget
Kitchen
Refrigerators $ 550 -$
Stoves/Ranges $ 380 -$
Hoods $ 50 -$
Microwaves $ 250 -$
Dish Washers $ 300 -$
Cabinets Paint boxes $ 250 -$
Cabinets Replace Doors $ 650 -$
Cabinet Hardware $ 100 -$
Counter tops Spray $ 250 -$
Kitchen Faucets $ 100 -$
Flooring/ Kitchen $ 3.00 -$
Flooring /Foyer $ 3.00 -$
Flooring W/D area $ 3.00 -$
Total Kitchen Costs -$
All Bathrooms
Vanities Spray box $ 75 -$
Vanities Replace Doors $ 100 -$
Vanities Hardware $ 25 -$
Vanity Spray Top $ 75 -$
Bathroom Faucets $ 60 -$
Curved Shower Rods $ 45 -$
Flooring / Type $ 3.00 -$
Water Savings ($45) $ 45 -$
Total Bathroom Costs -$
Rehab. Budget Section Two
INTERIOR
# of
Units
Cost per
Unit Budget
Interior Paint 1 Color $ 350 -$
Carpet Clean $ 100 -$
Carpet New $ 900 -$
Lighting Package $ 425 -$
Final unit clean $ 100 -$
Final punch $ 300 -$
Total Interior -$
MECHANICALS
# of
Units
Cost per
Unit Budget
Hot Water Heaters $ 400 -$
Air Conditioning Handlers $ 900 -$
Air Conditioning Condensors $ 1,280 -$
Smoke Detectors Battery / Hard Wired $ 60 -$
Carbon Monoxide Detectors $ 75 -$
Water Conservation $ 50 -$
Poly Pipes $ 350 -$
GFCI -$
Washer and Dryer Sets $ 975 -$
Meter Banks -$
Fire Inspection/Systems -$
Miscellaneous -$
Total Mechanicals -$
Total Hard Costs 398,000$
Per Unit $1,185
SOFT COSTS
Renovation Contingency & Interest Reserve $100,000
Marketing $35,000
Management Rehab Fee $0
Total Soft Costs $135,000
Total 0$
Per Unit $0.00
Default (Override) Rehab Cost/Unit 0$
Rehab. Budget Section Three
Additional Sheets from Sample Underwriting Template
The following section contains two images from two of the tabs/sheets excerpted another Excel
underwriting template. This data would NOT typically be seen by an investor.
The first image is excerpted from the “Financing” tab/sheet of an underwriting Excel
workbook. Once the broker provided data is entered, all aspects of the financing structure and
holding period can be controlled on this one tab, while providing verification of how the potential
return is impacted by these changes. This area reflects and manages all cash flow portions of the file
via the use of single cell controls interacting with automated/reactive formulas in the other portions
of file. This section provides confirmation of changes made to the structure of investment and
financing. These changes can then be referenced in a matrix to show an array of options. A record
of the impact of these debt options can then can then be retained on the Debt Comparison Matrix
for future reference.
Original Loan Amount $19,000,000 22,875,000$ 19,000,000$ $4,200,000 $23,765,868
Max. Supplemental N/A N/A N/A 72% N/A
Origination Date 10/15/2013 11/15/14 10/15/13 11/15/14 7/15/23
Loan Term 10 7 10 9 7
Interest Rate 4.32% 4.25% 4.32% 4.32% 5.32%
IO Months 0 36 0 0 0
Amortization 360 360 360 360 360
Remaining IO Months 0 36 0 0 0
IO End Date 10/15/13 11/14/17 10/15/13 10/15/13 Jul-23
Maturity date Oct-23 Nov-21 Oct-23 Jul-23 Jul-30
Constant 5.95% 5.90% 5.95% 5.95% 6.68%
DSC 1.61 1.35 1.61 1.32 1.60
Annual Debt Service $1,130,986 $1,350,375 $1,130,986 $250,007 $1,587,220
Agency Debt Yes Yes Yes Cash Out
Yes
Agency Debt (Agency or Blank) Agency
10 07/15/23
Year 3 Supplemental Override Permit 11/15/17
Year 5 Supplemental Override Permit 11/15/19
Investment Disposition Window August-21 November-21
Cash Out @ Full REFI No 7/15/23
City/State WFH 80%:
Med. HH Income WFH 100%:
Housing Cost Factor WFH 120%:
ACQUISITION DEBT MATRIX LEGEND
Data to Populate Insert Data Disposition Date November-21
Do NOT Populate Auto-Calc or N/A NOI Value @ DISPO. $41,705,634
"Key" Cell "$0" or Existing Debt Balance @ DISPO. $24,725,965
Reversion Equity $16,979,669
Debt Matrix
EXISTING NEW DEBT ACQ. DEBT
SUPP./2nd Mort.
@ Acqusition
Primary
REFINANCE
Supplemental/2nd Mortgage? (Yes or No)
Refinance Factor (Years after New Debt, -90 Days)
DISPOSITION DATA
Market/MSA $889
$47,631 $1,111
28% $1,334
#1 #2 #3 #4 #5 #6 #7 #8 #9 #10
$19,000,000
$2,960,000 N/A N/A N/A N/A N/A N/A N/A N/A
11/11/14
10
4.32%
0
360
0 -1,378 -1,378 -1,378 -1,378 -1,378 -1,378 -1,378 -1,378 -1,378
11/11/14 1/0/00 1/0/00 1/0/00 1/0/00 1/0/00 1/0/00 1/0/00 1/0/00 1/0/00
11/10/24 1/0/00 1/0/00 1/0/00 1/0/00 1/0/00 1/0/00 1/0/00 1/0/00 1/0/00
5.95% #NUM! #NUM! #NUM! #NUM! #NUM! #NUM! #NUM! #NUM! #NUM!
1.61 #NUM! #NUM! #NUM! #NUM! #NUM! #NUM! #NUM! #NUM! #NUM!
$1,130,986 #NUM! #NUM! #NUM! #NUM! #NUM! #NUM! #NUM! #NUM! #NUM!
IRR Year 1 -6% 0% 0% 0% 0% 0% 0% 0% 0% 0% 0%
IRR Year 2 12% 0% 0% 0% 0% 0% 0% 0% 0% 0% 0%
IRR Year 3 17% 0% 0% 0% 0% 0% 0% 0% 0% 0% 0%
IRR Year 5 18% 0% 0% 0% 0% 0% 0% 0% 0% 0% 0%
IRR Year 7 19% 0% 0% 0% 0% 0% 0% 0% 0% 0% 0%
IRR Year 10 N/A 0% 0% 0% 0% 0% 0% 0% 0% 0% 0%
Debt/Hold Schedule Year 1 Year 2 Year 3 Year 4 Year 5 Year 6 Year 7 Year 8 Year 9 Year 10
No No No No No No Yes No No No
Anniversary Date 11/11/15 11/11/16 11/11/17 11/11/18 11/11/19 11/11/20 11/11/21 11/11/22 11/11/23 11/11/24
No No Yes Yes Yes Yes Yes Yes No No
No No No No No No No No No No
No No No No No No No No Yes Yes
Supplemental @ Acquisition No No No No No No No No No No
Debt Comparison Matrix
Origination Date
Loan Term
Max. Supplemental
New Debt New Debt New Debt New Debt
Original Loan Amount
New Debt New DebtExisting Debt
Supplemental
Years 3 & 5
New Debt New DebtOptions:
Debt Type
Interest Rate
IO Months
Amortization
Maturity date
Constant
Remaining IO Months
DSC
Annual Debt Service
Projected Sale Period
IO End Date
Assume Existing First Mortgage
New First Mortgage
First Mortgage Refinance
The following image is an excerpt of one of two investment waterfalls within the template.
Portfolio Name
Acquisition Date 11/11/14
Anniversary Date 11/11/14 11/11/15 11/11/16 11/11/17 11/11/18 11/11/19 11/11/20 11/11/21 11/11/22
Investment Disposition Window 08/13/21 11/11/21
Cash-Out Refi Cash-Out Refi Sale
Cash Flows Equity Year 1 Year 2 Year 3 Year 4 Year 5 Year 6 Year 7 IRR
Expected Cash Flows: 7 Years ($8,797,387) $291,707 $402,505 $2,230,380 $471,980 $3,682,114 $400,531 $17,199,583 19%
Equity GP Partner #1 75.0% (9,748,040)$ 218,780$ 301,879$ 1,672,785$ 353,985$ 2,761,585$ 300,398$ 11,530,178$ 10%
Equity Partner #2 10.0% (1,299,739)$ 29,171$ 40,250$ 223,038$ 47,198$ 368,211$ 40,053$ 1,537,357$ 10%
Equity Partner #3 10.0% (1,299,739)$ 29,171$ 40,250$ 223,038$ 47,198$ 368,211$ 40,053$ 1,537,357$ 10%
Equity Partner #4 5.0% (649,869)$ 14,585$ 20,125$ 111,519$ 23,599$ 184,106$ 20,027$ 768,679$ 10%
Equity Partner #5 0.0% -$ -$ -$ -$ -$ -$ -$ -$ 0%
(12,997,387)$ 291,707$ 402,505$ 2,230,380$ 471,980$ 3,682,114$ 400,531$ 15,373,570$
Preferred ROC Yield 10%/15% Threshold 10% Preferred ROC Yield 10% Year 1 Year 2 Year 3 Year 4 Year 5 Year 6 Year 7
Equity GP Partner #1 10% 974,804$ 1,050,406$ 1,125,259$ 1,070,507$ 1,142,159$ 980,216$ 1,048,198$
Shortfall Pref/Principal Returned (756,024)$ (748,528)$ 547,526$ (716,522)$ 1,619,427$ (679,818)$ 10,481,980$
Principal Remaining/15% Threshold 10,504,064$ 11,252,592$ 10,705,066$ 11,421,588$ 9,802,162$ 10,481,980$
Equity Partner #2 10% 129,974$ 140,054$ 150,035$ 142,734$ 152,288$ 130,695$ 139,760$
Shortfall Pref/Principal Returned (100,803)$ (99,804)$ 73,003$ (95,536)$ 215,924$ (90,642)$ 1,397,597$
Principal Remaining/15% Threshold 1,400,542$ 1,500,346$ 1,427,342$ 1,522,878$ 1,306,955$ 1,397,597$
Equity Partner #3 10% 129,974$ 140,054$ 150,035$ 142,734$ 152,288$ 130,695$ 139,760$
Shortfall Pref/Principal Returned (100,803)$ (99,804)$ 73,003$ (95,536)$ 215,924$ (90,642)$ 1,397,597$
Principal Remaining/15% Threshold 1,400,542$ 1,500,346$ 1,427,342$ 1,522,878$ 1,306,955$ 1,397,597$
Equity Partner #4 10% 64,987$ 5,040$ 3,532$ (7,267)$ (10,354)$ (29,800)$ (34,782)$
Shortfall Pref/Principal Returned (50,402)$ 15,085$ 107,987$ 30,866$ 194,459$ 49,826$ 803,461$
Principal Remaining/15% Threshold 50,402$ 35,316$ (72,671)$ (103,537)$ (297,996)$ (347,823)$
Equity Partner #5 10% -$ -$ -$ -$ -$ -$ -$
Shortfall Pref/Principal Returned -$ -$ -$ -$ -$ -$ -$
Principal Remaining/15% Threshold -$ -$ -$ -$ -$ -$
Investment Waterfall
15% 15% Threshold Year 1 Year 2 Year 3 Year 4 Year 5 Year 6 Year 7
20% Promote Payment to GP 20% $1,941,611
80% Distribution to Investors to 15% IRR 80% $7,766,445
Equity GP Partner #1 (9,748,040)$ 218,780$ 301,879$ 1,672,785$ 353,985$ 2,761,585$ 300,398$ 17,355,010$ 15.0%
Equity Partner #2 (1,299,739)$ 29,171$ 40,250$ 223,038$ 47,198$ 368,211$ 40,053$ 2,314,001$ 15.0%
Equity Partner #3 (1,299,739)$ 29,171$ 40,250$ 223,038$ 47,198$ 368,211$ 40,053$ 2,314,001$ 15.0%
Equity Partner #4 (649,869)$ 14,585$ 20,125$ 111,519$ 23,599$ 184,106$ 20,027$ 1,157,001$ 15.0%
Equity Partner #5 -$ -$ -$ -$ -$ -$ -$ -$
(12,997,387)$ 291,707$ 402,505$ 2,230,380$ 471,980$ 3,682,114$ 400,531$ 23,140,014$ 15.0%
75/25 Waterfall to Exit Cash Distribution
Remaining Cash Flow: (7,882,042)$
25% Promote to GP 25% (1,970,510)$
75% Distribution to Investors 75% (5,911,531)$
Equity GP Partner #1 (4,433,649)$
Equity Partner #2 (591,153)$
Equity Partner #3 (591,153)$
Equity Partner #4 (295,577)$
Equity Partner #5 -$
TOTAL EXIT CASH FLOW DISTRIBUTED: 17,199,583$
Equity GP Partner #1 (9,748,040)$ 218,780$ 301,879$ 1,672,785$ 353,985$ 2,761,585$ 300,398$ 12,892,462$ 11%
Equity Partner #2 (1,299,739)$ 29,171$ 40,250$ 223,038$ 47,198$ 368,211$ 40,053$ 1,722,848$ 11%
Equity Partner #3 (1,299,739)$ 29,171$ 40,250$ 223,038$ 47,198$ 368,211$ 40,053$ 1,722,848$ 11%
Equity Partner #4 (649,869)$ 14,585$ 20,125$ 111,519$ 23,599$ 184,106$ 20,027$ 861,424$ 11%
Equity Partner #5 -$ -$ -$ -$ -$ -$ -$ -$ 0%
Deal IRR (12,997,387)$ 291,707$ 402,505$ 2,230,380$ 471,980$ 3,682,114$ 400,531$ 17,199,583$ 11%
Additional Tabs/Sheets NOT Provided
Additional tabs/sheets within this template that are not provided are a Sources and Uses tab/sheet,
and three separate tabs/sheets that apply to First Mortgage Financing, Second/Supplemental
Mortgages (including strategic “Cash-Out” refinancing), as well as what is required for portfolio
underwriting.

KMT Sample 7.16

  • 1.
    Kevin Michael Thompson 772.341.5795│ kevsbox1@hotmail.com │ Full Resume at: http://www.linkedin.com/pub/kevin-thompson/18/565/18/en Sample Underwriting Proforma Template Excerpt Below is the first image excerpted from a number of tabs/sheets in an Excel underwriting template that I developed and typically use for underwriting multi-family assets. What is shown in the following images is what might be forwarded to an investment fund or lender for underwriting and analyses, and some portions of this template might also (and have been) used in a formal Investment Summary. What is shown below highlights aspects of the property location, unit counts/sizes, existing rental income, existing or prospective financing, etc., and the prospective returns for the investment. Institutional Asset MSA: Summary of Purchase Per Unit Cap Rate Fin. Reference Purchase/Offer Price: $90,774 5.70% Mar-14 Asking Price(/Unit): $94,000 5.50% Price (@ Cap Rate): $82,726 6.25% Year Constructed: 2013 Estimated Rehab/Unit $0 Referenced Data: Acquisition Terms: See "Notes:" Manually Fill: Investment Year 1 Year 2 Year 3 Year 5 Year 7 Avg Rent Increase $55 $45 $45 $41 $45 Average Eff. Rent/Unit $900 $948 $993 $1,074 $1,162 CPI Only Eff. Rent $913 $949 $987 $1,068 $1,155 CPI Only Increase $35 $37 $38 $40 $44 Value Add/Repositioning $20 $8 $7 N/A N/A Income/Unit $10,472 $11,045 $11,609 $12,557 $13,581 Expense/unit $5,244 $5,487 $5,719 $6,100 $6,477 NOI/Unit $5,228 $5,558 $5,890 $6,456 $7,104 Market Value/Unit $90,514 $96,510 $102,551 $112,845 $124,626 IRR -6% 12% 17% 18% 19% COC -4% 6% 6% 5% 5% DSC 1.21 1.29 1.37 1.38 1.29 Income CPI 4.00% Expense CPI 3.00% Exit cap 5.50% Refi Int Rate 6.25% Estimated Closing Date: 11/11/14 Class of Asset A Instutional Grade Yes Location Rating A Green Demographics A- Yellow Building Quality A 6 Recent Renovations N/A 6 Barriers to Entry B 6 New Construction C Occupancy Projections A+ Rents A Rent Growth Good Miscellaneous Average Austin, TX Austin Crime Rating Schools Elementary Middle/Junior High High School Other Analyses/Neighborhood Data $1,084,000 $30,500,000 $31,584,000 $27,796,080
  • 2.
    Both the precedingand subsequent image are from the same tab, which provides a good general overview of the asset. What is shown is the asset unit counts/sizes, existing rental income, qualitative data about the asset and seller, and an area to include rudimentary information on assets acquired within the competitive market. Notes: Acq Comps: Institutional Asset Yr Built 2013 Price/Unit $90,774 All In/Unit $95,260 Avg Unit SF 739 In Cap 5.70% Exit Cap 5.50% Inc/Unit $10,317 In-Place Rents/Unit Mix Unit Size # Units Mkt Rent PSF LTL Eff Rent PSF Annual Rent 1 bedroom 1 bathroom 525 24 $851 $1.62 ($112) $739 $1.41 $245,088 7% 1 bedroom 1 bathroom 525 48 $848 $1.62 ($112) $736 $1.40 $488,448 14% 1 bedroom 1 bathroom 625 28 $902 $1.44 ($112) $790 $1.26 $303,072 8% 1 bedroom 1 bathroom 625 28 $899 $1.44 ($112) $787 $1.26 $302,064 8% 1 bedroom 1 bathroom 625 28 $898 $1.44 ($112) $786 $1.26 $301,728 8% 1 bedroom 1 bathroom 775 32 $998 $1.29 ($112) $886 $1.14 $383,232 10% 1 bedroom 1 bathroom 775 32 $981 $1.27 ($112) $869 $1.12 $376,704 10% 1 bedroom 1 bathroom 775 32 $969 $1.25 ($112) $857 $1.11 $372,096 10% 75.0% 2 bedroom 2 bathroom 995 28 $1,237 $1.24 ($112) $1,125 $1.13 $415,632 8% 2 bedroom 2 bathroom 995 28 $1,203 $1.21 ($112) $1,091 $1.10 $404,208 8% 2 bedroom 2 bathroom 995 28 $1,182 $1.19 ($112) $1,070 $1.08 $397,152 8% 25.0% 336 $989 $1.34 ($450,154) $878 $1.19 $3,989,424 739 ($37,513) $332,452 ($112) Eff Rent: $878 Vacancy Jan-14 4.2% 5% $44 6% $53 7% $61 8% $70 unit types Unit Mix 248,280 Acquisition Comp #1 Acquisition Comp #2 Acquisition Comp #3 Acquisition Comp #4 Acquisition Comp #5 The unit mix lends itself to young techno-geek tenants (smaller, and A+), resulting in a good tenant profile. Nice A-Class asset, but with small units. This is both a pro and con due to the demographics and market appeal. Selling Motive: two partners are divesting. Developer's mistakes: Vacant land nearby prepared for development, units are currently being built in the neighborhood (nearby competitor is 40% leased, but at $1.23/SF. Velocity is +40 units month), and getting the loan product they did at that point in time. The seller is now building 80,000+ SF of office space. Lender has been approached about supplemental (to bring debt up to 75% AT THE SAME I.R., but NOT confirmed yet). Crime: Green. Schools Avg: "6." Austin is a stronger/more growth- oriented market than San Antonio or Dallas. Higher increases in rents during the last two years than S.A., but new product is coming on line as the price per unit is making new construction feasible. High net worth family from Winnipeg is behind the equity, but Ledcor fund is out of Vancover. Westwood Residential was the builder. Park and ride is nearby.
  • 3.
    The following twoimages are from the “Income Analysis” tab where the most significant analysis is displayed. KEY RATIOS A p 0 Mar-14 Year 1 Year 2 Year 3 Year 4 Year 5 Year 6 Year 7 Rent Increase $55 $45 $45 $40 $41 $43 $45 Economic Occupancy: #DIV/0! 96% 94% 94% 94% 94% 94% 94% 94% Economic Vacancy: #DIV/0! 4% 6% 6% 6% 6% 6% 6% 6% Average Rent/Unit $0 $858 $900 $948 $993 $1,033 $1,074 $1,117 $1,162 Loss to Lease: #DIV/0! 12.24% 9.08% 4.18% -0.37% -0.37% -0.37% -0.37% -0.37% Bad Debt #DIV/0! 0.57% 1.0% 1.0% 1.0% 1.0% 1.0% 1.0% 1.0% Income/Unit $0.00 $10,317 $10,472 $11,045 $11,609 $12,074 $12,557 $13,059 $13,581 Expenses/Unit $0 $4,896 $5,244 $5,487 $5,719 $5,907 $6,100 $6,286 $6,477 NOI/Unit $0 $5,420 $5,228 $5,558 $5,890 $6,167 $6,456 $6,773 $7,104 Cap Rate of ALL In Costs 5.69% 5.49% 5.83% 6.18% 6.47% 6.78% 7.11% 7.46% DSCR 0 1.26 1.21 1.29 1.37 1.31 1.38 1.22 1.29 PROFORMA INCOME Appraisal Mar-14 Nov-14 Nov-15 Nov-16 Nov-17 Nov-18 Nov-19 Nov-20 Rent - Gross Possible $3,941,186 $11,873 /unit $3,989,424 $3,989,424 $3,989,424 $4,149,001 $4,314,961 $4,487,559 $4,667,062 Loss to Lease/Concessions ($482,487) $1,078 /unit ($362,064) ($166,764) $14,676 $15,263 $15,874 $16,509 $17,169 $0 $3,458,699 $3,627,360 $3,822,660 $4,004,100 $4,164,264 $4,330,835 $4,504,068 $4,684,231 Vacancy ($152,366) ($679) /unit ($228,309) ($239,365) ($239,365) ($248,940) ($258,898) ($269,254) ($280,024) Bad Debt ($21,572) 1% /unit ($37,611) ($37,501) ($37,501) ($39,001) ($40,561) ($42,183) ($43,870) Admin Unit incl models ($17,205) 3.5 ($41,557) ($41,557) ($41,557) ($43,219) ($44,948) ($46,745) ($48,615) Other Income $198,845 $592 /unit $198,845 $206,799 $215,071 $223,674 $232,621 $241,925 $251,602 Effective Gross Revenue $0 $3,466,401 CPIInc 4.00% $3,518,729 $3,711,036 $3,900,748 $4,056,778 $4,219,049 $4,387,811 $4,563,324 1.51% 5.47% 5.11% 4.00% 4.00% 4.00% 4.00% EXPENSES Appraisal 0 Mar-14 Year 1 Year 2 Year 3 Year 4 Year 5 Year 6 Year 7 Administrative $61,864 $220 /unit $73,920 $76,138 $78,422 $80,774 $83,198 $85,694 $88,264 Marketing Expense $80,323 $250 /unit $84,000 $86,520 $89,116 $91,789 $94,543 $97,379 $100,300 R&M $86,807 $600 /unit $201,600 $207,648 $213,877 $220,294 $226,903 $233,710 $240,721 Utilities $97,345 $298 /unit $100,265 $103,273 $106,372 $109,563 $112,850 $116,235 $119,722 Payroll $380,047 $1,100 /unit $369,600 $380,688 $392,109 $403,872 $415,988 $428,468 $441,322 Insurance $70,290 $218 /unit $73,416 $75,618 $77,887 $80,223 $82,630 $85,109 $87,662 RE Taxes (Peor Projection) $761,000 $2,265 /unit $788,853 $839,432 $885,811 $916,947 $949,178 $977,653 $1,006,983 Management Fees $107,470 2.0% /unit $70,375 $74,221 $78,015 $81,136 $84,381 $87,756 $91,266 Total Expenses $0 $1,645,146 336 units $1,762,028 $1,843,538 $1,921,607 $1,984,598 $2,049,669 $2,112,003 $2,176,241 CPIExp 3.00% 7.10% 4.63% 4.23% 3.28% 3.28% 3.04% 3.04% NOI Before RR $0 $1,821,255 $1,756,700 $1,867,498 $1,979,141 $2,072,180 $2,169,380 $2,275,808 $2,387,083 -4% 6% 6% 5% 5% 5% 5% Replacement Reserve $84,000 $250 /unit $84,000 $84,000 $84,000 $84,000 $84,000 $84,000 $84,000 NOI After RR $0 $1,737,255 $1,672,700 $1,783,498 $1,895,141 $1,988,180 $2,085,380 $2,191,808 $2,303,083 ACTUAL Normalized Normalized Normalized
  • 4.
    CASH FLOW Nov-15Nov-16 Nov-17 Nov-18 Nov-19 Nov-20 Nov-21 NOI after RR $1,672,700 $1,783,498 $1,895,141 $1,988,180 $2,085,380 $2,191,808 $2,303,083 Annual Debt Service $1,130,986 $1,130,986 $1,130,986 $1,130,986 $1,130,986 $1,130,986 $1,130,986 Supp/2nd Mortgage $250,007 $250,007 $250,007 $385,215 $385,215 $660,291 $660,291 Cash Flow after Debt Service $291,707 $402,505 $514,147 $471,980 $569,179 $400,531 $511,806 PMT(Financing!F21/12,Financing!E20*12,Financing!F15,0) RETURN OF CAPITAL Year 1 Year 2 Year 3 Year 4 Year 5 Year 6 Year 7 Equity Balance Equity Override: $8,797,864 $9,385,943 $9,922,032 $8,683,856 $9,080,261 $6,306,174 $6,536,260 Cash Flow for Distribution Rehab Costs: $291,707 $402,505 $514,147 $471,980 $569,179 $400,531 $511,806 Capital Event Distribution $0 $0 $1,716,233 $0 $3,112,935 $0 $9,774,522 Preferred Return 10.0% $879,786 $938,594 $992,203 $868,386 $908,026 $630,617 $653,626 ROC/Shortfall ($588,079) ($536,089) $1,238,177 ($396,406) $2,774,088 ($230,086) $9,632,702 CoC 3.3% 4.3% 5.2% 5.4% 6.3% 6.4% 7.8% Cumulative Distribution $291,707 $694,212 $2,924,592 $3,396,572 $7,078,686 $7,479,217 $24,301,805 REFINANCE SCENARIO Oct-13 Year 1 Year 2 Year 3 Year 4 Year 5 Year 6 Year 7 Value at Cap Rate $31,586,455 5.50% $30,412,731 $32,427,240 $34,457,104 $36,148,734 $37,915,999 $39,851,055 $41,874,233 Per Unit Exit Cap Override 0.00% $90,514 $96,510 $102,551 $107,586 $112,845 $118,604 $124,626 Maximum Financing 68% $20,680,657 $22,050,523 $23,430,831 $24,581,139 $25,782,879 $27,098,717 $28,474,478 Payoff 1st Mortgage ($18,325,076) ($17,978,933) ($17,617,537) ($17,240,216) ($16,846,268) ($16,434,960) ($16,005,528) Supplemental Loan $5,813,294 $0 $8,936,611 $0 $0 Cost of Loan 2.00% ($116,266) $0 ($178,732) $0 $0 Payoff 2nd Mortgage ($3,980,795) ($5,644,944) Available For Distribution If negative, no distrbution/supplemental: $1,716,233 $0 $3,112,935 $0 $0 SALES SCENARIO Year 1 Year 2 Year 3 Year 4 Year 5 Year 6 Year 7 Value at Cap Rate 5.50% $30,412,731 $32,427,240 $34,457,104 $36,148,734 $37,915,999 $39,851,055 $41,874,233 Per Unit $90,514 $96,510 $102,551 $107,586 $112,845 $118,604 $124,626 Cost of Sale 2.00% ($608,255) ($648,545) ($689,142) ($722,975) ($758,320) ($797,021) ($837,485) Equity Returned ($8,797,864) ($9,385,943) ($9,922,032) ($8,683,856) ($9,080,261) ($6,306,174) ($6,536,260) Return of Escrows and Reserves $591,230 $591,230 $591,230 $591,230 $591,230 $591,230 $591,230 Payoff 1st Mortgage ($18,325,076) ($17,978,933) ($17,617,537) ($17,240,216) ($16,846,268) ($16,434,960) ($16,005,528) Payoff 2nd Mortgage ($4,130,059) ($4,057,036) ($3,980,795) ($5,731,323) ($5,644,944) ($8,831,892) ($8,720,438) Remaining Dollars ($857,292) $948,013 $2,838,828 $4,361,595 $5,586,205 $7,481,008 $9,774,522 ESTIMATED IRR Total Return IRR Equity Year 1 Year 2 Year 3 Year 4 Year 5 Year 6 Year 7 N/A N/A Yes Yes Yes 1 yr Leveraged $8,232,279 -6% $8,232,279 2 yr Leveraged $11,028,168 12% $291,707 $10,736,461 3 yr Leveraged $13,969,219 17% $291,707 $402,505 $13,275,008 4 yr Leveraged $16,442,022 18% $291,707 $402,505 $2,230,380 $13,517,430 5 yr Leveraged $18,632,217 18% $291,707 $402,505 $2,230,380 $471,980 $15,235,646 7 yr Leveraged $24,301,804 19% $291,707 $402,505 $2,230,380 $471,980 $3,682,114 $400,531 $16,822,588 3 yr Unleveraged $39,710,532 8% $1,672,700 $1,783,498 $36,254,333 5 yr Unleveraged $47,173,808 9% $1,672,700 $1,783,498 $1,895,141 $1,988,180 $39,834,289 7 yr Unleveraged $55,547,768 9% $1,672,700 $1,783,498 $1,895,141 $1,988,180 $2,085,380 $2,191,808 $43,931,061 $0 ($31,997,864) ($8,797,864) ($31,997,864) Asset Pricing/Debt Equivalent $30,500,000 $0 $0 ($31,997,864) Selective Cash-Out Refinance: ($8,797,864) ($8,797,864) $1,130,986 $250,007 ($8,797,864) ($8,797,864) Disposition ($8,797,864)
  • 5.
    The following imageis the rental income projections for the first three years. As this underwriting is designed for use in underwriting “value-add” properties, displaying the income during the initial three years is designed to articulate the impact of increased rent projections, as well as projected changes in vacancy and loss to lease during the acquisition and rehabilitation periods. Institutional Asset Austin, TX Assumptions: Units 336 Current Occupancy 4.2% Lease Turnover/Month 28 Loss to Lease/Unit $112 Avg Rent Increases Year 1 $55 B15 From Current Rent Roll Year 2 $45 C15 from Beginning Monthly Rent OR Current Rent Roll Year 3 $45 100% Monthly Income Reference "Selection Factor" YEAR ONE Jan-14 Month 1 Month 2 Month 3 Month 4 Month 5 Month 6 Month 7 Month 8 Month 9 Month 10 Month 11 Month 12 Total Rent - Gross Possible $334,007 $332,452 $332,452 $332,452 $332,452 $332,452 $332,452 $332,452 $332,452 $332,452 $332,452 $332,452 $332,452 $3,989,424 Loss to Lease/Concessions ($37,502) ($35,947) ($35,947) ($35,947) ($34,407) ($32,867) ($31,327) ($29,787) ($28,247) ($26,707) ($25,167) ($23,627) ($22,087) ($362,064) $296,505 $296,505 $296,505 $296,505 $298,045 $299,585 $301,125 $302,665 $304,205 $305,745 $307,285 $308,825 $310,365 $3,627,360 Vacancy ($13,942) ($13,877) ($16,623) ($18,285) ($19,947) ($19,947) ($19,947) ($19,947) ($19,947) ($19,947) ($19,947) ($19,947) ($19,947) ($228,309) TOTAL Rent Collected $282,563 $282,628 $279,882 $278,220 $278,098 $279,638 $281,178 $282,718 $284,258 $285,798 $287,338 $288,878 $290,418 $3,399,051 Economic Vacancy 4.2% 4.2% 5.0% 5.5% 6.0% 6.0% 6.0% 6.0% 6.0% 6.0% 6.0% 6.0% 6.0% Economic Occupancy 95.8% 95.8% 95.0% 94.5% 94.0% 94.0% 94.0% 94.0% 94.0% 94.0% 94.0% 94.0% 94.0% Effective Rent Increase $0 $0 $0 $55 $55 $55 $55 $55 $55 $55 $55 $55 $55 YEAR TWO Month 13 Month 14 Month 15 Month 16 Month 17 Month 18 Month 19 Month 20 Month 21 Month 22 Month 23 Month 24 Total Rent - Gross Possible LTL: "Include" or Not: $332,452 $332,452 $332,452 $332,452 $332,452 $332,452 $332,452 $332,452 $332,452 $332,452 $332,452 $332,452 $3,989,424 Loss to Lease/Concessions N/A ($20,827) ($19,567) ($18,307) ($17,047) ($15,787) ($14,527) ($13,267) ($12,007) ($10,747) ($9,487) ($8,227) ($6,967) ($166,764) $311,625 $312,885 $314,145 $315,405 $316,665 $317,925 $319,185 $320,445 $321,705 $322,965 $324,225 $325,485 $3,822,660 Vacancy ($19,947) ($19,947) ($19,947) ($19,947) ($19,947) ($19,947) ($19,947) ($19,947) ($19,947) ($19,947) ($19,947) ($19,947) ($239,365) TOTAL Rent Collected $291,678 $292,938 $294,198 $295,458 $296,718 $297,978 $299,238 $300,498 $301,758 $303,018 $304,278 $305,538 $3,583,295 Economic Vacancy 6.0% 6.0% 6.0% 6.0% 6.0% 6.0% 6.0% 6.0% 6.0% 6.0% 6.0% 6.0% Economic Occupancy 94.0% 94.0% 94.0% 94.0% 94.0% 94.0% 94.0% 94.0% 94.0% 94.0% 94.0% 94.0% Effective Rent Increase $45 $45 $45 $45 $45 $45 $45 $45 $45 $45 $45 $45 $45 YEAR THREE Month 25 Month 26 Month 27 Month 28 Month 29 Month 30 Month 31 Month 32 Month 33 Month 34 Month 35 Month 36 Total Rent - Gross Possible LTL: "Include" or Not: $332,452 $332,452 $332,452 $332,452 $332,452 $332,452 $332,452 $332,452 $332,452 $332,452 $332,452 $332,452 $3,989,424 Loss to Lease/Concessions N/A ($5,707) ($4,447) ($3,187) ($1,927) ($667) $593 $1,853 $3,113 $4,373 $5,633 $6,893 $8,153 $14,676 $326,745 $328,005 $329,265 $330,525 $331,785 $333,045 $334,305 $335,565 $336,825 $338,085 $339,345 $340,605 $4,004,100 Vacancy ($19,947) ($19,947) ($19,947) ($19,947) ($19,947) ($19,947) ($19,947) ($19,947) ($19,947) ($19,947) ($19,947) ($19,947) ($239,365) TOTAL Rent Collected $306,798 $308,058 $309,318 $310,578 $311,838 $313,098 $314,358 $315,618 $316,878 $318,138 $319,398 $320,658 $3,764,735 Economic Vacancy 6.0% 6.0% 6.0% 6.0% 6.0% 6.0% 6.0% 6.0% 6.0% 6.0% 6.0% 6.0% Economic Occupancy 94.0% 94.0% 94.0% 94.0% 94.0% 94.0% 94.0% 94.0% 94.0% 94.0% 94.0% 94.0% Effective Rent Increase $45 $45 $45 $45 $45 $45 $45 $45 $45 $45 $45 $45 $45 THREE YEAR RENT ESCALATION
  • 6.
    This image isthe real estate/property tax projections for the asset, and all subsequent images (of additional tabs/sheets in the Excel workbook) are for internal use of the company/organization. Assessed/Inc in Value 85% 90% 5.0% 3.0% 3.0% Purchase Price Inc in non Adv 1.0% 0.5% 0.5% 0.5% 0.5% $30,500,000 Inc in Millage 1.0% 0.5% 0.5% 0.5% 0.5% 2013 2014 2015 2016 2017 2018 School Assess $24,070,000 $25,925,000 $27,450,000 $28,822,500 $29,687,175 $30,577,790 Non School Assess $0 $27,450,000 $28,822,500 $29,687,175 $30,577,790 School Millage 30.1270 30.4283 30.5804 30.7333 30.8870 31.0414 Non School Millage - - - - - Non Adv $0 $0 $0 $0 $0 0% Discount 100% $725,157 $788,853 $839,432 $885,811 $916,947 $949,178 $725,157 $788,853 $839,432 $885,811 $916,947 $949,178 Institutional Asset Assumptions/Projections - Real Estate Taxes
  • 7.
    The rehabilitation ofa “Value-Add” asset includes all construction costs and associated fees for repairs and upgrades in an integrated “Rehab” tab/worksheet associated with each asset. With a value add asset, this displayed in the following three images. Units 336 Bedrooms 420 Bathrooms 420 IMMEDIATE REPAIRS Budget months 10,000$ months months months Total Immediate Repairs 10,000$ AMENITY UPGRADES Budget Site Signage 30,000$ Landscape and Tree Trim 75,000$ Irrigation 20,000$ Security Cameras 10,000$ Handi Trac 15,000$ Trash Compactor 52,000$ Club House/ Leasing center 65,000$ Pergula's # of 4,000$ Coffee Shop 2,500$ Fitness Center 7,500$ Fitness equipment 15,000$ Pools / # of Sports court / type 8,000$ Laundry Facilities # of Golf Cart Kids center 5,000$ Dog park 7,500$ BBQ Area 4,000$ Wi-Fi 5,000$ Office Equipment/ Computers 5,000$ Office Furniture 10,000$ Club House Furniture 25,000$ Model Furniture # of 10,000$ Pool Furniture # 0f 12,500$ Total Amenities Costs 388,000$ Time to Complete Repairs Rehab. Budget Section One
  • 8.
    EXTERIOR # ofUnits Cost per Unit Budget Roofs Repairs / Replace Siding Soffit and Facia Gutters, Down Spouts, Pads Exterior Painting $ 350 -$ Patio Decks Hallways / Entrences (Railings Painted/Stairways) Exterior Lighting Fencing Parking Lot Repairs Concrete / Asphalt Seal and Stripe Walk ways / Flat work Pavers Retaining Walls Locksets Misc -$ Total Exterior Costs -$ KITCHENS/BATHS # of Units Per Unit Budget Kitchen Refrigerators $ 550 -$ Stoves/Ranges $ 380 -$ Hoods $ 50 -$ Microwaves $ 250 -$ Dish Washers $ 300 -$ Cabinets Paint boxes $ 250 -$ Cabinets Replace Doors $ 650 -$ Cabinet Hardware $ 100 -$ Counter tops Spray $ 250 -$ Kitchen Faucets $ 100 -$ Flooring/ Kitchen $ 3.00 -$ Flooring /Foyer $ 3.00 -$ Flooring W/D area $ 3.00 -$ Total Kitchen Costs -$ All Bathrooms Vanities Spray box $ 75 -$ Vanities Replace Doors $ 100 -$ Vanities Hardware $ 25 -$ Vanity Spray Top $ 75 -$ Bathroom Faucets $ 60 -$ Curved Shower Rods $ 45 -$ Flooring / Type $ 3.00 -$ Water Savings ($45) $ 45 -$ Total Bathroom Costs -$ Rehab. Budget Section Two
  • 9.
    INTERIOR # of Units Cost per UnitBudget Interior Paint 1 Color $ 350 -$ Carpet Clean $ 100 -$ Carpet New $ 900 -$ Lighting Package $ 425 -$ Final unit clean $ 100 -$ Final punch $ 300 -$ Total Interior -$ MECHANICALS # of Units Cost per Unit Budget Hot Water Heaters $ 400 -$ Air Conditioning Handlers $ 900 -$ Air Conditioning Condensors $ 1,280 -$ Smoke Detectors Battery / Hard Wired $ 60 -$ Carbon Monoxide Detectors $ 75 -$ Water Conservation $ 50 -$ Poly Pipes $ 350 -$ GFCI -$ Washer and Dryer Sets $ 975 -$ Meter Banks -$ Fire Inspection/Systems -$ Miscellaneous -$ Total Mechanicals -$ Total Hard Costs 398,000$ Per Unit $1,185 SOFT COSTS Renovation Contingency & Interest Reserve $100,000 Marketing $35,000 Management Rehab Fee $0 Total Soft Costs $135,000 Total 0$ Per Unit $0.00 Default (Override) Rehab Cost/Unit 0$ Rehab. Budget Section Three
  • 10.
    Additional Sheets fromSample Underwriting Template The following section contains two images from two of the tabs/sheets excerpted another Excel underwriting template. This data would NOT typically be seen by an investor. The first image is excerpted from the “Financing” tab/sheet of an underwriting Excel workbook. Once the broker provided data is entered, all aspects of the financing structure and holding period can be controlled on this one tab, while providing verification of how the potential return is impacted by these changes. This area reflects and manages all cash flow portions of the file via the use of single cell controls interacting with automated/reactive formulas in the other portions of file. This section provides confirmation of changes made to the structure of investment and financing. These changes can then be referenced in a matrix to show an array of options. A record of the impact of these debt options can then can then be retained on the Debt Comparison Matrix for future reference. Original Loan Amount $19,000,000 22,875,000$ 19,000,000$ $4,200,000 $23,765,868 Max. Supplemental N/A N/A N/A 72% N/A Origination Date 10/15/2013 11/15/14 10/15/13 11/15/14 7/15/23 Loan Term 10 7 10 9 7 Interest Rate 4.32% 4.25% 4.32% 4.32% 5.32% IO Months 0 36 0 0 0 Amortization 360 360 360 360 360 Remaining IO Months 0 36 0 0 0 IO End Date 10/15/13 11/14/17 10/15/13 10/15/13 Jul-23 Maturity date Oct-23 Nov-21 Oct-23 Jul-23 Jul-30 Constant 5.95% 5.90% 5.95% 5.95% 6.68% DSC 1.61 1.35 1.61 1.32 1.60 Annual Debt Service $1,130,986 $1,350,375 $1,130,986 $250,007 $1,587,220 Agency Debt Yes Yes Yes Cash Out Yes Agency Debt (Agency or Blank) Agency 10 07/15/23 Year 3 Supplemental Override Permit 11/15/17 Year 5 Supplemental Override Permit 11/15/19 Investment Disposition Window August-21 November-21 Cash Out @ Full REFI No 7/15/23 City/State WFH 80%: Med. HH Income WFH 100%: Housing Cost Factor WFH 120%: ACQUISITION DEBT MATRIX LEGEND Data to Populate Insert Data Disposition Date November-21 Do NOT Populate Auto-Calc or N/A NOI Value @ DISPO. $41,705,634 "Key" Cell "$0" or Existing Debt Balance @ DISPO. $24,725,965 Reversion Equity $16,979,669 Debt Matrix EXISTING NEW DEBT ACQ. DEBT SUPP./2nd Mort. @ Acqusition Primary REFINANCE Supplemental/2nd Mortgage? (Yes or No) Refinance Factor (Years after New Debt, -90 Days) DISPOSITION DATA Market/MSA $889 $47,631 $1,111 28% $1,334
  • 11.
    #1 #2 #3#4 #5 #6 #7 #8 #9 #10 $19,000,000 $2,960,000 N/A N/A N/A N/A N/A N/A N/A N/A 11/11/14 10 4.32% 0 360 0 -1,378 -1,378 -1,378 -1,378 -1,378 -1,378 -1,378 -1,378 -1,378 11/11/14 1/0/00 1/0/00 1/0/00 1/0/00 1/0/00 1/0/00 1/0/00 1/0/00 1/0/00 11/10/24 1/0/00 1/0/00 1/0/00 1/0/00 1/0/00 1/0/00 1/0/00 1/0/00 1/0/00 5.95% #NUM! #NUM! #NUM! #NUM! #NUM! #NUM! #NUM! #NUM! #NUM! 1.61 #NUM! #NUM! #NUM! #NUM! #NUM! #NUM! #NUM! #NUM! #NUM! $1,130,986 #NUM! #NUM! #NUM! #NUM! #NUM! #NUM! #NUM! #NUM! #NUM! IRR Year 1 -6% 0% 0% 0% 0% 0% 0% 0% 0% 0% 0% IRR Year 2 12% 0% 0% 0% 0% 0% 0% 0% 0% 0% 0% IRR Year 3 17% 0% 0% 0% 0% 0% 0% 0% 0% 0% 0% IRR Year 5 18% 0% 0% 0% 0% 0% 0% 0% 0% 0% 0% IRR Year 7 19% 0% 0% 0% 0% 0% 0% 0% 0% 0% 0% IRR Year 10 N/A 0% 0% 0% 0% 0% 0% 0% 0% 0% 0% Debt/Hold Schedule Year 1 Year 2 Year 3 Year 4 Year 5 Year 6 Year 7 Year 8 Year 9 Year 10 No No No No No No Yes No No No Anniversary Date 11/11/15 11/11/16 11/11/17 11/11/18 11/11/19 11/11/20 11/11/21 11/11/22 11/11/23 11/11/24 No No Yes Yes Yes Yes Yes Yes No No No No No No No No No No No No No No No No No No No No Yes Yes Supplemental @ Acquisition No No No No No No No No No No Debt Comparison Matrix Origination Date Loan Term Max. Supplemental New Debt New Debt New Debt New Debt Original Loan Amount New Debt New DebtExisting Debt Supplemental Years 3 & 5 New Debt New DebtOptions: Debt Type Interest Rate IO Months Amortization Maturity date Constant Remaining IO Months DSC Annual Debt Service Projected Sale Period IO End Date Assume Existing First Mortgage New First Mortgage First Mortgage Refinance
  • 12.
    The following imageis an excerpt of one of two investment waterfalls within the template. Portfolio Name Acquisition Date 11/11/14 Anniversary Date 11/11/14 11/11/15 11/11/16 11/11/17 11/11/18 11/11/19 11/11/20 11/11/21 11/11/22 Investment Disposition Window 08/13/21 11/11/21 Cash-Out Refi Cash-Out Refi Sale Cash Flows Equity Year 1 Year 2 Year 3 Year 4 Year 5 Year 6 Year 7 IRR Expected Cash Flows: 7 Years ($8,797,387) $291,707 $402,505 $2,230,380 $471,980 $3,682,114 $400,531 $17,199,583 19% Equity GP Partner #1 75.0% (9,748,040)$ 218,780$ 301,879$ 1,672,785$ 353,985$ 2,761,585$ 300,398$ 11,530,178$ 10% Equity Partner #2 10.0% (1,299,739)$ 29,171$ 40,250$ 223,038$ 47,198$ 368,211$ 40,053$ 1,537,357$ 10% Equity Partner #3 10.0% (1,299,739)$ 29,171$ 40,250$ 223,038$ 47,198$ 368,211$ 40,053$ 1,537,357$ 10% Equity Partner #4 5.0% (649,869)$ 14,585$ 20,125$ 111,519$ 23,599$ 184,106$ 20,027$ 768,679$ 10% Equity Partner #5 0.0% -$ -$ -$ -$ -$ -$ -$ -$ 0% (12,997,387)$ 291,707$ 402,505$ 2,230,380$ 471,980$ 3,682,114$ 400,531$ 15,373,570$ Preferred ROC Yield 10%/15% Threshold 10% Preferred ROC Yield 10% Year 1 Year 2 Year 3 Year 4 Year 5 Year 6 Year 7 Equity GP Partner #1 10% 974,804$ 1,050,406$ 1,125,259$ 1,070,507$ 1,142,159$ 980,216$ 1,048,198$ Shortfall Pref/Principal Returned (756,024)$ (748,528)$ 547,526$ (716,522)$ 1,619,427$ (679,818)$ 10,481,980$ Principal Remaining/15% Threshold 10,504,064$ 11,252,592$ 10,705,066$ 11,421,588$ 9,802,162$ 10,481,980$ Equity Partner #2 10% 129,974$ 140,054$ 150,035$ 142,734$ 152,288$ 130,695$ 139,760$ Shortfall Pref/Principal Returned (100,803)$ (99,804)$ 73,003$ (95,536)$ 215,924$ (90,642)$ 1,397,597$ Principal Remaining/15% Threshold 1,400,542$ 1,500,346$ 1,427,342$ 1,522,878$ 1,306,955$ 1,397,597$ Equity Partner #3 10% 129,974$ 140,054$ 150,035$ 142,734$ 152,288$ 130,695$ 139,760$ Shortfall Pref/Principal Returned (100,803)$ (99,804)$ 73,003$ (95,536)$ 215,924$ (90,642)$ 1,397,597$ Principal Remaining/15% Threshold 1,400,542$ 1,500,346$ 1,427,342$ 1,522,878$ 1,306,955$ 1,397,597$ Equity Partner #4 10% 64,987$ 5,040$ 3,532$ (7,267)$ (10,354)$ (29,800)$ (34,782)$ Shortfall Pref/Principal Returned (50,402)$ 15,085$ 107,987$ 30,866$ 194,459$ 49,826$ 803,461$ Principal Remaining/15% Threshold 50,402$ 35,316$ (72,671)$ (103,537)$ (297,996)$ (347,823)$ Equity Partner #5 10% -$ -$ -$ -$ -$ -$ -$ Shortfall Pref/Principal Returned -$ -$ -$ -$ -$ -$ -$ Principal Remaining/15% Threshold -$ -$ -$ -$ -$ -$ Investment Waterfall
  • 13.
    15% 15% ThresholdYear 1 Year 2 Year 3 Year 4 Year 5 Year 6 Year 7 20% Promote Payment to GP 20% $1,941,611 80% Distribution to Investors to 15% IRR 80% $7,766,445 Equity GP Partner #1 (9,748,040)$ 218,780$ 301,879$ 1,672,785$ 353,985$ 2,761,585$ 300,398$ 17,355,010$ 15.0% Equity Partner #2 (1,299,739)$ 29,171$ 40,250$ 223,038$ 47,198$ 368,211$ 40,053$ 2,314,001$ 15.0% Equity Partner #3 (1,299,739)$ 29,171$ 40,250$ 223,038$ 47,198$ 368,211$ 40,053$ 2,314,001$ 15.0% Equity Partner #4 (649,869)$ 14,585$ 20,125$ 111,519$ 23,599$ 184,106$ 20,027$ 1,157,001$ 15.0% Equity Partner #5 -$ -$ -$ -$ -$ -$ -$ -$ (12,997,387)$ 291,707$ 402,505$ 2,230,380$ 471,980$ 3,682,114$ 400,531$ 23,140,014$ 15.0% 75/25 Waterfall to Exit Cash Distribution Remaining Cash Flow: (7,882,042)$ 25% Promote to GP 25% (1,970,510)$ 75% Distribution to Investors 75% (5,911,531)$ Equity GP Partner #1 (4,433,649)$ Equity Partner #2 (591,153)$ Equity Partner #3 (591,153)$ Equity Partner #4 (295,577)$ Equity Partner #5 -$ TOTAL EXIT CASH FLOW DISTRIBUTED: 17,199,583$ Equity GP Partner #1 (9,748,040)$ 218,780$ 301,879$ 1,672,785$ 353,985$ 2,761,585$ 300,398$ 12,892,462$ 11% Equity Partner #2 (1,299,739)$ 29,171$ 40,250$ 223,038$ 47,198$ 368,211$ 40,053$ 1,722,848$ 11% Equity Partner #3 (1,299,739)$ 29,171$ 40,250$ 223,038$ 47,198$ 368,211$ 40,053$ 1,722,848$ 11% Equity Partner #4 (649,869)$ 14,585$ 20,125$ 111,519$ 23,599$ 184,106$ 20,027$ 861,424$ 11% Equity Partner #5 -$ -$ -$ -$ -$ -$ -$ -$ 0% Deal IRR (12,997,387)$ 291,707$ 402,505$ 2,230,380$ 471,980$ 3,682,114$ 400,531$ 17,199,583$ 11%
  • 14.
    Additional Tabs/Sheets NOTProvided Additional tabs/sheets within this template that are not provided are a Sources and Uses tab/sheet, and three separate tabs/sheets that apply to First Mortgage Financing, Second/Supplemental Mortgages (including strategic “Cash-Out” refinancing), as well as what is required for portfolio underwriting.