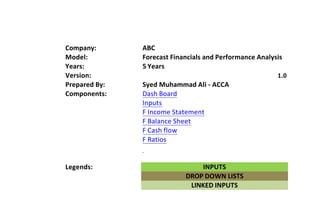
SlideShare a Scribd company logo
1 of 7
Download to read offline
Company: ABC
Model: Forecast Financials and Performance Analysis
Years: 5 Years
Version: 1.0
Prepared By: Syed Muhammad Ali - ACCA
Components: Dash Board
Inputs
F Income Statement
F Balance Sheet
F Cash flow
F Ratios
Legends: INPUTS
DROP DOWN LISTS
LINKED INPUTS
Main Menue
DASH Board
00 01 02 03 04 Action
Forecast Income Statement
Sales 42,766.88 49,181.91 56,559.20 65,043.08 74,799.54 sales Growth (%) 15% 15
Net Profit 1,419.35 1,650.58 2,324.85 2,686.56 3,041.42 Cost of Goods Sold (%) 87% 87
Interest (%) 4% 4
Forecast balance Sheet Tax Rates (%) 20% 20
Cash and Deposit 5,830.46 5,749.62 7,423.33 5,528.73 6,573.21
Total Assets 26,354.37 29,356.19 34,570.88 43,252.72 49,955.80
Total Liabilities 21,120.39 22,131.86 25,451.64 32,521.54 37,399.77
Shareholder Funds 5,233.98 7,224.33 9,119.24 10,731.18 12,556.03
Forecast Cash Flow
Earning before interest,tax,depreciation and amortization 2,394.95 3,196.82 3,676.35 4,227.80 4,861.97
Operating Cash Flow (7,711.34) 2,635.29 1,264.91 2,021.86 2,354.02
Performance Analysis
Core Ratios
Return on Sales (NPAT/Sales %) 2.76% 3.36% 4.11% 4.13% 4.07% OK
Asset Turnover (Sales/Total Assets) 1.55 1.68 1.64 1.50 1.50 OK
Asset leverage (Total Assets/Equity) 5.28 4.06 3.79 4.03 3.98 worse
Return on Equity (NPAT/Equity %) 22.52% 22.85% 25.49% 25.04% 24.22% OK
Profitability
Gross Profit Margin (Gross Profit / sales %) 12.31% 13.00% 13.00% 13.00% 13.00% OK
Net Operating Profit Margin (Net operating profit/Sales %) 3.23% 4.87% 5.46% 5.46% 5.46% OK
Net Profit before tax Margin (Profit before tax / sales %) 2.76% 4.20% 5.14% 5.16% 5.08% OK
Return on Capital employed (ROCE) 10.20% 16.40% 17.53% 17.32% 17.17% OK
Return on Assets (ROA) 4.99% 8.16% 8.93% 8.21% 8.17% OK
Operating Efficiency
Inventory Days 3.07 2.37 2.37 2.96 2.96 Better
Trade Receivalbe Days 55.09 42.25 42.25 52.81 52.81 OK
Creditors Days 33.33 31.27 31.27 36.48 36.48 Worse
Funding Gap 24.83 13.35 13.35 19.29 19.29 OK
Financial Structure
Current Ratio 1.58 1.72 1.77 1.67 1.68 Better
Quick asset ratio 1.56 1.70 1.75 1.65 1.66 Better
Working Capital 8,164 10,668 13,079 15,285 17,793 Better
Gross Gearing (%) 61.27% 50.52% 48.20% 47.62% 47.19% worse
Solvency 6.90 7.22 10.46 10.46 10.46 OK
Cash Flow Ratios
5.61% 6.50% 6.50% 6.50% 6.50% OK
Net Operating Cash Flow/Sales -7.96% 5.36% 2.24% 3.11% 3.15% Better
Cash Flow before Financing/Sales -14.04% -0.17% -2.84% -1.96% -1.96% OK
00 01 02 04
Forecast balance Sheet
Cash and Deposit 5,830.46 5,749.62 7,423.33 6,573.21
Total Assets 26,354.37 29,356.19 34,570.88 49,955.80
Total Liabilities 21,120.39 22,131.86 25,451.64 37,399.77
Shareholder Funds 5,233.98 7,224.33 9,119.24 12,556.03
00 01 02 03 04
Forecast Cash Flow
Earning before interest,tax,depreciation and amortization 2,394.95 3,196.82 3,676.35 4,227.80 4,861.97
Operating Cash Flow (7,711.34) 2,635.29 1,264.91 2,021.86 2,354.02
Performance Analysis
Funding Gap 18
00 01 02 03 04 Action
Funding Gap 24.826 13.350 13.350 19.293 19.293 OK
00 01 02 03 04
-
10,000.00
20,000.00
30,000.00
40,000.00
50,000.00
60,000.00
70,000.00
80,000.00
-
500.00
1,000.00
1,500.00
2,000.00
2,500.00
3,000.00
3,500.00
Sales Net Profit
00 01 02 04
-
10,000.00
20,000.00
30,000.00
40,000.00
50,000.00
60,000.00
Cash and Deposit Total Assets
Total Liabilities Shareholder Funds
Funding Gap
00 01 02 03 04
0.000
5.000
10.000
15.000
20.000
25.000
30.000
Funding Gap
00 01 02 03 04
(10,000.00)
(8,000.00)
(6,000.00)
(4,000.00)
(2,000.00)
-
2,000.00
4,000.00
6,000.00
Earning before interest,tax,depreciation and amortization Operating Cash Flow
Main Menu
Inputs
Forecast
00 01 02 03 04
Actual Forecast Forecast Forecast Forecast
Initial Sales 42,766.88 49,181.91 56,559.20 65,043.08 74,799.54
Sales Growth 4% 15% 15% 15% 15%
Cost of Goods Sold / Sales 87.70% 87% 87% 87% 87%
Depreciation Rates 19.10% 15% 15% 15% 15%
SG&A/sales 6.70% 6.50% 6.50% 6.50% 6.50%
Interes Paid on Debt 2.30% 4% 4% 4% 4%
Interest Earned on Cash - 2% 2% 2% 2%
Exceptionals/sales - - - -
Marginal tax rate - 20% 20% 20% 20%
Dividend payout ratio 35.60% 40% 40% 40% 40%
Net Fixed Asset/sales 12.50% 8% 8% 8% 8%
Intangibles/sales - - - -
Current assets/sales 52.20% 40% 40% 50% 50%
current liabilities/sales 32.20% 30% 30% 35% 35%
Debt/sales 20.20% 15% 15% 15% 15%
Deferred tax/sales - - - - -
New Equity - 1,000 500 - -
Net Fixed Assets 5,345.86 3,934.55 4,524.74 5,203.45 5,983.96
Debt 8,293.00 7,377.29 8,483.88 9,756.46 11,219.93
Current Assets 22,324.31 19,672.76 22,623.68 32,521.54 37,399.77
Current Liabilities 13,770.94 14,754.57 16,967.76 22,765.08 26,179.84
Main Menu
FORECAST INCOME STATEMENTS
00 01 02 03 04
Actual Forecast Forecast Forecast Forecast
Sales 42,766.88 49,181.91 56,559.20 65,043.08 74,799.54
Cost of Goods Sold 37,506.55 42,788.26 49,206.50 56,587.48 65,075.60
Gross Profit 5,260.33 6,393.65 7,352.70 8,455.60 9,723.94
Depreciation- manufacturer 848.26 801.88 590.18 678.71 780.52
- Amortization / Others - - - - -
Sales,General and Administration over heads 2,865.38 3,196.82 3,676.35 4,227.80 4,861.97
Net Operating profit 1,546.68 2,394.95 3,086.16 3,549.09 4,081.45
Interest Expense 127.33 331.72 295.09 339.36 390.26
Interest Income - - 114.99 148.47 110.57
Other Financial Income - - - - -
Profit after Financial item 1,419.35 2,063.23 2,906.07 3,358.20 3,801.77
Exceptional Expense - - - - -
Profit before Tax 1,419.35 2,063.23 2,906.07 3,358.20 3,801.77
Tax - 412.65 581.21 671.64 760.35
Net Profit after Tax 1,419.35 1,650.58 2,324.85 2,686.56 3,041.42
Dividend 505.29 660.23 929.94 1,074.62 1,216.57
Retained profit for the year 914.06 990.35 1,394.91 1,611.94 1,824.85
Main Menu
FORECAST BALANCE SHEET
00 01 02 03 04
Actual Forecast Forecast Forecast Forecast
Cash and Deposit 5,830.46 5,749.62 7,423.33 5,528.73 6,573.21
Marketable securities - - - - -
Trade Receivables (Debtors) 4,949.30 5,692.88 6,546.81 9,411.04 10,822.69
Inventory 241.57 277.86 319.54 459.33 528.23
Sundry Assets 11,912.35 13,702.03 15,757.34 22,651.17 26,048.85
Current Assets 22,933.68 25,422.39 30,047.01 38,050.27 43,972.98
Land and Building 1,091.04 1,254.70 1,442.91 1,659.34 1,908.24
Plant and Machinery 3,626.35 4,170.30 4,795.85 5,515.22 6,342.51
Depreciation 1,296.70 1,491.20 1,714.88 1,972.11 2,267.93
Net Property, Plant and Equipment 3,420.70 3,933.80 4,523.87 5,202.45 5,982.82
Other Investments - - - - -
Intangibles / Goodwill - - - - -
Non Current Assets 3,420.70 3,933.80 4,523.87 5,202.45 5,982.82
Total Assets 26,354.37 29,356.19 34,570.88 43,252.72 49,955.80
Short Term Bank Loan - - - - -
Trade Creditors 3,186.87 3,665.66 4,215.51 5,655.81 6,504.19
Other Creditors 2,479.48 2,851.99 3,279.79 4,400.39 5,060.45
Other Current Liabilities 7,161.04 8,236.92 9,472.45 12,708.87 14,615.21
Current Liabilities 12,827.39 14,754.57 16,967.76 22,765.08 26,179.84
long term Bank Loan 8,293.00 7,377.29 8,483.88 9,756.46 11,219.93
Deferred TaxLiability - - - - -
Long Term Liabilities 8,293.00 7,377.29 8,483.88 9,756.46 11,219.93
Ordinary Shares 2,000.00 3,000.00 3,500.00 3,500.00 3,500.00
Retained Profit 3,233.98 4,224.33 5,619.24 7,231.18 9,056.03
Shareholder Funds 5,233.98 7,224.33 9,119.24 10,731.18 12,556.03
Total Liabilities and Equity 26,354.37 29,356.19 34,570.88 43,252.72 49,955.80
- - - - -
Main Menu
FORECAST CASH FLOW
00 01 02 03 04
Actual Forecast Forecast Forecast Forecast
Net Operating Profit 1,546.68 2,394.95 3,086.16 3,549.09 4,081.45
Depreciation / Amortization 848.26 801.88 590.18 678.71 780.52
Earning before interest , tax, Depreciation and Amortization 2,394.95 3,196.82 3,676.35 4,227.80 4,861.97
Change in current asset (22,933.68) (2,488.71) (4,624.62) (8,003.26) (5,922.71)
Change in current Liabilities 12,827.39 1,927.18 2,213.19 5,797.32 3,414.76
Net Operating Cash flow (7,711.34) 2,635.29 1,264.91 2,021.86 2,354.02
Retrun on Investment and servicing from finance
Interest received - - 114.99 148.47 110.57
interest expense (127.33) (331.72) (295.09) (339.36) (390.26)
dividends (505.29) (660.23) (929.94) (1,074.62) (1,216.57)
Net Cash from retuen on investments (632.62) (991.95) (1,110.04) (1,265.51) (1,496.25)
Taxation
Taxation - (412.65) (581.21) (671.64) (760.35)
deferred Tax - - - - -
Net cash from tax - (412.65) (581.21) (671.64) (760.35)
Investment Activities
Expenditure on Fixed Asset (4,268.96) (1,314.98) (1,180.25) (1,357.29) (1,560.88)
Expenditure on Long term investments - - - - -
Marketable Securities - - - - -
Net Cash from investment activities (4,268.96) (1,314.98) (1,180.25) (1,357.29) (1,560.88)
Exceptional items - - - - -
Net Cash flow before financing activities (12,612.92) (84.29) (1,606.59) (1,272.58) (1,463.47)
Financing Activities
Long term Loan 8,293.00 (915.71) 1,106.59 1,272.58 1,463.47
Share Capital 2,000.00 1,000.00 500.00 - -
Net Cash from financing activities 10,293.00 84.29 1,606.59 1,272.58 1,463.47
Cash and cash equivalent during the year (2,319.92) 0.00 (0.00) 0.00 (0.00)
Cash and Deaposit at beginning of the year 5,830.46 5,749.62 7,423.33 5,528.73
Cash and Deposit at the end of the year 5,830.46 5,749.62 7,423.33 5,528.73
Main Menu
FORECAST FINANCIAL RATIOS
99 00 01 02 03 04 Action
Actual Actual Forecast Forecast Forecast Forecast Forecast
Core Ratios
Return on Sales 5.90% 2.76% 3.36% 4.11% 4.13% 4.07% OK
Asset Turnover 1.86 1.55 1.68 1.64 1.50 1.50 OK
Asset leverage 4.81 5.28 4.06 3.79 4.03 3.98 worse
Return on Equity 52.80% 22.52% 22.85% 25.49% 25.04% 24.22% OK
Profitability
Gross Profit Margin 14.11% 12.31% 13.00% 13.00% 13.00% 13.00% OK
Net Operating Profit Margin 6.60% 3.23% 4.87% 5.46% 5.46% 5.46% OK
Net Profit before tax Margin 5.90% 2.76% 4.20% 5.14% 5.16% 5.08% OK
Return on Capital employed 26.95% 10.20% 16.40% 17.53% 17.32% 17.17% OK
Return on Assets 12.29% 4.99% 8.16% 8.93% 8.21% 8.17% OK
Operating Efficiency
Inventory Days 3.99 3.07 2.37 2.37 2.96 2.96 Better
Ttade Receivalbe Days 35.97 55.09 42.25 42.25 52.81 52.81 OK
Creditors Days 37.46 33.33 31.27 31.27 36.48 36.48 Worse
Funding Gap 2.50 24.83 13.35 13.35 19.29 19.29 OK
Financial Structure
Current Ratio 1.20 1.58 1.72 1.77 1.67 1.68 Better
Quick asset ratio 1.17 1.56 1.70 1.75 1.65 1.66 Better
Working Capital 2,363 8,164 10,668 13,079 15,285 17,793 Better
Gross Gearing 55.13% 61.27% 50.52% 48.20% 47.62% 47.19% worse
Solvency 9.42 6.90 7.22 10.46 10.46 10.46 OK
Cash Flow Ratios
EBITDA/Sales 9.21% 5.61% 6.50% 6.50% 6.50% 6.50% OK
Net Operating Cash Flow/Sales 0.31% -7.96% 5.36% 2.24% 3.11% 3.15% Better
Cash Flow before Financing/Sales 2.65% -14.04% -0.17% -2.84% -1.96% -1.96% OK
Assumption
Action can be calculated by the comparision of three years performance if forecast year performance (01) improved by the preceding two
years than performance is "Better", if forecast year performance (01) is improved as compared to either of preceding years than perforamce
is "OK" , if forecast year performance (01) is fallen as compared to preceding two years than performance is "worst"

More Related Content

What's hot

Tata chemicals
Tata chemicalsTata chemicals
Tata chemicalsArpita D
 
Accounting Analysis Paper
Accounting Analysis Paper Accounting Analysis Paper
Accounting Analysis Paper Writers Per Hour
 
$ANF Valuation Model
$ANF Valuation Model$ANF Valuation Model
$ANF Valuation ModelLindsay Meyer
 
Williams sonoma model
Williams sonoma model Williams sonoma model
Williams sonoma model Trishala Rasya
 
Wipro – Ratio Analysis
Wipro – Ratio AnalysisWipro – Ratio Analysis
Wipro – Ratio AnalysisJitendra
 
Tata Motors – Ratio Analysis
Tata Motors – Ratio AnalysisTata Motors – Ratio Analysis
Tata Motors – Ratio AnalysisJitendra
 
The Coca-Cola Company - Financial Analysis and Projections
The Coca-Cola Company - Financial Analysis and ProjectionsThe Coca-Cola Company - Financial Analysis and Projections
The Coca-Cola Company - Financial Analysis and ProjectionsRaeann Bailey
 
THE GAP PRESENTATION
THE GAP PRESENTATIONTHE GAP PRESENTATION
THE GAP PRESENTATIONRicky Ying
 
Balance sheet of Bajaj auto limited
Balance sheet of Bajaj auto limitedBalance sheet of Bajaj auto limited
Balance sheet of Bajaj auto limitedNirmal Shanmugam
 
Trend Analysis Of Balance Sheet Of Apple Company
Trend Analysis Of Balance Sheet Of Apple CompanyTrend Analysis Of Balance Sheet Of Apple Company
Trend Analysis Of Balance Sheet Of Apple Companysunnychhutani28
 
Muthengi mike bamburi financial model - enhancement
Muthengi mike   bamburi financial model - enhancementMuthengi mike   bamburi financial model - enhancement
Muthengi mike bamburi financial model - enhancementMike Muthengi
 
InKnowVision June 2012 HNW Technical Webinar 2 - Valuation Planning
InKnowVision June 2012 HNW Technical Webinar 2 - Valuation PlanningInKnowVision June 2012 HNW Technical Webinar 2 - Valuation Planning
InKnowVision June 2012 HNW Technical Webinar 2 - Valuation PlanningInKnowVision
 
Financial Ratio Analysis PowerPoint Presentation Slides
Financial Ratio Analysis PowerPoint Presentation SlidesFinancial Ratio Analysis PowerPoint Presentation Slides
Financial Ratio Analysis PowerPoint Presentation SlidesSlideTeam
 
Financial Accounting Common Sizing Analysis Report
Financial Accounting Common Sizing Analysis ReportFinancial Accounting Common Sizing Analysis Report
Financial Accounting Common Sizing Analysis ReportNicholas Espinosa
 
Financial Annual Report Common Size
Financial Annual Report Common SizeFinancial Annual Report Common Size
Financial Annual Report Common SizeTaylor Wiley
 
Resort Investment Analysis Medical Spa
Resort Investment Analysis   Medical SpaResort Investment Analysis   Medical Spa
Resort Investment Analysis Medical SpaRuss Blumenthal
 

What's hot (20)

Tata chemicals
Tata chemicalsTata chemicals
Tata chemicals
 
Accounting Analysis Paper
Accounting Analysis Paper Accounting Analysis Paper
Accounting Analysis Paper
 
UAC annual report 2018
UAC annual report 2018UAC annual report 2018
UAC annual report 2018
 
$ANF Valuation Model
$ANF Valuation Model$ANF Valuation Model
$ANF Valuation Model
 
Williams sonoma model
Williams sonoma model Williams sonoma model
Williams sonoma model
 
Wipro – Ratio Analysis
Wipro – Ratio AnalysisWipro – Ratio Analysis
Wipro – Ratio Analysis
 
Tata Motors – Ratio Analysis
Tata Motors – Ratio AnalysisTata Motors – Ratio Analysis
Tata Motors – Ratio Analysis
 
The Coca-Cola Company - Financial Analysis and Projections
The Coca-Cola Company - Financial Analysis and ProjectionsThe Coca-Cola Company - Financial Analysis and Projections
The Coca-Cola Company - Financial Analysis and Projections
 
ratio analysis assignment
ratio analysis assignmentratio analysis assignment
ratio analysis assignment
 
bpcl and hpcl
bpcl and hpclbpcl and hpcl
bpcl and hpcl
 
THE GAP PRESENTATION
THE GAP PRESENTATIONTHE GAP PRESENTATION
THE GAP PRESENTATION
 
Balance sheet of Bajaj auto limited
Balance sheet of Bajaj auto limitedBalance sheet of Bajaj auto limited
Balance sheet of Bajaj auto limited
 
Trend Analysis Of Balance Sheet Of Apple Company
Trend Analysis Of Balance Sheet Of Apple CompanyTrend Analysis Of Balance Sheet Of Apple Company
Trend Analysis Of Balance Sheet Of Apple Company
 
Muthengi mike bamburi financial model - enhancement
Muthengi mike   bamburi financial model - enhancementMuthengi mike   bamburi financial model - enhancement
Muthengi mike bamburi financial model - enhancement
 
InKnowVision June 2012 HNW Technical Webinar 2 - Valuation Planning
InKnowVision June 2012 HNW Technical Webinar 2 - Valuation PlanningInKnowVision June 2012 HNW Technical Webinar 2 - Valuation Planning
InKnowVision June 2012 HNW Technical Webinar 2 - Valuation Planning
 
Financial Ratio Analysis PowerPoint Presentation Slides
Financial Ratio Analysis PowerPoint Presentation SlidesFinancial Ratio Analysis PowerPoint Presentation Slides
Financial Ratio Analysis PowerPoint Presentation Slides
 
Financial Accounting Common Sizing Analysis Report
Financial Accounting Common Sizing Analysis ReportFinancial Accounting Common Sizing Analysis Report
Financial Accounting Common Sizing Analysis Report
 
Financial Annual Report Common Size
Financial Annual Report Common SizeFinancial Annual Report Common Size
Financial Annual Report Common Size
 
Resort Investment Analysis Medical Spa
Resort Investment Analysis   Medical SpaResort Investment Analysis   Medical Spa
Resort Investment Analysis Medical Spa
 
GMED
GMEDGMED
GMED
 

Viewers also liked

công ty thiết kế video quảng cáo tốt nhất
công ty thiết kế video quảng cáo tốt nhấtcông ty thiết kế video quảng cáo tốt nhất
công ty thiết kế video quảng cáo tốt nhấtnathaniel569
 
Interactive session thyroid 22-5-15
Interactive session thyroid 22-5-15Interactive session thyroid 22-5-15
Interactive session thyroid 22-5-15drlsudarshanreddy
 
william shakespeare
william shakespearewilliam shakespeare
william shakespeareSumit Kumar
 
Sky Foundation Technology Co,Ltd
Sky Foundation Technology Co,LtdSky Foundation Technology Co,Ltd
Sky Foundation Technology Co,LtdSusan Liu
 
Licenses kazakhstan
Licenses kazakhstanLicenses kazakhstan
Licenses kazakhstanIncom
 
5 Steps to Meal Prep
5 Steps to Meal Prep5 Steps to Meal Prep
5 Steps to Meal PrepTerri DeVore
 
Cuban Cuisine & Cooking - Gather.com : Gather.com
Cuban Cuisine & Cooking - Gather.com : Gather.comCuban Cuisine & Cooking - Gather.com : Gather.com
Cuban Cuisine & Cooking - Gather.com : Gather.comfestiveschedule00
 
06. Пачатак выкарыстання металаў на беларускіх землях
06. Пачатак выкарыстання металаў на беларускіх землях06. Пачатак выкарыстання металаў на беларускіх землях
06. Пачатак выкарыстання металаў на беларускіх земляхAnastasiyaF
 

Viewers also liked (15)

my resume
my resumemy resume
my resume
 
Nic Doran Resume
Nic Doran ResumeNic Doran Resume
Nic Doran Resume
 
công ty thiết kế video quảng cáo tốt nhất
công ty thiết kế video quảng cáo tốt nhấtcông ty thiết kế video quảng cáo tốt nhất
công ty thiết kế video quảng cáo tốt nhất
 
Dstu b v.2 6-10-96
Dstu b v.2 6-10-96Dstu b v.2 6-10-96
Dstu b v.2 6-10-96
 
Interactive session thyroid 22-5-15
Interactive session thyroid 22-5-15Interactive session thyroid 22-5-15
Interactive session thyroid 22-5-15
 
Dstu b v.2 7-92-99
Dstu b v.2 7-92-99Dstu b v.2 7-92-99
Dstu b v.2 7-92-99
 
william shakespeare
william shakespearewilliam shakespeare
william shakespeare
 
Sky Foundation Technology Co,Ltd
Sky Foundation Technology Co,LtdSky Foundation Technology Co,Ltd
Sky Foundation Technology Co,Ltd
 
Dywergencje
Dywergencje Dywergencje
Dywergencje
 
Licenses kazakhstan
Licenses kazakhstanLicenses kazakhstan
Licenses kazakhstan
 
الفجر 228
الفجر 228الفجر 228
الفجر 228
 
5 Steps to Meal Prep
5 Steps to Meal Prep5 Steps to Meal Prep
5 Steps to Meal Prep
 
Work at Callison
Work at CallisonWork at Callison
Work at Callison
 
Cuban Cuisine & Cooking - Gather.com : Gather.com
Cuban Cuisine & Cooking - Gather.com : Gather.comCuban Cuisine & Cooking - Gather.com : Gather.com
Cuban Cuisine & Cooking - Gather.com : Gather.com
 
06. Пачатак выкарыстання металаў на беларускіх землях
06. Пачатак выкарыстання металаў на беларускіх землях06. Пачатак выкарыстання металаў на беларускіх землях
06. Пачатак выкарыстання металаў на беларускіх землях
 

Similar to Forcast Model

Neslte India Ltd_Financial Model Working.pdf
Neslte India Ltd_Financial Model Working.pdfNeslte India Ltd_Financial Model Working.pdf
Neslte India Ltd_Financial Model Working.pdfDeepakKumar234566
 
ration analysis of wipro
ration analysis of wiproration analysis of wipro
ration analysis of wiproMayank Singhal
 
Name Date Targe.docx
Name                                         Date  Targe.docxName                                         Date  Targe.docx
Name Date Targe.docxroushhsiu
 
Name Date Targe.docx
Name                                         Date  Targe.docxName                                         Date  Targe.docx
Name Date Targe.docxgemaherd
 
Name Date Targe.docx
Name                                         Date  Targe.docxName                                         Date  Targe.docx
Name Date Targe.docxdohertyjoetta
 
Yes bank balance sheet
Yes bank balance sheetYes bank balance sheet
Yes bank balance sheetAnujsingh11841
 
Nordnet's report presentation, January-September 2015
Nordnet's report presentation, January-September 2015Nordnet's report presentation, January-September 2015
Nordnet's report presentation, January-September 2015Nordnet
 
Fm assignment-update-final
Fm assignment-update-finalFm assignment-update-final
Fm assignment-update-finalMoon Leong
 
Financial Statement Analysis - HUM TV
Financial Statement Analysis - HUM TVFinancial Statement Analysis - HUM TV
Financial Statement Analysis - HUM TVZoya Farooq
 
Balance sheet projection
Balance sheet projectionBalance sheet projection
Balance sheet projectionPRACHI NAVGHARE
 
Analysis of Intelligent Reasoning Systems--copy
Analysis of Intelligent Reasoning Systems--copyAnalysis of Intelligent Reasoning Systems--copy
Analysis of Intelligent Reasoning Systems--copyJohn J Frederick Jr
 

Similar to Forcast Model (20)

Neslte India Ltd_Financial Model Working.pdf
Neslte India Ltd_Financial Model Working.pdfNeslte India Ltd_Financial Model Working.pdf
Neslte India Ltd_Financial Model Working.pdf
 
Security analysis
Security analysisSecurity analysis
Security analysis
 
UAC annual report 2017
UAC annual report 2017UAC annual report 2017
UAC annual report 2017
 
ration analysis of wipro
ration analysis of wiproration analysis of wipro
ration analysis of wipro
 
Name Date Targe.docx
Name                                         Date  Targe.docxName                                         Date  Targe.docx
Name Date Targe.docx
 
Name Date Targe.docx
Name                                         Date  Targe.docxName                                         Date  Targe.docx
Name Date Targe.docx
 
Name Date Targe.docx
Name                                         Date  Targe.docxName                                         Date  Targe.docx
Name Date Targe.docx
 
Name Date Targe.docx
Name                                         Date  Targe.docxName                                         Date  Targe.docx
Name Date Targe.docx
 
BHARTI AIRTEL PPT
BHARTI AIRTEL PPTBHARTI AIRTEL PPT
BHARTI AIRTEL PPT
 
Yes bank balance sheet
Yes bank balance sheetYes bank balance sheet
Yes bank balance sheet
 
Nordnet's report presentation, January-September 2015
Nordnet's report presentation, January-September 2015Nordnet's report presentation, January-September 2015
Nordnet's report presentation, January-September 2015
 
Finance present
Finance presentFinance present
Finance present
 
Fm assignment-update-final
Fm assignment-update-finalFm assignment-update-final
Fm assignment-update-final
 
NFLX-model.pdf
NFLX-model.pdfNFLX-model.pdf
NFLX-model.pdf
 
02. lbo of micron technologies (deb sahoo)
02. lbo of micron technologies (deb sahoo)02. lbo of micron technologies (deb sahoo)
02. lbo of micron technologies (deb sahoo)
 
Financial Statement Analysis - HUM TV
Financial Statement Analysis - HUM TVFinancial Statement Analysis - HUM TV
Financial Statement Analysis - HUM TV
 
Example print out-efm-de
Example print out-efm-deExample print out-efm-de
Example print out-efm-de
 
Balance sheet projection
Balance sheet projectionBalance sheet projection
Balance sheet projection
 
bKash equity valuation 2018
bKash equity valuation 2018bKash equity valuation 2018
bKash equity valuation 2018
 
Analysis of Intelligent Reasoning Systems--copy
Analysis of Intelligent Reasoning Systems--copyAnalysis of Intelligent Reasoning Systems--copy
Analysis of Intelligent Reasoning Systems--copy
 

Forcast Model

  • 1. Company: ABC Model: Forecast Financials and Performance Analysis Years: 5 Years Version: 1.0 Prepared By: Syed Muhammad Ali - ACCA Components: Dash Board Inputs F Income Statement F Balance Sheet F Cash flow F Ratios Legends: INPUTS DROP DOWN LISTS LINKED INPUTS
  • 2. Main Menue DASH Board 00 01 02 03 04 Action Forecast Income Statement Sales 42,766.88 49,181.91 56,559.20 65,043.08 74,799.54 sales Growth (%) 15% 15 Net Profit 1,419.35 1,650.58 2,324.85 2,686.56 3,041.42 Cost of Goods Sold (%) 87% 87 Interest (%) 4% 4 Forecast balance Sheet Tax Rates (%) 20% 20 Cash and Deposit 5,830.46 5,749.62 7,423.33 5,528.73 6,573.21 Total Assets 26,354.37 29,356.19 34,570.88 43,252.72 49,955.80 Total Liabilities 21,120.39 22,131.86 25,451.64 32,521.54 37,399.77 Shareholder Funds 5,233.98 7,224.33 9,119.24 10,731.18 12,556.03 Forecast Cash Flow Earning before interest,tax,depreciation and amortization 2,394.95 3,196.82 3,676.35 4,227.80 4,861.97 Operating Cash Flow (7,711.34) 2,635.29 1,264.91 2,021.86 2,354.02 Performance Analysis Core Ratios Return on Sales (NPAT/Sales %) 2.76% 3.36% 4.11% 4.13% 4.07% OK Asset Turnover (Sales/Total Assets) 1.55 1.68 1.64 1.50 1.50 OK Asset leverage (Total Assets/Equity) 5.28 4.06 3.79 4.03 3.98 worse Return on Equity (NPAT/Equity %) 22.52% 22.85% 25.49% 25.04% 24.22% OK Profitability Gross Profit Margin (Gross Profit / sales %) 12.31% 13.00% 13.00% 13.00% 13.00% OK Net Operating Profit Margin (Net operating profit/Sales %) 3.23% 4.87% 5.46% 5.46% 5.46% OK Net Profit before tax Margin (Profit before tax / sales %) 2.76% 4.20% 5.14% 5.16% 5.08% OK Return on Capital employed (ROCE) 10.20% 16.40% 17.53% 17.32% 17.17% OK Return on Assets (ROA) 4.99% 8.16% 8.93% 8.21% 8.17% OK Operating Efficiency Inventory Days 3.07 2.37 2.37 2.96 2.96 Better Trade Receivalbe Days 55.09 42.25 42.25 52.81 52.81 OK Creditors Days 33.33 31.27 31.27 36.48 36.48 Worse Funding Gap 24.83 13.35 13.35 19.29 19.29 OK Financial Structure Current Ratio 1.58 1.72 1.77 1.67 1.68 Better Quick asset ratio 1.56 1.70 1.75 1.65 1.66 Better Working Capital 8,164 10,668 13,079 15,285 17,793 Better Gross Gearing (%) 61.27% 50.52% 48.20% 47.62% 47.19% worse Solvency 6.90 7.22 10.46 10.46 10.46 OK Cash Flow Ratios 5.61% 6.50% 6.50% 6.50% 6.50% OK Net Operating Cash Flow/Sales -7.96% 5.36% 2.24% 3.11% 3.15% Better Cash Flow before Financing/Sales -14.04% -0.17% -2.84% -1.96% -1.96% OK 00 01 02 04 Forecast balance Sheet Cash and Deposit 5,830.46 5,749.62 7,423.33 6,573.21 Total Assets 26,354.37 29,356.19 34,570.88 49,955.80 Total Liabilities 21,120.39 22,131.86 25,451.64 37,399.77 Shareholder Funds 5,233.98 7,224.33 9,119.24 12,556.03 00 01 02 03 04 Forecast Cash Flow Earning before interest,tax,depreciation and amortization 2,394.95 3,196.82 3,676.35 4,227.80 4,861.97 Operating Cash Flow (7,711.34) 2,635.29 1,264.91 2,021.86 2,354.02 Performance Analysis Funding Gap 18 00 01 02 03 04 Action Funding Gap 24.826 13.350 13.350 19.293 19.293 OK 00 01 02 03 04 - 10,000.00 20,000.00 30,000.00 40,000.00 50,000.00 60,000.00 70,000.00 80,000.00 - 500.00 1,000.00 1,500.00 2,000.00 2,500.00 3,000.00 3,500.00 Sales Net Profit 00 01 02 04 - 10,000.00 20,000.00 30,000.00 40,000.00 50,000.00 60,000.00 Cash and Deposit Total Assets Total Liabilities Shareholder Funds Funding Gap 00 01 02 03 04 0.000 5.000 10.000 15.000 20.000 25.000 30.000 Funding Gap 00 01 02 03 04 (10,000.00) (8,000.00) (6,000.00) (4,000.00) (2,000.00) - 2,000.00 4,000.00 6,000.00 Earning before interest,tax,depreciation and amortization Operating Cash Flow
  • 3. Main Menu Inputs Forecast 00 01 02 03 04 Actual Forecast Forecast Forecast Forecast Initial Sales 42,766.88 49,181.91 56,559.20 65,043.08 74,799.54 Sales Growth 4% 15% 15% 15% 15% Cost of Goods Sold / Sales 87.70% 87% 87% 87% 87% Depreciation Rates 19.10% 15% 15% 15% 15% SG&A/sales 6.70% 6.50% 6.50% 6.50% 6.50% Interes Paid on Debt 2.30% 4% 4% 4% 4% Interest Earned on Cash - 2% 2% 2% 2% Exceptionals/sales - - - - Marginal tax rate - 20% 20% 20% 20% Dividend payout ratio 35.60% 40% 40% 40% 40% Net Fixed Asset/sales 12.50% 8% 8% 8% 8% Intangibles/sales - - - - Current assets/sales 52.20% 40% 40% 50% 50% current liabilities/sales 32.20% 30% 30% 35% 35% Debt/sales 20.20% 15% 15% 15% 15% Deferred tax/sales - - - - - New Equity - 1,000 500 - - Net Fixed Assets 5,345.86 3,934.55 4,524.74 5,203.45 5,983.96 Debt 8,293.00 7,377.29 8,483.88 9,756.46 11,219.93 Current Assets 22,324.31 19,672.76 22,623.68 32,521.54 37,399.77 Current Liabilities 13,770.94 14,754.57 16,967.76 22,765.08 26,179.84
  • 4. Main Menu FORECAST INCOME STATEMENTS 00 01 02 03 04 Actual Forecast Forecast Forecast Forecast Sales 42,766.88 49,181.91 56,559.20 65,043.08 74,799.54 Cost of Goods Sold 37,506.55 42,788.26 49,206.50 56,587.48 65,075.60 Gross Profit 5,260.33 6,393.65 7,352.70 8,455.60 9,723.94 Depreciation- manufacturer 848.26 801.88 590.18 678.71 780.52 - Amortization / Others - - - - - Sales,General and Administration over heads 2,865.38 3,196.82 3,676.35 4,227.80 4,861.97 Net Operating profit 1,546.68 2,394.95 3,086.16 3,549.09 4,081.45 Interest Expense 127.33 331.72 295.09 339.36 390.26 Interest Income - - 114.99 148.47 110.57 Other Financial Income - - - - - Profit after Financial item 1,419.35 2,063.23 2,906.07 3,358.20 3,801.77 Exceptional Expense - - - - - Profit before Tax 1,419.35 2,063.23 2,906.07 3,358.20 3,801.77 Tax - 412.65 581.21 671.64 760.35 Net Profit after Tax 1,419.35 1,650.58 2,324.85 2,686.56 3,041.42 Dividend 505.29 660.23 929.94 1,074.62 1,216.57 Retained profit for the year 914.06 990.35 1,394.91 1,611.94 1,824.85
  • 5. Main Menu FORECAST BALANCE SHEET 00 01 02 03 04 Actual Forecast Forecast Forecast Forecast Cash and Deposit 5,830.46 5,749.62 7,423.33 5,528.73 6,573.21 Marketable securities - - - - - Trade Receivables (Debtors) 4,949.30 5,692.88 6,546.81 9,411.04 10,822.69 Inventory 241.57 277.86 319.54 459.33 528.23 Sundry Assets 11,912.35 13,702.03 15,757.34 22,651.17 26,048.85 Current Assets 22,933.68 25,422.39 30,047.01 38,050.27 43,972.98 Land and Building 1,091.04 1,254.70 1,442.91 1,659.34 1,908.24 Plant and Machinery 3,626.35 4,170.30 4,795.85 5,515.22 6,342.51 Depreciation 1,296.70 1,491.20 1,714.88 1,972.11 2,267.93 Net Property, Plant and Equipment 3,420.70 3,933.80 4,523.87 5,202.45 5,982.82 Other Investments - - - - - Intangibles / Goodwill - - - - - Non Current Assets 3,420.70 3,933.80 4,523.87 5,202.45 5,982.82 Total Assets 26,354.37 29,356.19 34,570.88 43,252.72 49,955.80 Short Term Bank Loan - - - - - Trade Creditors 3,186.87 3,665.66 4,215.51 5,655.81 6,504.19 Other Creditors 2,479.48 2,851.99 3,279.79 4,400.39 5,060.45 Other Current Liabilities 7,161.04 8,236.92 9,472.45 12,708.87 14,615.21 Current Liabilities 12,827.39 14,754.57 16,967.76 22,765.08 26,179.84 long term Bank Loan 8,293.00 7,377.29 8,483.88 9,756.46 11,219.93 Deferred TaxLiability - - - - - Long Term Liabilities 8,293.00 7,377.29 8,483.88 9,756.46 11,219.93 Ordinary Shares 2,000.00 3,000.00 3,500.00 3,500.00 3,500.00 Retained Profit 3,233.98 4,224.33 5,619.24 7,231.18 9,056.03 Shareholder Funds 5,233.98 7,224.33 9,119.24 10,731.18 12,556.03 Total Liabilities and Equity 26,354.37 29,356.19 34,570.88 43,252.72 49,955.80 - - - - -
  • 6. Main Menu FORECAST CASH FLOW 00 01 02 03 04 Actual Forecast Forecast Forecast Forecast Net Operating Profit 1,546.68 2,394.95 3,086.16 3,549.09 4,081.45 Depreciation / Amortization 848.26 801.88 590.18 678.71 780.52 Earning before interest , tax, Depreciation and Amortization 2,394.95 3,196.82 3,676.35 4,227.80 4,861.97 Change in current asset (22,933.68) (2,488.71) (4,624.62) (8,003.26) (5,922.71) Change in current Liabilities 12,827.39 1,927.18 2,213.19 5,797.32 3,414.76 Net Operating Cash flow (7,711.34) 2,635.29 1,264.91 2,021.86 2,354.02 Retrun on Investment and servicing from finance Interest received - - 114.99 148.47 110.57 interest expense (127.33) (331.72) (295.09) (339.36) (390.26) dividends (505.29) (660.23) (929.94) (1,074.62) (1,216.57) Net Cash from retuen on investments (632.62) (991.95) (1,110.04) (1,265.51) (1,496.25) Taxation Taxation - (412.65) (581.21) (671.64) (760.35) deferred Tax - - - - - Net cash from tax - (412.65) (581.21) (671.64) (760.35) Investment Activities Expenditure on Fixed Asset (4,268.96) (1,314.98) (1,180.25) (1,357.29) (1,560.88) Expenditure on Long term investments - - - - - Marketable Securities - - - - - Net Cash from investment activities (4,268.96) (1,314.98) (1,180.25) (1,357.29) (1,560.88) Exceptional items - - - - - Net Cash flow before financing activities (12,612.92) (84.29) (1,606.59) (1,272.58) (1,463.47) Financing Activities Long term Loan 8,293.00 (915.71) 1,106.59 1,272.58 1,463.47 Share Capital 2,000.00 1,000.00 500.00 - - Net Cash from financing activities 10,293.00 84.29 1,606.59 1,272.58 1,463.47 Cash and cash equivalent during the year (2,319.92) 0.00 (0.00) 0.00 (0.00) Cash and Deaposit at beginning of the year 5,830.46 5,749.62 7,423.33 5,528.73 Cash and Deposit at the end of the year 5,830.46 5,749.62 7,423.33 5,528.73
  • 7. Main Menu FORECAST FINANCIAL RATIOS 99 00 01 02 03 04 Action Actual Actual Forecast Forecast Forecast Forecast Forecast Core Ratios Return on Sales 5.90% 2.76% 3.36% 4.11% 4.13% 4.07% OK Asset Turnover 1.86 1.55 1.68 1.64 1.50 1.50 OK Asset leverage 4.81 5.28 4.06 3.79 4.03 3.98 worse Return on Equity 52.80% 22.52% 22.85% 25.49% 25.04% 24.22% OK Profitability Gross Profit Margin 14.11% 12.31% 13.00% 13.00% 13.00% 13.00% OK Net Operating Profit Margin 6.60% 3.23% 4.87% 5.46% 5.46% 5.46% OK Net Profit before tax Margin 5.90% 2.76% 4.20% 5.14% 5.16% 5.08% OK Return on Capital employed 26.95% 10.20% 16.40% 17.53% 17.32% 17.17% OK Return on Assets 12.29% 4.99% 8.16% 8.93% 8.21% 8.17% OK Operating Efficiency Inventory Days 3.99 3.07 2.37 2.37 2.96 2.96 Better Ttade Receivalbe Days 35.97 55.09 42.25 42.25 52.81 52.81 OK Creditors Days 37.46 33.33 31.27 31.27 36.48 36.48 Worse Funding Gap 2.50 24.83 13.35 13.35 19.29 19.29 OK Financial Structure Current Ratio 1.20 1.58 1.72 1.77 1.67 1.68 Better Quick asset ratio 1.17 1.56 1.70 1.75 1.65 1.66 Better Working Capital 2,363 8,164 10,668 13,079 15,285 17,793 Better Gross Gearing 55.13% 61.27% 50.52% 48.20% 47.62% 47.19% worse Solvency 9.42 6.90 7.22 10.46 10.46 10.46 OK Cash Flow Ratios EBITDA/Sales 9.21% 5.61% 6.50% 6.50% 6.50% 6.50% OK Net Operating Cash Flow/Sales 0.31% -7.96% 5.36% 2.24% 3.11% 3.15% Better Cash Flow before Financing/Sales 2.65% -14.04% -0.17% -2.84% -1.96% -1.96% OK Assumption Action can be calculated by the comparision of three years performance if forecast year performance (01) improved by the preceding two years than performance is "Better", if forecast year performance (01) is improved as compared to either of preceding years than perforamce is "OK" , if forecast year performance (01) is fallen as compared to preceding two years than performance is "worst"