Downloaded 2,745 times
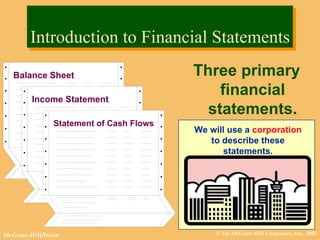
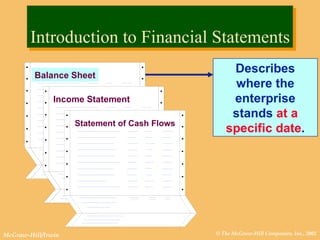
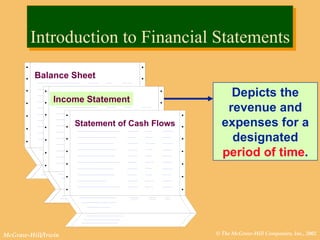
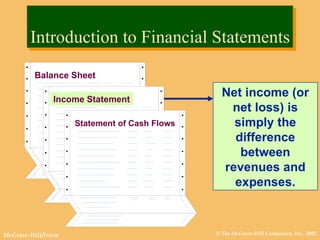
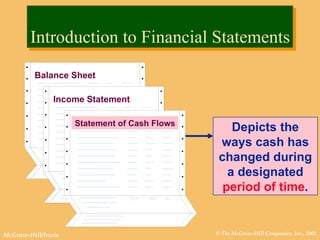
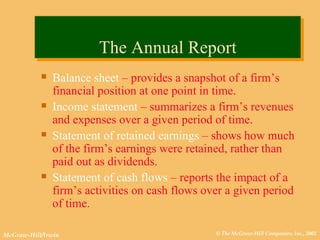
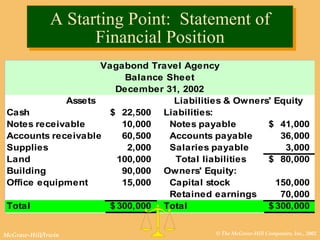
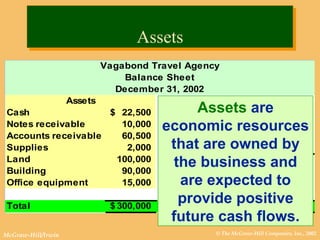
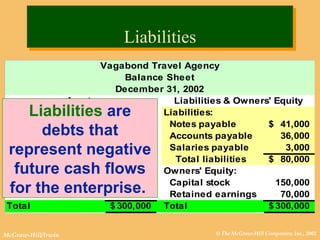
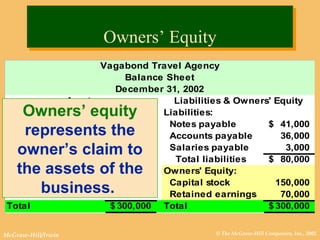
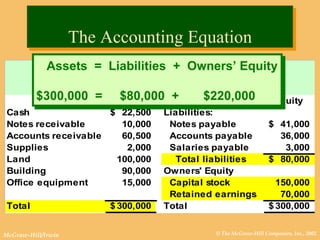
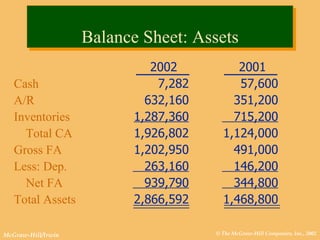
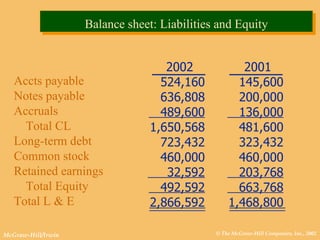
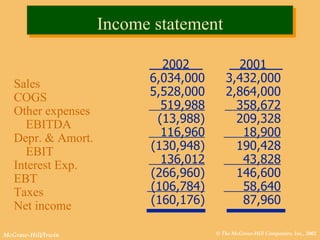
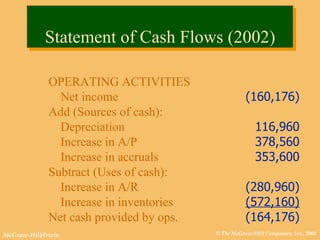

This document discusses key financial statements including the balance sheet, income statement, and statement of cash flows. It provides examples of each statement for a sample company in 2002 and 2001. The balance sheet shows a company's assets, liabilities, and equity at a point in time. The income statement summarizes revenues and expenses over a period of time. The statement of cash flows reports how a company's activities affected cash flow over a given period.


