The document provides 3Q19 financial highlights for JPMorgan Chase & Co. Key points include:
- Net income of $9.1B and EPS of $2.68 for 3Q19. Record managed revenue of $30.1B.
- Strong capital return to shareholders with $9.6B distributed, including $6.7B of net share repurchases.
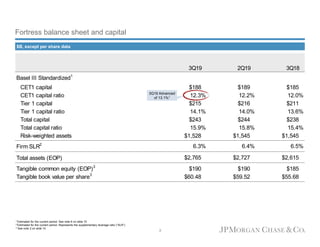
- Basel III CET1 capital of $188B and CET1 ratio of 12.3%.
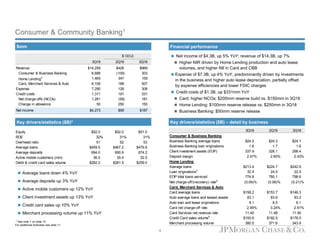
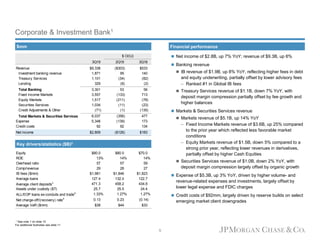
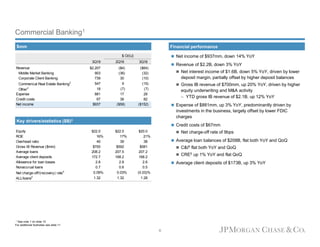
- Business segments all reported net income, with CCB at $4.3B, CIB at $2.8B, CB at $937MM, and AWM at $668MM