Downloaded 608 times
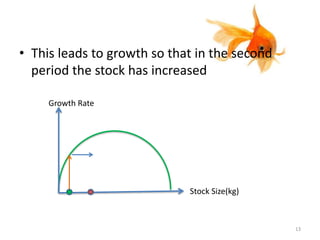
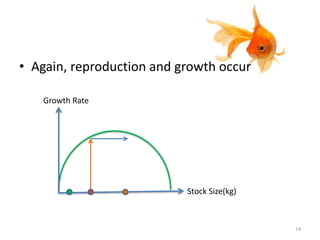
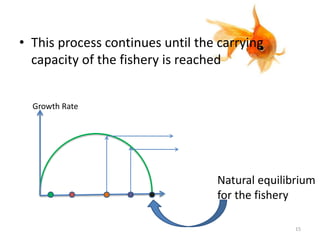
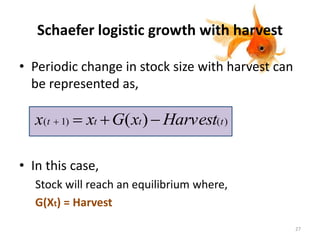
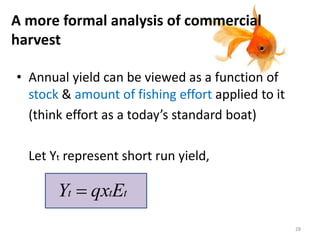
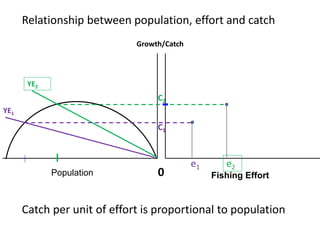
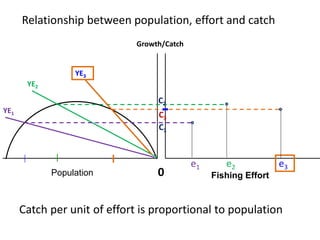
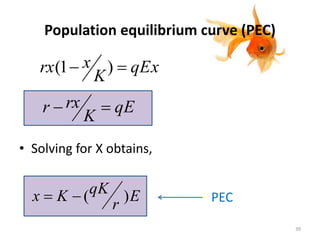
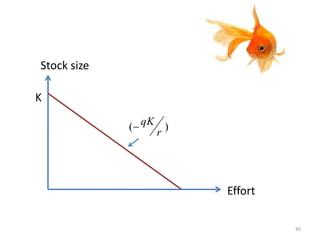

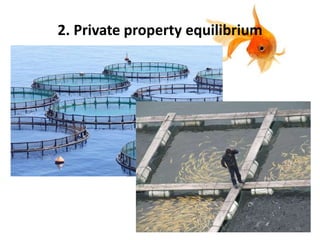
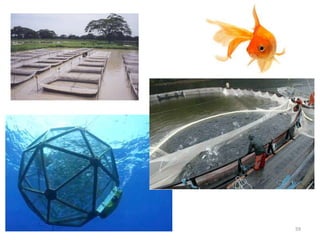
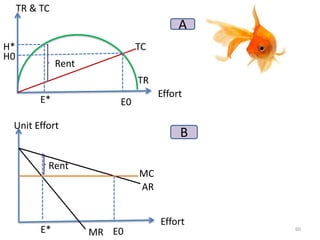
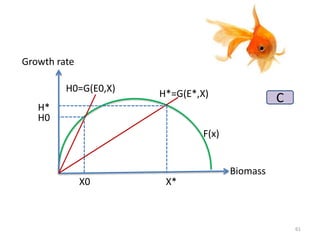


The document provides an extensive overview of fishery economics, including the production, distribution, and consumption of fish and seafood. It discusses essential concepts such as fish biomass, sustainable yield, growth rates, and the impact of fishing effort on fish stocks, as well as the importance of managing fisheries to prevent depletion. Additionally, it touches on equilibrium states in fisheries and the economic aspects of fishing management, such as open access and private property equilibria.


