Download as PPSX, PPTX
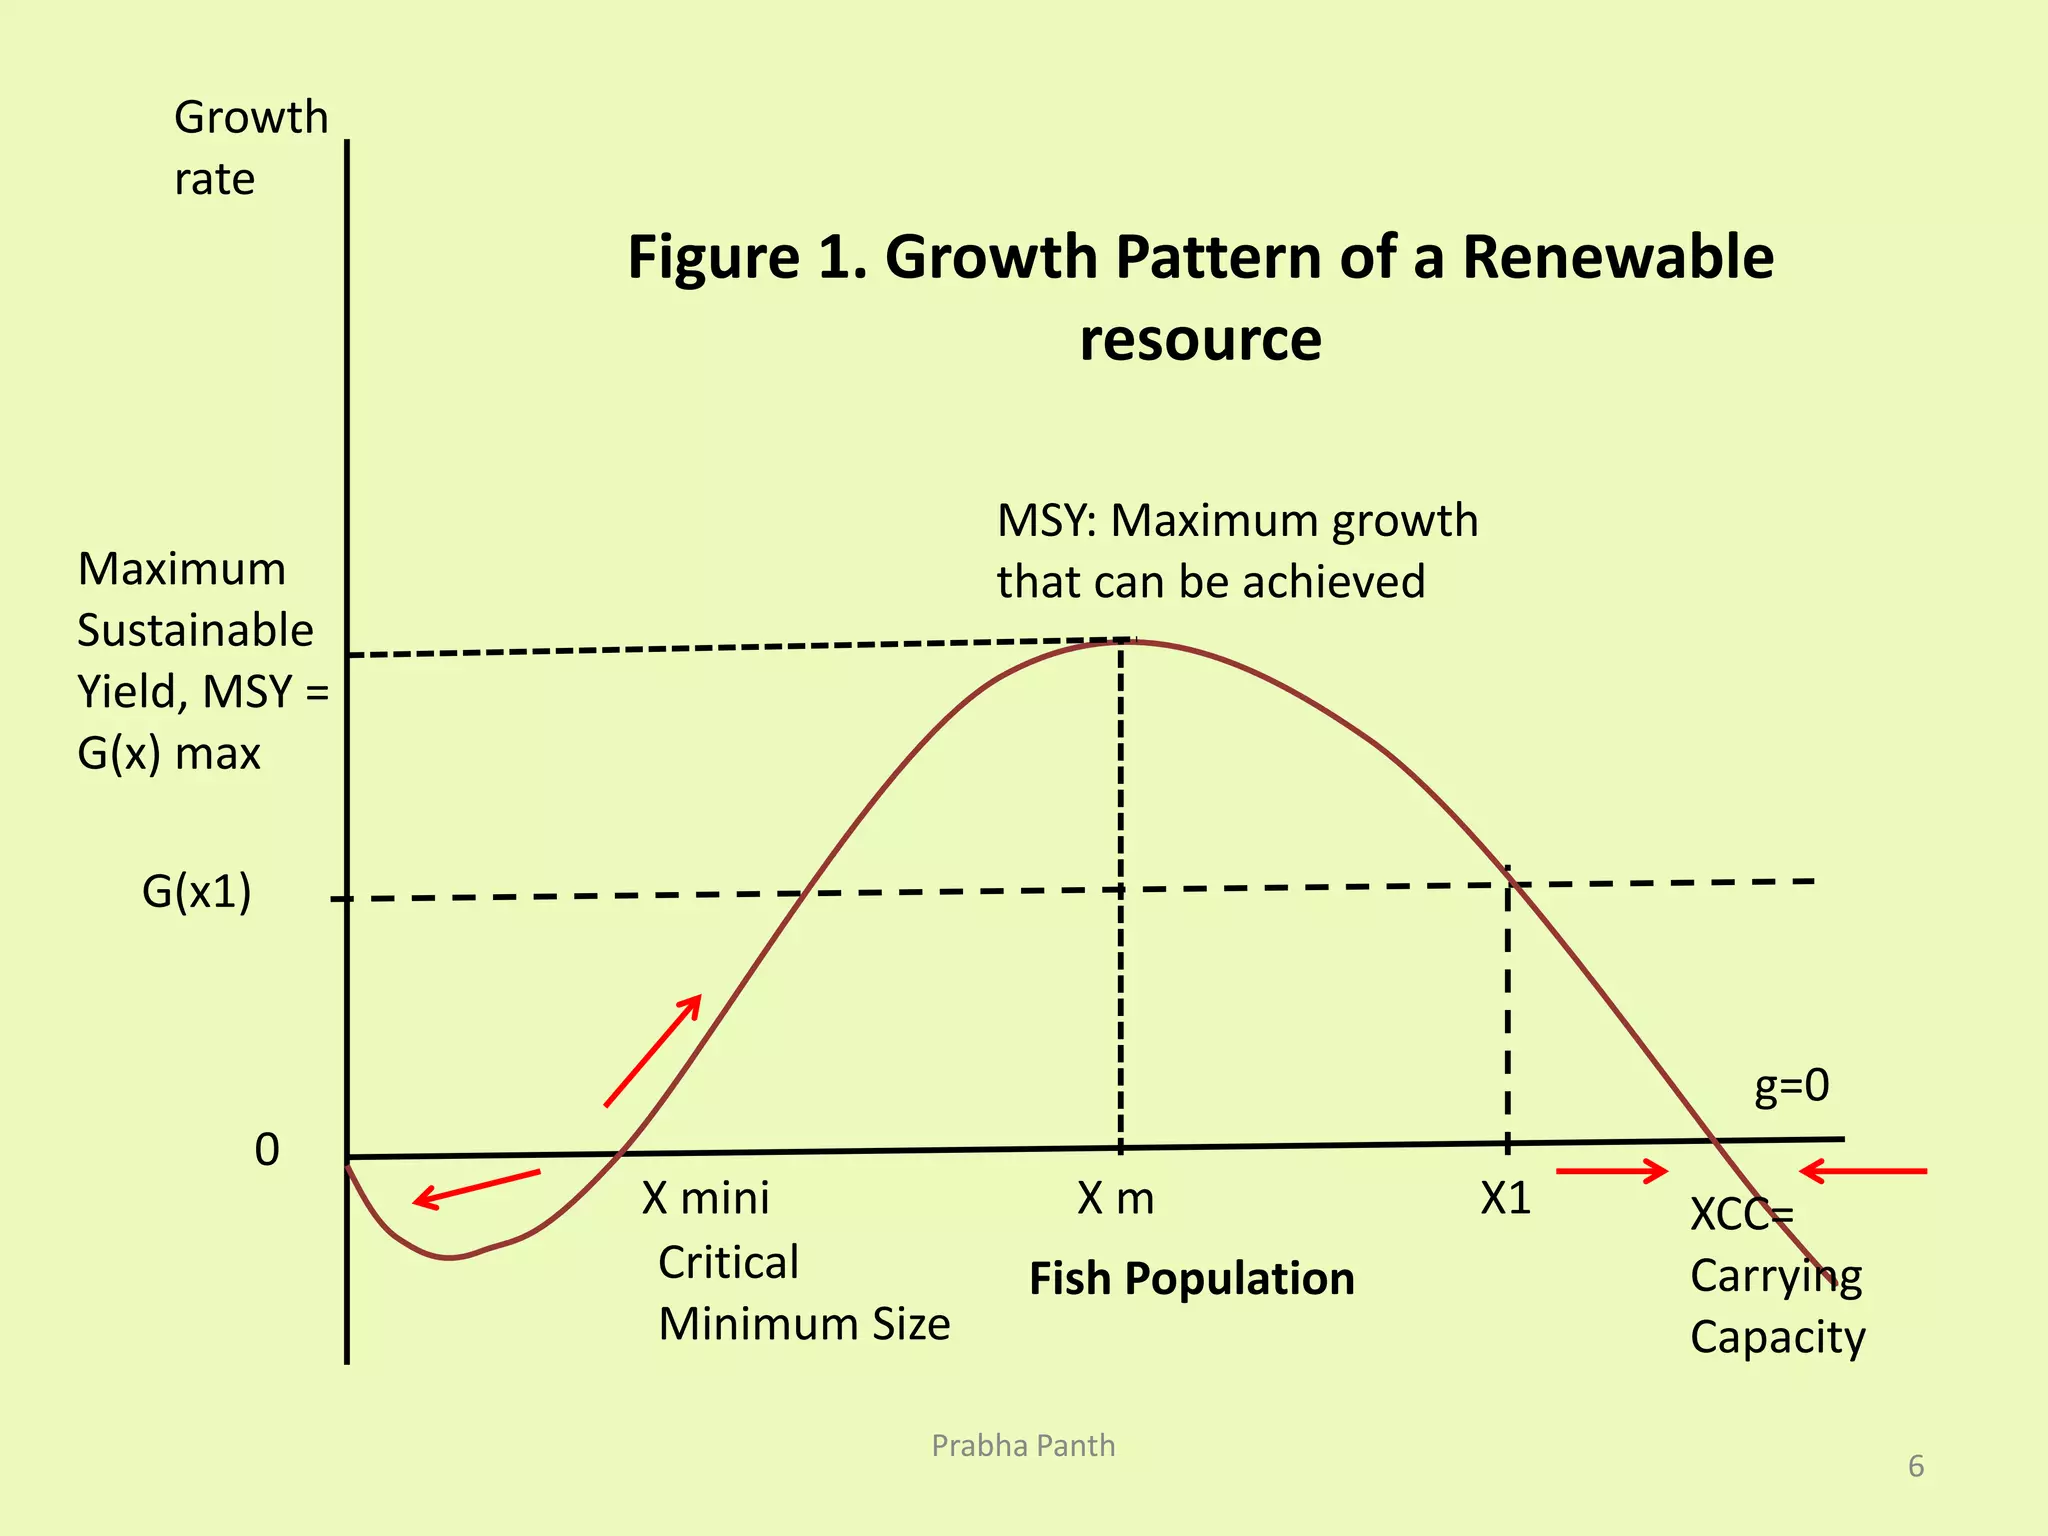
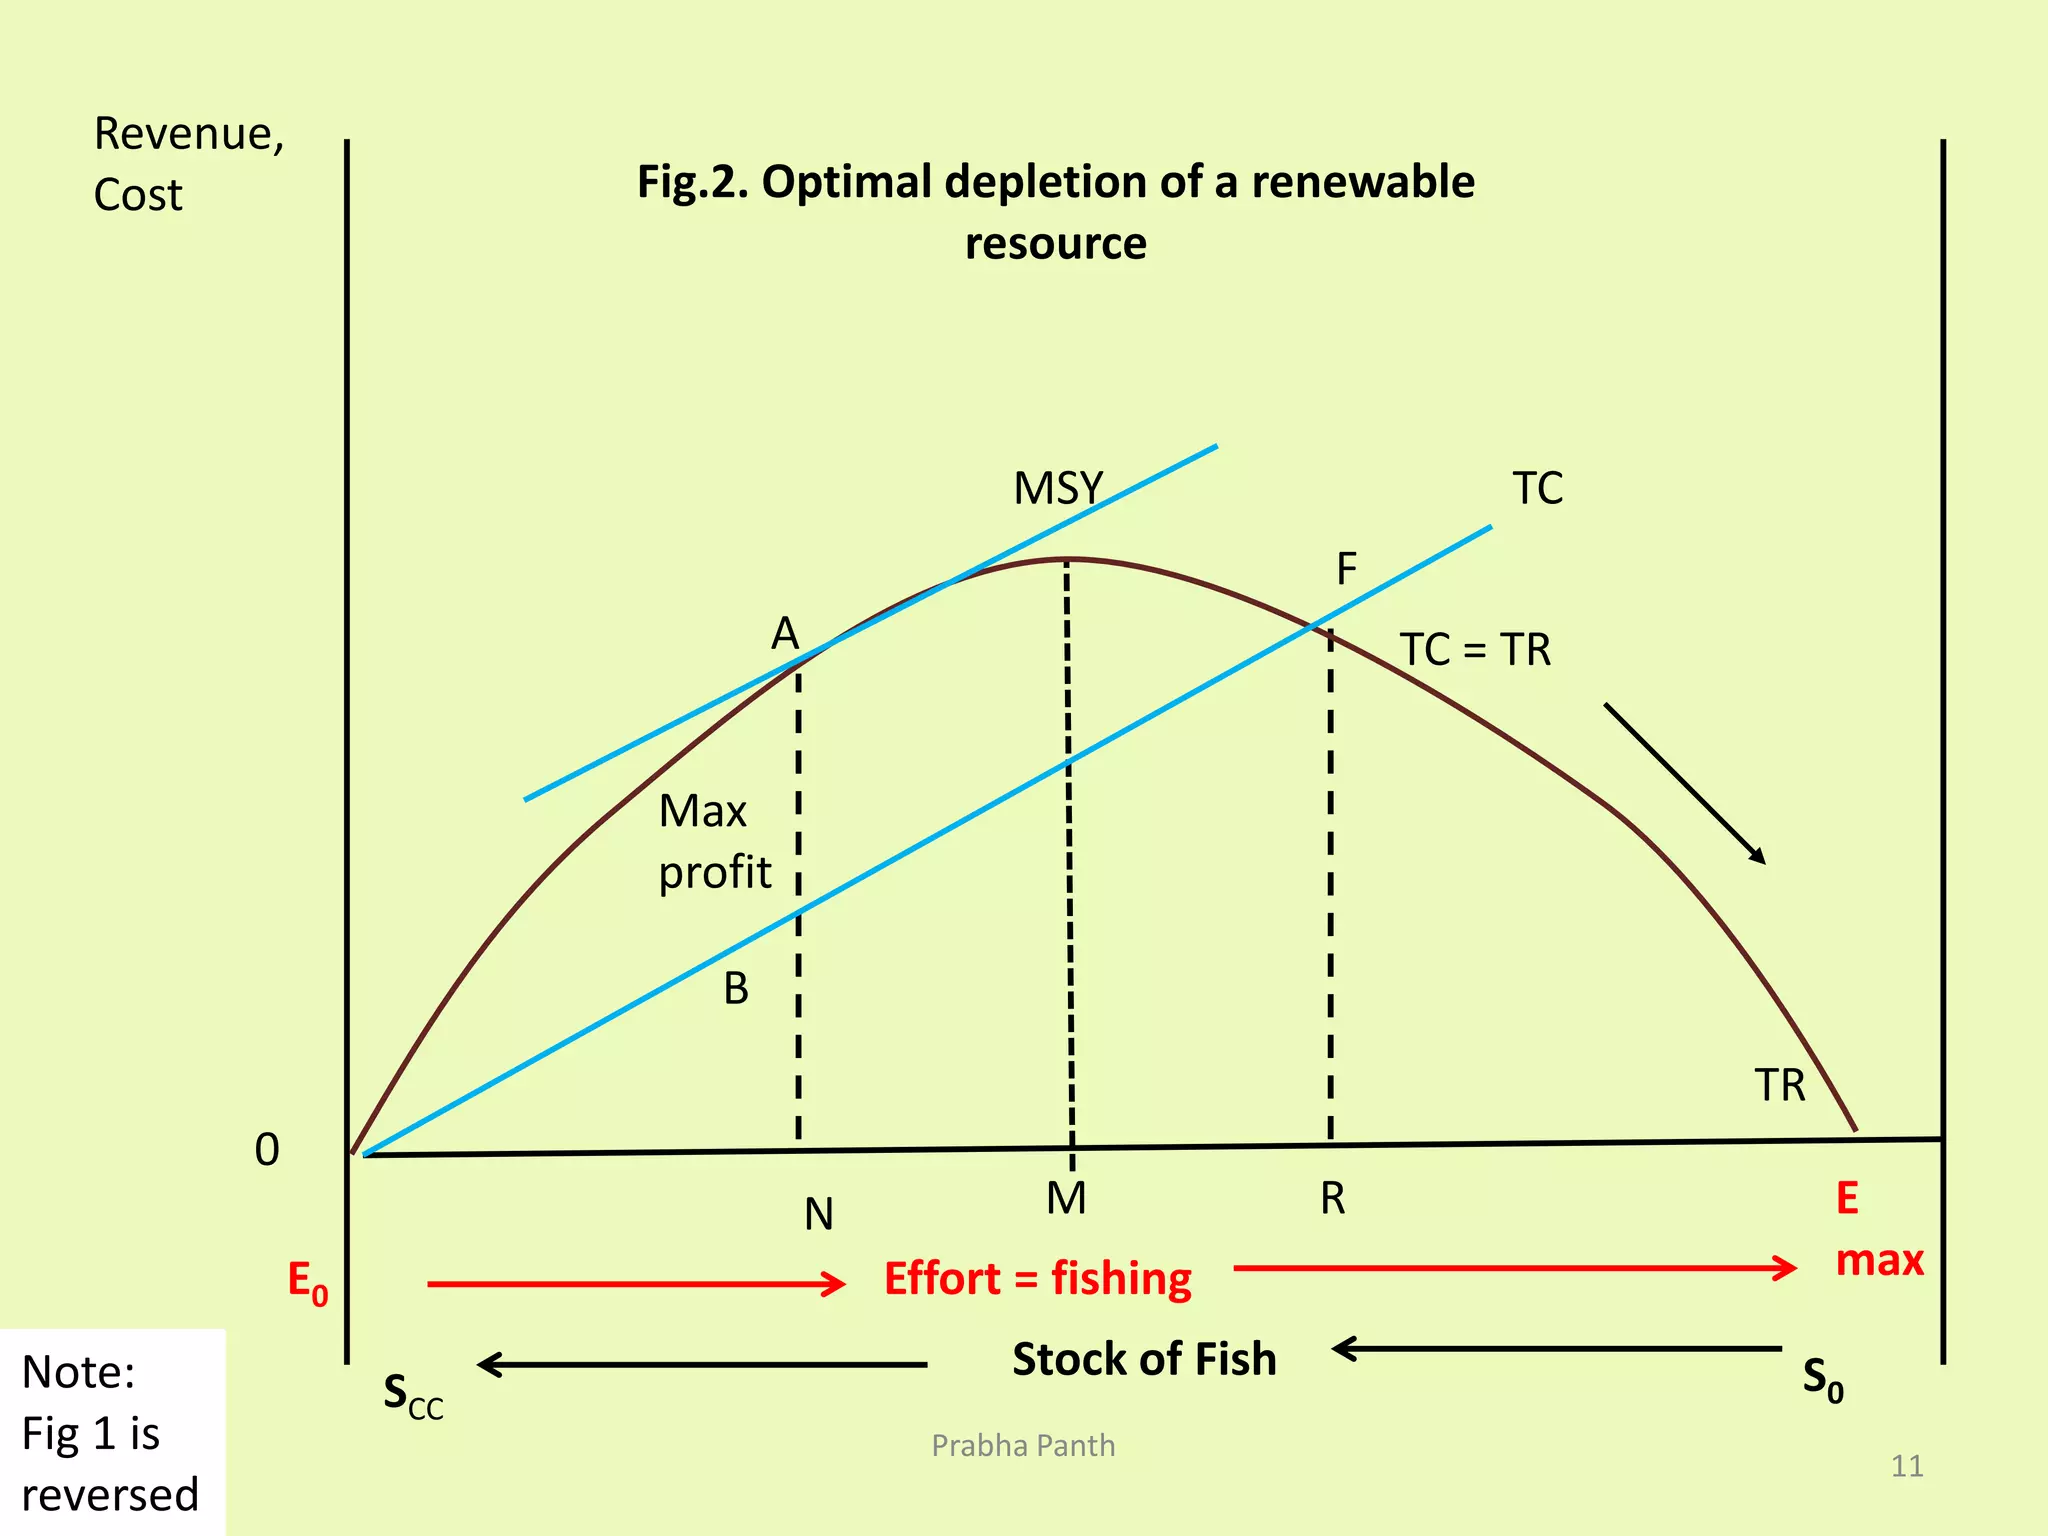
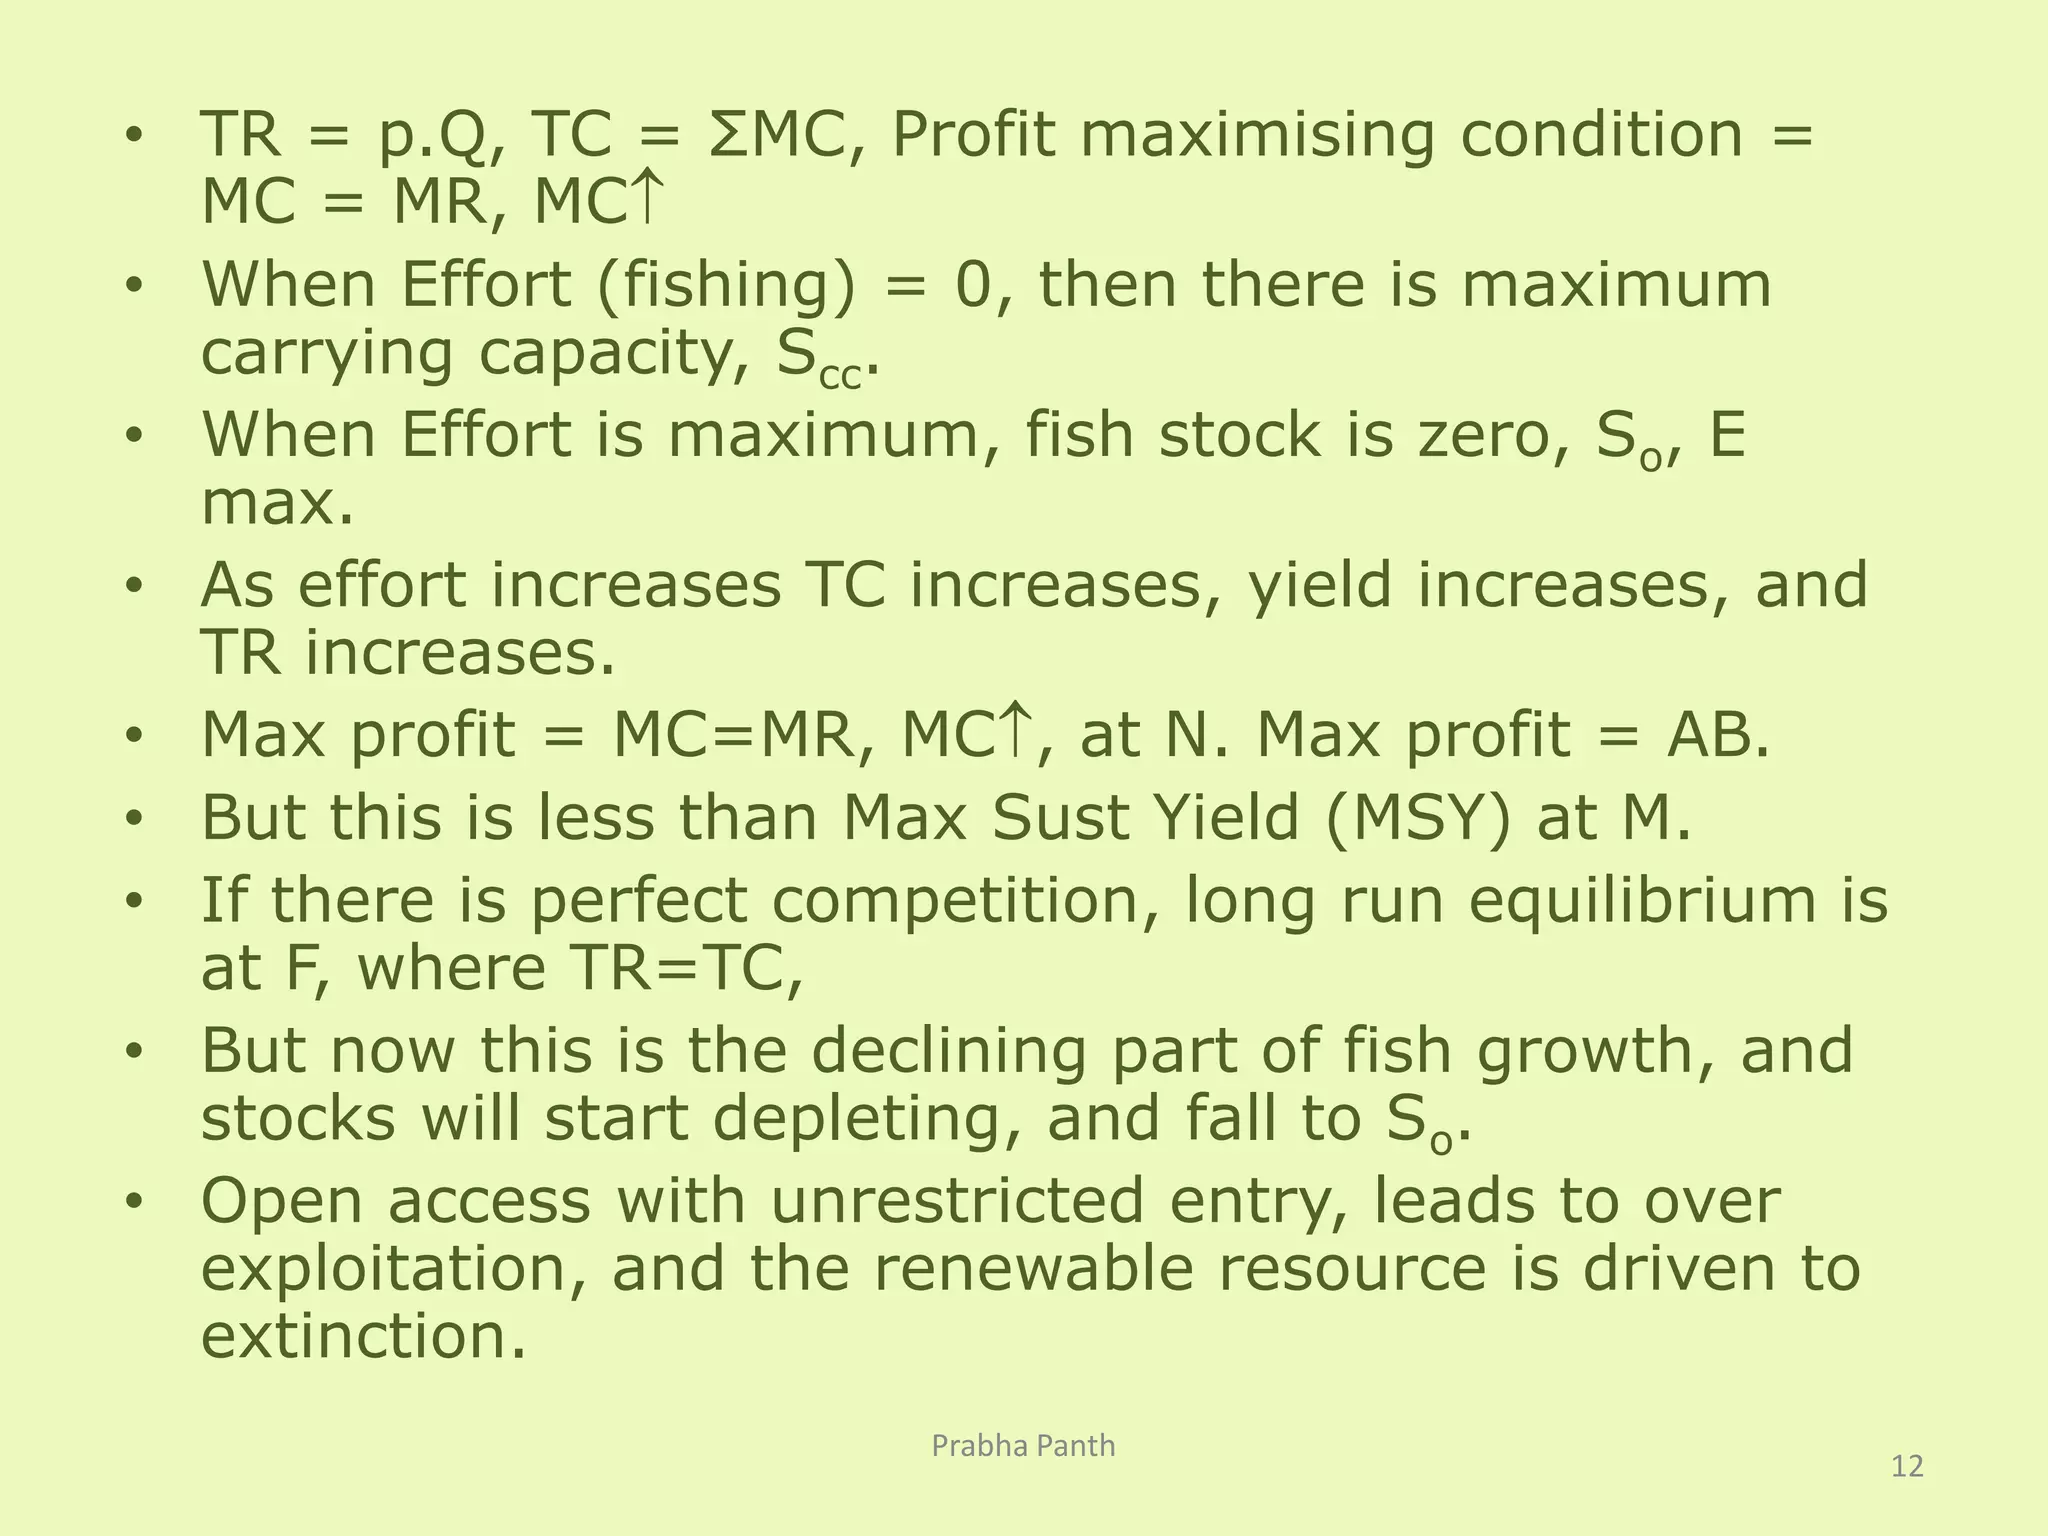
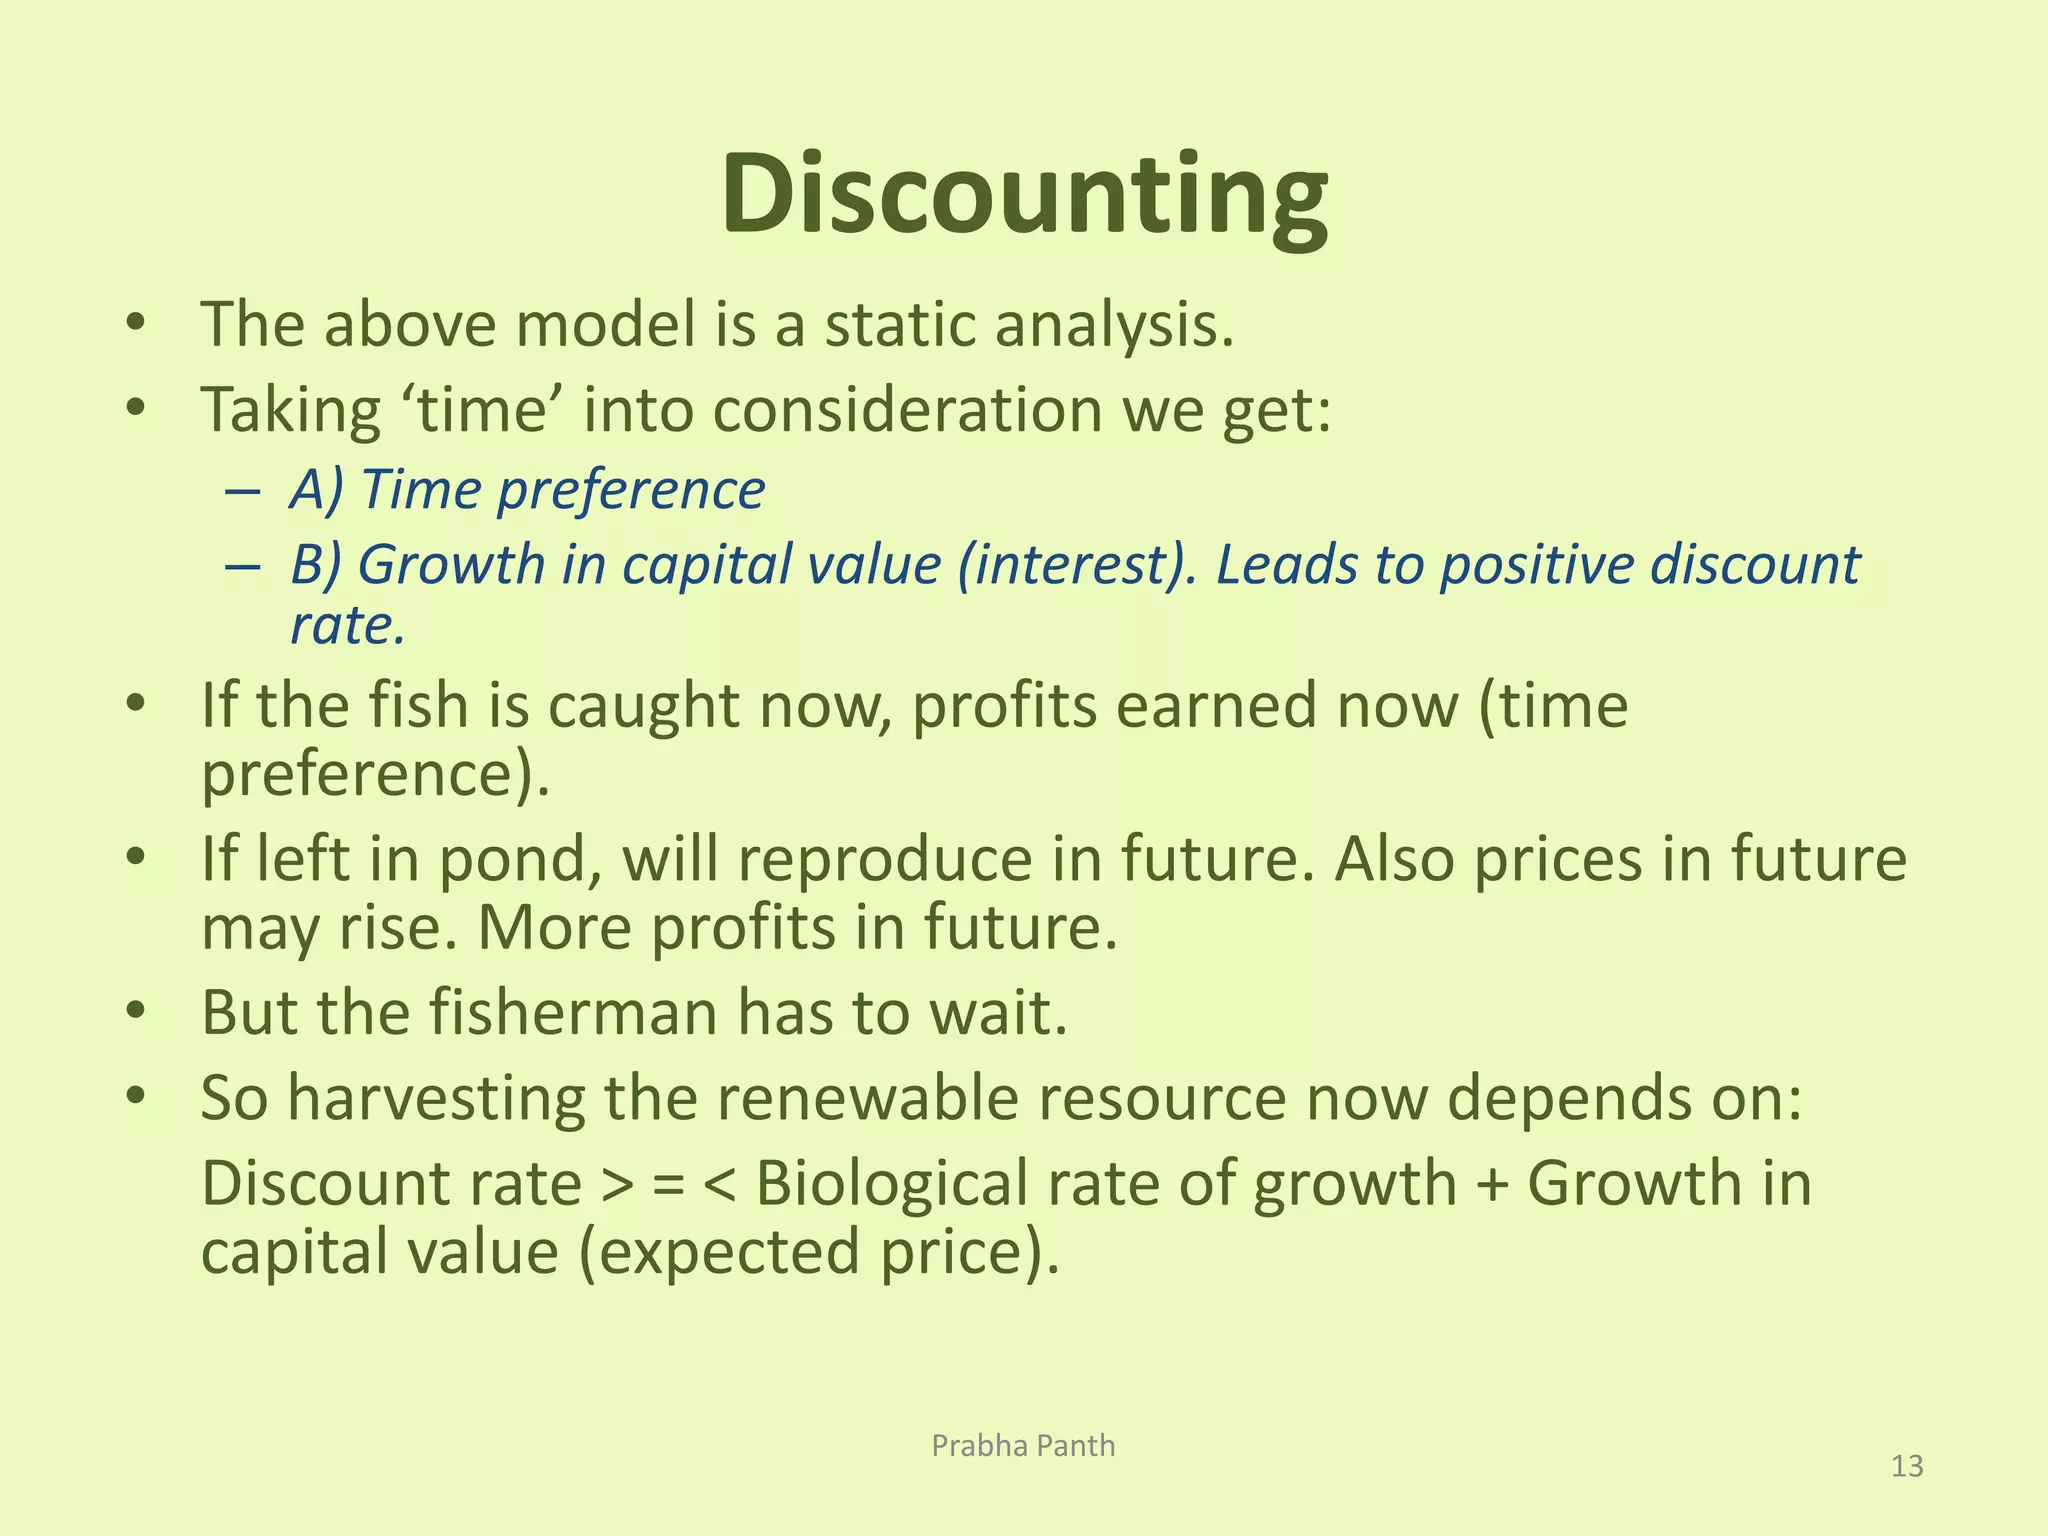
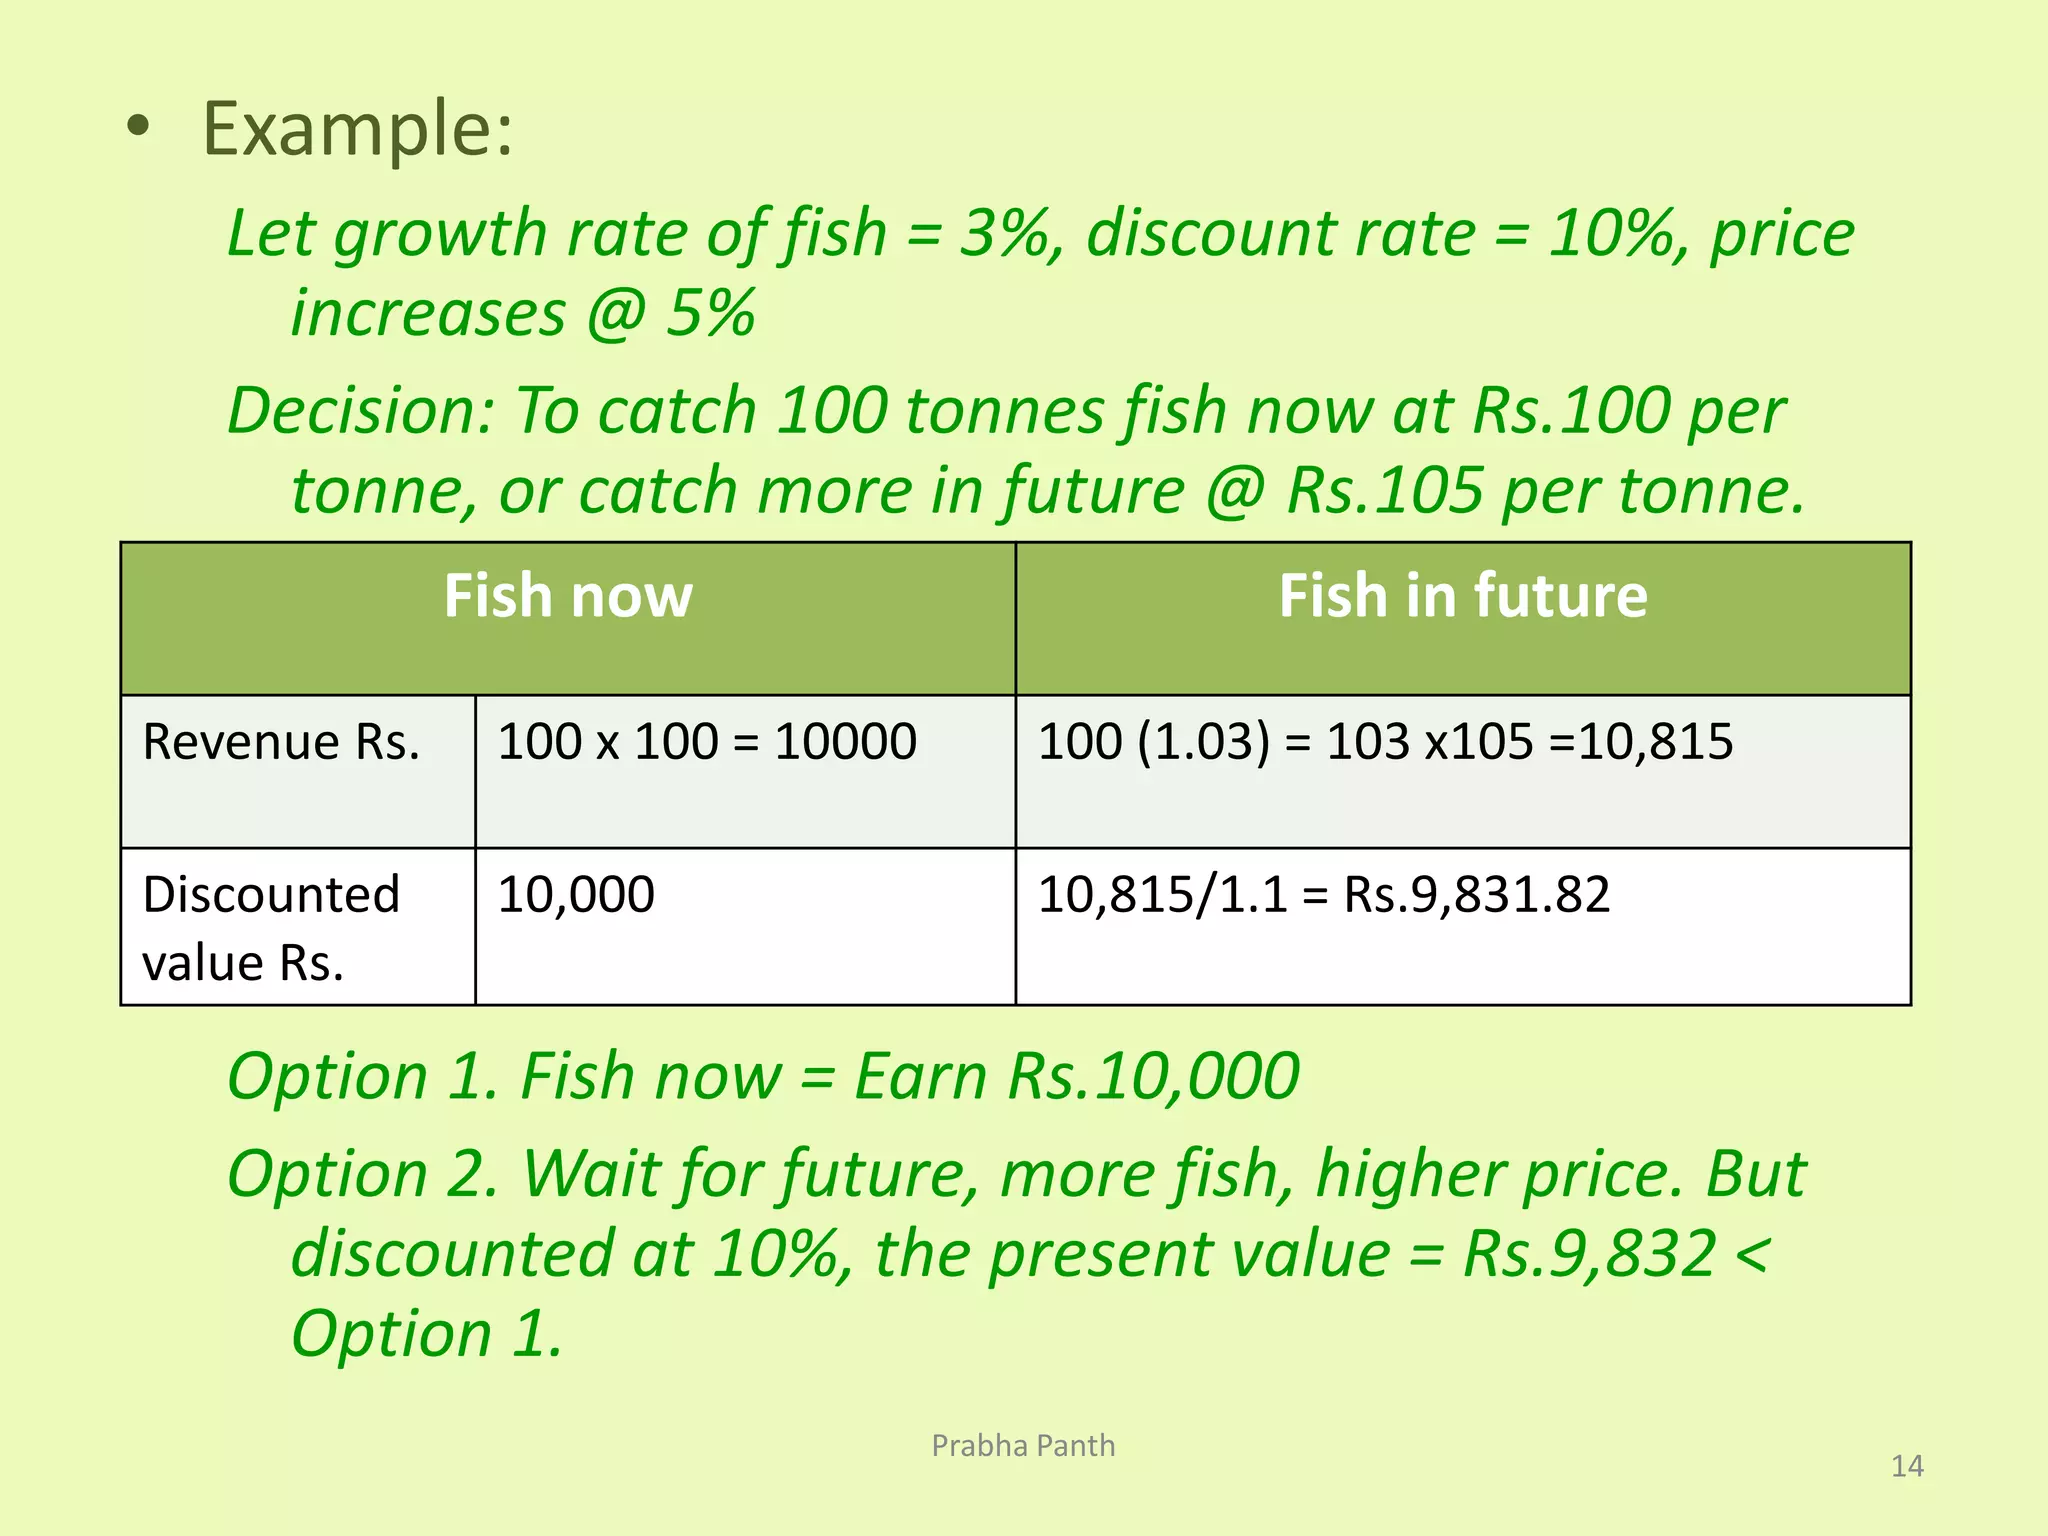
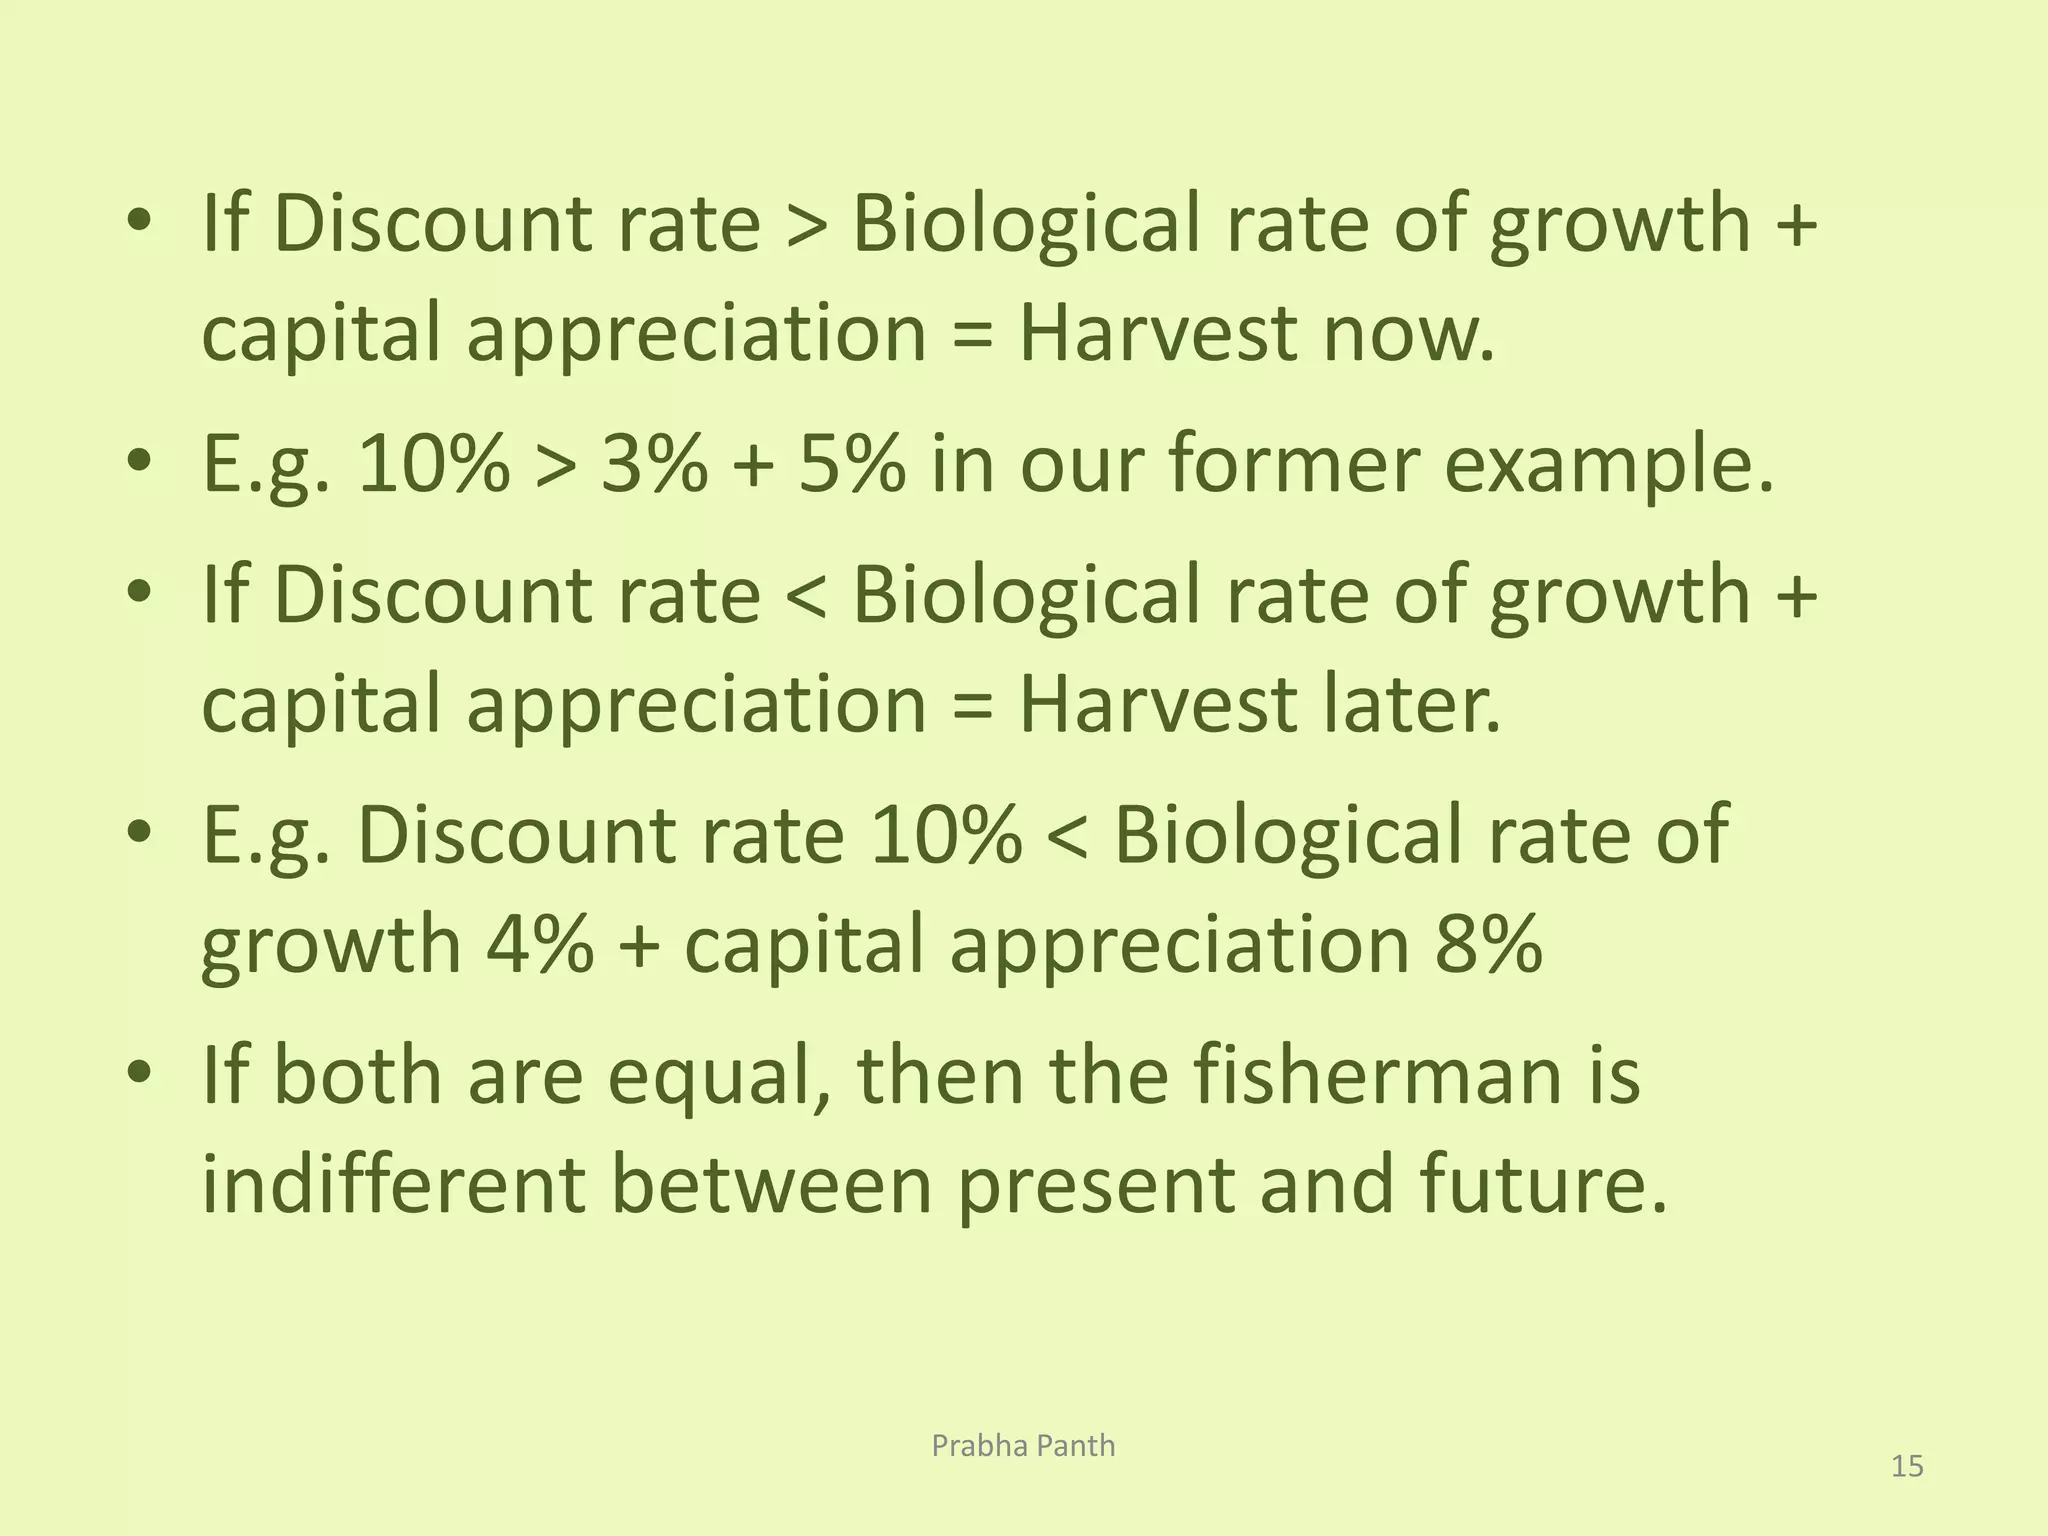
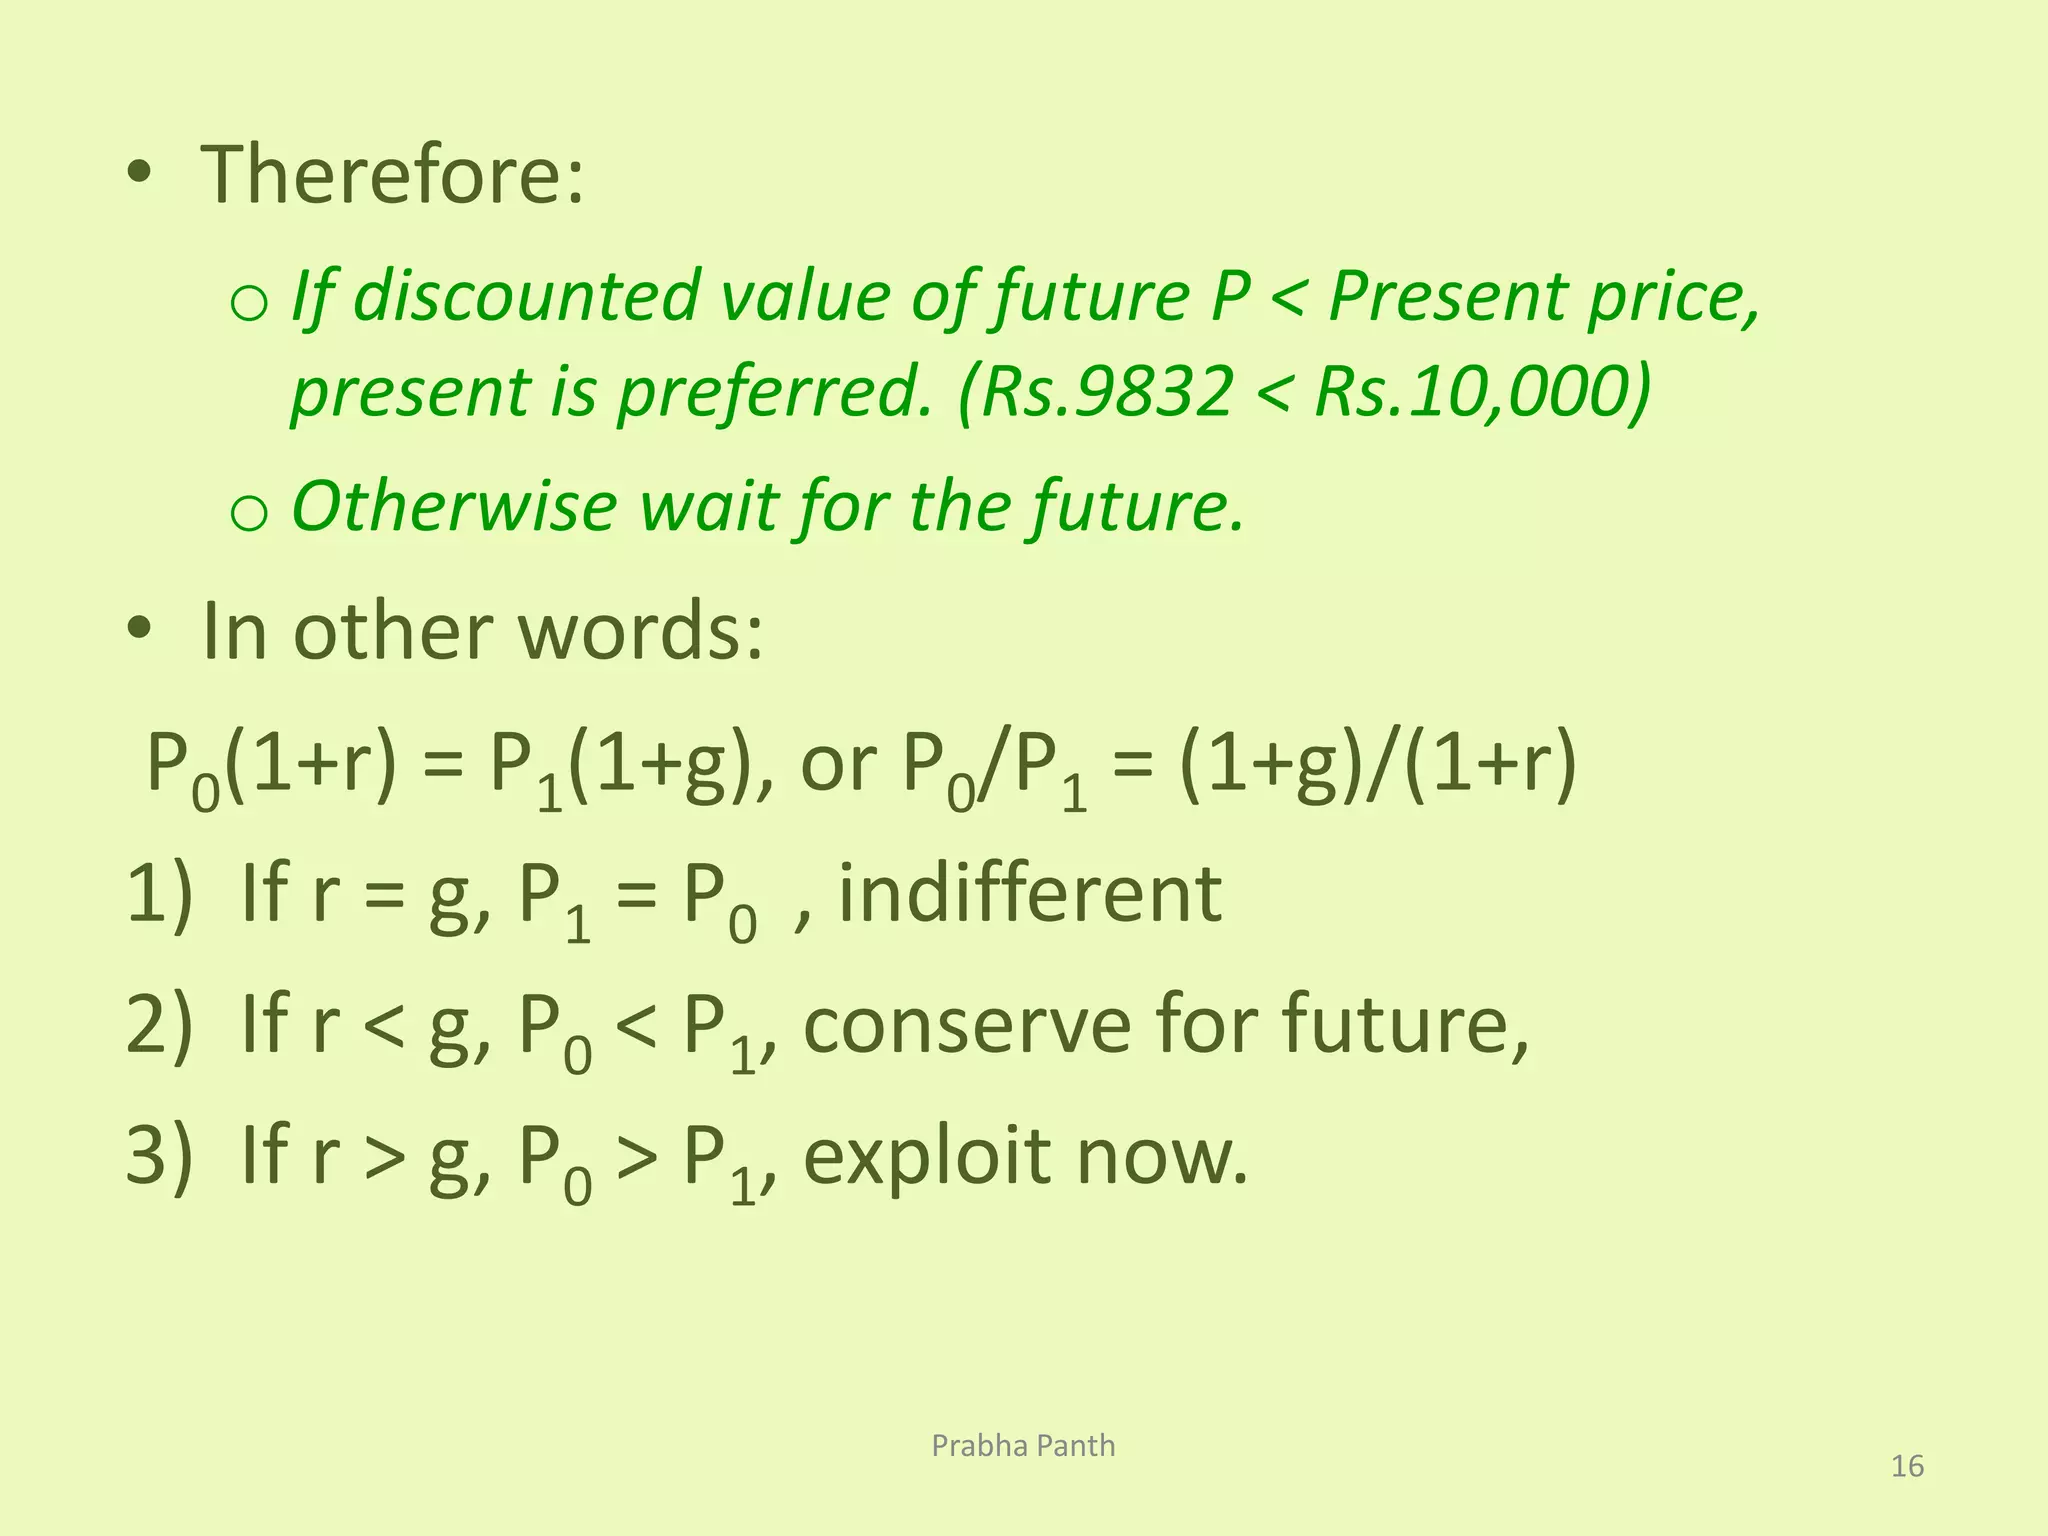
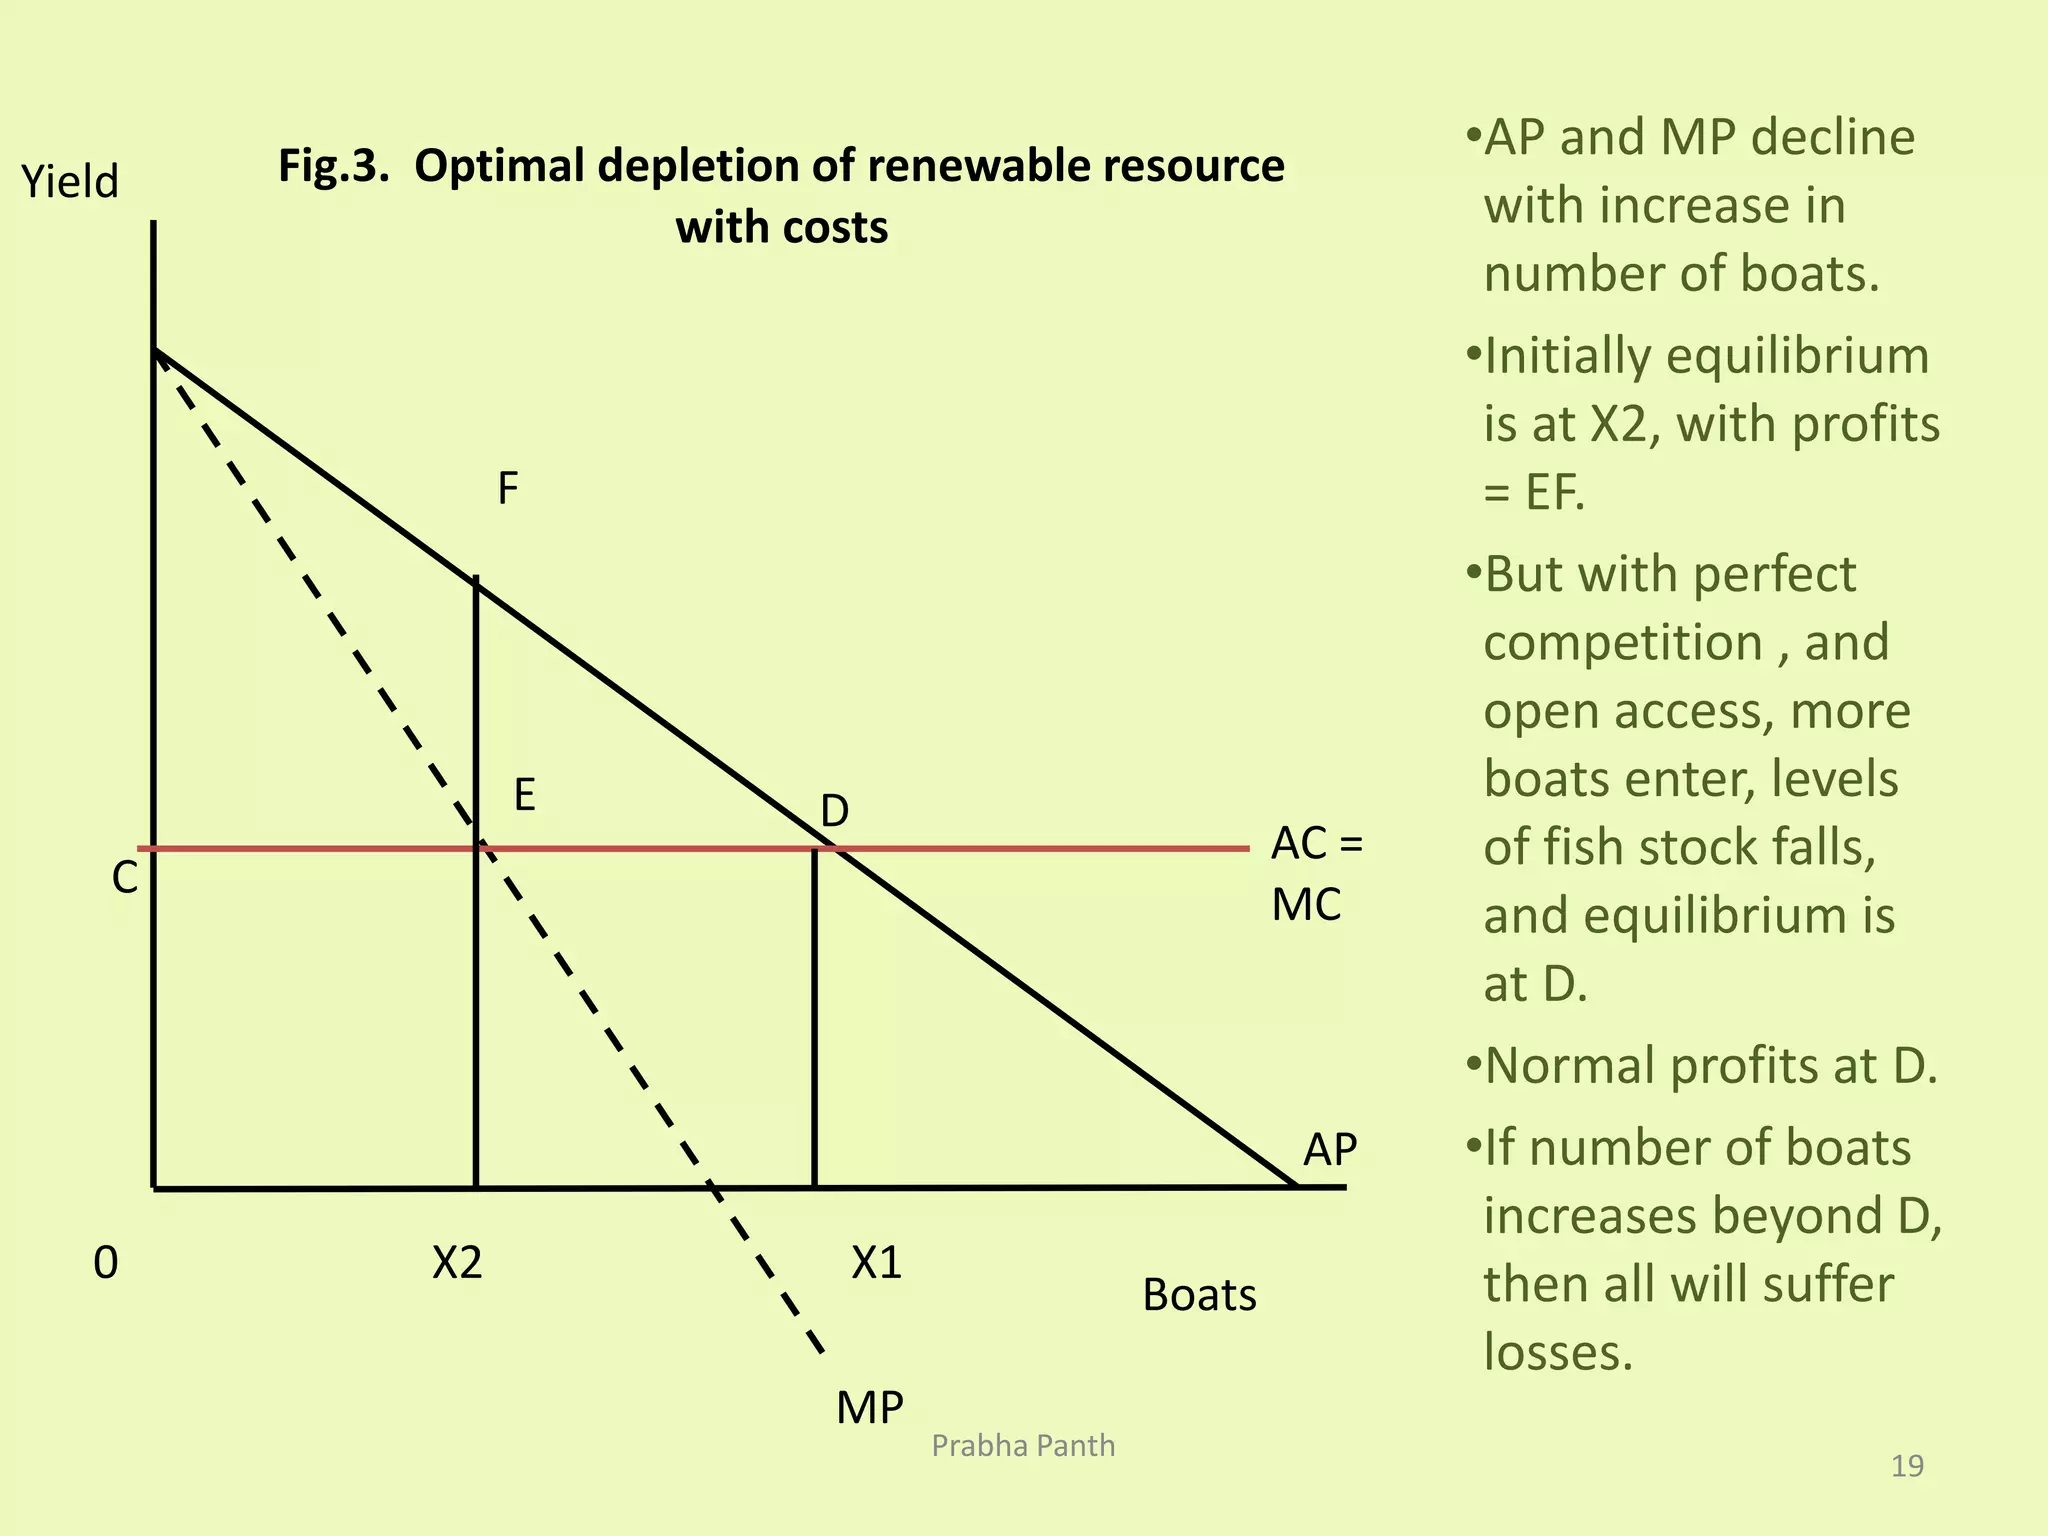

The document discusses the optimal depletion of renewable resources, emphasizing the importance of balancing the rate of exploitation with the rate of regeneration to avoid depletion. It uses the example of fish in a lake to illustrate sustainable yield and the critical minimum size, below which renewal becomes unviable. Additionally, it examines the economic implications of discount rates in resource harvesting decisions and the conflict between ecological sustainability and economic growth.


