![Acid Test Ratio Definition This ratio compares the company's Current Liabilities with its Quick Assets - Cash, Marketable Securities, and Accounts Receivable. These assets are considered "quick" because they either are cash or can be converted to cash quickly. The Acid Test determines how well a corporation can meet its current obligations immediately - within days. Calculation [Quick Assets/Current Liabilities] * 100](https://image.slidesharecdn.com/financialkpi-1234121958898620-2/75/Financial-Key-Performance-Indicators-4-2048.jpg)


![Asset Coverage Ratio Definition The Total Assets divided by the amount of Long Term Debt indicates the safety of the lender's capital. The higher the ratio, the greater the security. Calculation Total Assets/[Long Term Debt + Total Equity] * 100](https://image.slidesharecdn.com/financialkpi-1234121958898620-2/75/Financial-Key-Performance-Indicators-8-2048.jpg)


![Average Receivables Definition The Average Receivables is the sum of the beginning and the closing balance for a period divided by two. Calculation [Beginning Receivables + End Of Period Receivables]/2](https://image.slidesharecdn.com/financialkpi-1234121958898620-2/75/Financial-Key-Performance-Indicators-12-2048.jpg)
![Average Working Capital Definition Average Working Capital is computed by adding the Working Capital values at the beginning and the end of an accounting period and dividing by two. Calculation [Beginning Working Capital + End Working Capital]/2](https://image.slidesharecdn.com/financialkpi-1234121958898620-2/75/Financial-Key-Performance-Indicators-13-2048.jpg)
![Average due items customer collection per day Definition "Average amount not paid per day, weighed by the number of days between the due date and the end date for the period/payment date. End date for period: End date of the query to be analyzed. Expired due date: The open item has not been paid/cleared before the due date. Example: 2 late payments received. Payment 1 = €200 paid after 12 days late. Payment 2 = €100 paid after 8 days late. Avg. amount not paid per day = (200€ x 12d + €100 x 8d) / (20d x 2p) = €80" Calculation "If payment date > due date or due date < end date for period: Sum [Amount of open items passed due date x ((payment date or end date for period) - due date)] / (# of days in period x # of invoices)"](https://image.slidesharecdn.com/financialkpi-1234121958898620-2/75/Financial-Key-Performance-Indicators-15-2048.jpg)

![Average payments per day Definition "Average amount received per day, weighed by the number of days between the document date and the payment date. Example: 2 payments received in the last 100 days. Payment 1 = €100 paid after 12 days. Payment 2 = €50 paid after 8 days. Average amount received per day = (€100 x 12d + €50 x 8d) / (20d x 2p) = €40" Calculation Sum [Amount per payment x # of days per payment] / (# of days in total x # of payments)](https://image.slidesharecdn.com/financialkpi-1234121958898620-2/75/Financial-Key-Performance-Indicators-17-2048.jpg)


![Break Even Point Definition The Break-Even Point is the Sales level at which the business neither profits nor loses money; Sales and Total Costs are exactly equal. It is a function of Sales, and Fixed and Variable Costs. This computation is made to enable the sales manager to know the point at which a product, a product line, or the business itself becomes profitable. It also can be used to calculate the Sales required to maintain a predetermined level of Operating Income if a variable changes. Calculation Fixed Costs/[1 - Variable Costs/Sales]](https://image.slidesharecdn.com/financialkpi-1234121958898620-2/75/Financial-Key-Performance-Indicators-21-2048.jpg)

![Capital Employed Ratio Definition The Capital/Stockholders' Equity has to be adjusted by deducting the value of assets that do not contribute to Operating Income, such as marketable securities or other forms of investment. The ratio of Sales divided by the Capital Employed reflects how well capital (adjusted to exclude noncurrent Assets) is used to produce revenue (sales). A high rate of Capital Employed usually means that capital is being used efficiently. Calculation Sales/[Capital - Noncurrent Assets] * 100](https://image.slidesharecdn.com/financialkpi-1234121958898620-2/75/Financial-Key-Performance-Indicators-23-2048.jpg)


![Cash Ratio Definition The ratio compares the company's Cash and Marketable Securities with its Current Liabilities. The cash ratio includes even fewer assets that the acid test; it leaves out Accounts Receivable. The Cash Ratio determines how well a corporation can meet its current obligations immediately. Calculation [Cash + Marketable Securities]/Current Liabilities * 100](https://image.slidesharecdn.com/financialkpi-1234121958898620-2/75/Financial-Key-Performance-Indicators-33-2048.jpg)


![Company Growth vs. Market Growth Definition The company growth, based on the annual increase of Revenue, compared to the growth of the competitors. Calculation [Company growth - Market growth] / Market growth * 100](https://image.slidesharecdn.com/financialkpi-1234121958898620-2/75/Financial-Key-Performance-Indicators-44-2048.jpg)


![Current And Prior Period Billings To Current Costs Ratio Definition The ratio of Current And Prior Billings to Current Costs calculates the rate of collections. Calculation [Current Period Billings + Prior Period Billings]/Current Costs](https://image.slidesharecdn.com/financialkpi-1234121958898620-2/75/Financial-Key-Performance-Indicators-63-2048.jpg)


![Days Of Sales In Backlog Definition Backlog: Order, which has not been delivered yet. The historical analysis of the Days-Of-Sales-In-Backlog factor helps to evaluate an organization's ability to handle its backlog. Note: Use 90 days for a quarter, 360 for a year. Calculation [Backlog / Sales]*Days In Period](https://image.slidesharecdn.com/financialkpi-1234121958898620-2/75/Financial-Key-Performance-Indicators-71-2048.jpg)
![Days Purchases In Disbursements Ratio Definition This ratio relates how much a company purchases to how much cash it actually disburses in a given period. It is expressed in terms of days' worth of purchase. Calculation [Disbursements/Period Purchases]*Days In Period](https://image.slidesharecdn.com/financialkpi-1234121958898620-2/75/Financial-Key-Performance-Indicators-72-2048.jpg)
![Days Purchases In Payables Ratio Definition This ratio relates the Amounts Payable to an organization's total Purchases for a given period. When validated by historical data, this factor acts as a guideline in verifying the feasibility of payables figures that are developed by other means. Calculation [Accounts Payable, ending balance/Period Purchases]*Days In Period](https://image.slidesharecdn.com/financialkpi-1234121958898620-2/75/Financial-Key-Performance-Indicators-73-2048.jpg)
![Days Purchases Outstanding Ratio Definition The Days Purchases Outstanding is a ratio used to determine whether an organization is meeting its Trade Payable commitments on schedule. Calculation [Trades Payable/Period Purchases]*Days In Period](https://image.slidesharecdn.com/financialkpi-1234121958898620-2/75/Financial-Key-Performance-Indicators-74-2048.jpg)
![Days Sales Outstanding Definition The outstandings of a company expressed in their daily Sales Calculation Average Receivable / [Sales / 365]](https://image.slidesharecdn.com/financialkpi-1234121958898620-2/75/Financial-Key-Performance-Indicators-75-2048.jpg)


![EARNINGS BEFORE DEPRECIATION, INTEREST, AND TAX Definition This measure of cash flow is equal to pretax income and interest expense and depreciation. Calculation Sales - COGS - Operating Costs [excluding Depreciation]](https://image.slidesharecdn.com/financialkpi-1234121958898620-2/75/Financial-Key-Performance-Indicators-87-2048.jpg)

![EARNINGS BEFORE INTEREST TAX DEPRECIATION AMORTIZATION Definition Estimated by adding depreciation and amortization back to operating income (EBIT). Calculation Sales - COGS - Operating Costs [excluding Depreciation & Amortization]](https://image.slidesharecdn.com/financialkpi-1234121958898620-2/75/Financial-Key-Performance-Indicators-89-2048.jpg)
![ECONOMIC PROFIT - CAPITAL CHARGE Definition The Economic Profit EP is a periodic measure based on the principles of shareholder value and basically the same as Economic Value Added EVA(TM) from Stewart. EP shows if a company is creating value for the shareholder or not. Only if the EP is positive then the company creates "added value". If there is "added value" then a shareholder gets better conditions compared profitability to risk than investing his money in a comparable risk free investment. In the Capital Charge form, EP can be easily calculated as follows: NOPAT (=Net Operating Profit After Taxes) minus Weighted Average Cost of Capital multiplied with Capital. Calculation NOPAT - [WACC * Capital]](https://image.slidesharecdn.com/financialkpi-1234121958898620-2/75/Financial-Key-Performance-Indicators-91-2048.jpg)
![ECONOMIC PROFIT - VALUE SPREAD Definition The Economic Profit EP is a periodic measure based on the principles of shareholder value and basically the same as Economic Value Added EVA(TM) from Stewart. EP shows if a company is creating value for the shareholder or not. Only if the EP is positive then the company creates "added value". If there is "added value" then a shareholder gets better conditions compared profitability to risk than investing his money in a comparable risk free investment. In the Value Spread form, the Economic Profit can be easily calculated as follows: NOPAT (=Net Operating Profit After Taxes) is divided by Capital. Then the Cost of Capital is deducted. Finally, the result is multiplied with Capital. Calculation Capital * [[NOPAT/Capital] - Cost Of Capital]](https://image.slidesharecdn.com/financialkpi-1234121958898620-2/75/Financial-Key-Performance-Indicators-92-2048.jpg)
![ECONOMIC VALUE ADDED - CAPITAL CHARGE Definition The Economic Value Added (TM) from Stewart is a periodic measure based on the principles of shareholder value. EVA (TM) shows if a company is creating value for the shareholder or not. Only if the EVA (TM) is positive then the company creates "added value". If there is "added value" then a shareholder gets better conditions compared profitability to risk than investing his money in a comparable risk free investment. In the Capital Charge form, EVA (TM) can be easily calculated as follows: NOPAT (=Net Operating Profit After Taxes) minus Weighted Average Cost of Capital multiplied with Capital. Calculation NOPAT - [WACC * Capital]](https://image.slidesharecdn.com/financialkpi-1234121958898620-2/75/Financial-Key-Performance-Indicators-93-2048.jpg)
![ECONOMIC VALUE ADDED - VALUE SPREAD Definition The Economic Value Added (TM) from Stewart is a periodic measure based on the principles of shareholder value. EVA (TM) shows if a company is creating value for the shareholder or not. Only if the EVA (TM) is positive then the company creates "added value". If there is "added value" then a shareholder gets better conditions compared profitability to risk than investing his money in a comparable risk free investment. In the Value Spread form, EVA (TM) can be easily calculated as follows: NOPAT (=Net Operating Profit After Taxes) is divided by Capital. Then the Cost of Capital is deducted. Finally, the result is multiplied with Capital. Calculation Capital * [[NOPAT/Capital] - Cost Of Capital]](https://image.slidesharecdn.com/financialkpi-1234121958898620-2/75/Financial-Key-Performance-Indicators-94-2048.jpg)


![FUNDED CAPITAL RATIO Definition The Funded Capital Ratio is computed by dividing the sum of Long-Term (funded) Debt and Stockholders' Equity by Fixed Assets. It reflects how much of the borrowed and investors' capital goes toward the financing of Fixed Assets. Calculation [Long Term Debt + Stockholders' Equity]/Fixed Assets * 100](https://image.slidesharecdn.com/financialkpi-1234121958898620-2/75/Financial-Key-Performance-Indicators-107-2048.jpg)


![INTERNAL RATE OF RETURN Definition The Internal Rate of Return is the discount rate at which net present value (NPV) investment is zero. It would make the present value of future cash flows plus the final market value of an investment or business opportunity equal the current market price of the investment or opportunity. To calculate the IRR a interpolation has to be done, if time [t] is greater than 2 years. Calculation 0 = -[Net Present Value] + Sum [ Cash Flow[t] / [[1+IRR]^t] ]](https://image.slidesharecdn.com/financialkpi-1234121958898620-2/75/Financial-Key-Performance-Indicators-119-2048.jpg)


![INVESTMENT TURNOVER Definition Return earned on capital invested in a business. A higher ratio indicates good use of the funds placed into the business. Calculation Sales / [Stockholders' Equity + Long Term Liabilities] * 100](https://image.slidesharecdn.com/financialkpi-1234121958898620-2/75/Financial-Key-Performance-Indicators-122-2048.jpg)

![INVOICE REVERSAL RATE Definition Percentage of invoices that were reversed within a certain period. - Reversed invoices: Invoices which were ‘incorrect’ and therefore cancelled by creating a reversal document for the invoice. Only invoices that are accounted are considered, not the ones that were outsorted. - Period: Date intervals to be decided in the report. Calculation [# of reversed invoices during period A] x 100 / [Total # of invoices during period A](https://image.slidesharecdn.com/financialkpi-1234121958898620-2/75/Financial-Key-Performance-Indicators-125-2048.jpg)


![NET INCOME Definition Net Income is the amount left after adding income from other (nonoperational) sources and deducting all expenses and taxes from Sales. It is also known as Net Income. Net Income is the income after accounting for all corporate actions: Income from Continuing Operations + Income from Discontinued Operations + Income from Extraordinary Items + Income from Accumulative Effect of Accounting Changes + Income from Tax Loss Carryforward + Income from Other Gains/Losses. Calculation Revenue - [All Expenses + Tax]](https://image.slidesharecdn.com/financialkpi-1234121958898620-2/75/Financial-Key-Performance-Indicators-144-2048.jpg)
![NET INCOME BEFORE TAXES Net Income Before Taxes is the profit left after deducting all expenses from operating and nonoperating income, but before providing for taxes. To obtain this value add other miscellaneous income (such as sales discounts, gain on sale of fixed assets, interest income, etc. and reduce this amount by other deductions (such as interest expense, project abandonment, deferred development, and loss on the sale of fixed assets). It is also known as Pretax Profit. Calculation [Operating Income + Nonoperating Income] - All expenses, including interest expense](https://image.slidesharecdn.com/financialkpi-1234121958898620-2/75/Financial-Key-Performance-Indicators-145-2048.jpg)

![NET INCOME TO CAPITAL RATIO (PREFERRED STOCK) Definition This ratio is derived by dividing Net Income by Stockholders' Equity. If a corporation has issued preferred stock, then the Dividends must be deducted from Net Income and the Par Value subtracted from Capital (or Net Worth). Calculation [Net Income - Preferred Dividends]/[Stockholders' Equity - Preferred Stock Par Value] * 10](https://image.slidesharecdn.com/financialkpi-1234121958898620-2/75/Financial-Key-Performance-Indicators-148-2048.jpg)


![OPERATING CASH FLOW Definition The expected or certain value of a future cash flow discounted to the present at an appropriate interest (discount) rate. It is equal to the earnings before depreciation minus taxes. This ratio measures the cash generated from operations, not counting capital spending or working capital requirements. Sum = Sum over all i periods, Cash Flow(i) = Cash Flow in the ith period, n(i) interest rate from now to the ith period, 1/n(i) = discount factor for the ith period. Calculation Sum[ [Cash Flow[i]] * [1/n[i]]]](https://image.slidesharecdn.com/financialkpi-1234121958898620-2/75/Financial-Key-Performance-Indicators-157-2048.jpg)

![OPERATING INCOME Definition The Operating Income , or Operating Income, is equal to Sales less all related expenses applying to the normal business activities (Cost of Goods Sold, General and Administrative Expenses, Selling Expenses). Calculation Sales - [Cost of Goods Sold + G&A Expenses + Selling Expenses]](https://image.slidesharecdn.com/financialkpi-1234121958898620-2/75/Financial-Key-Performance-Indicators-160-2048.jpg)
![OPERATING LEVERAGE RATIO Definition The Operating Leverage Ratio assesses the effect of fluctuating Sales on Operating Profits. It is the leverage a company gains from Sales, it says that Operating Income changes "so many times" the percentage change of Sales. The factor is inversely proportional to Operating Income and changes with fluctuations in Sales and in Expenses. Note: Income risk is distinguished from financial risk, which is posed by the heavy use of debt support by creditors. Calculation [Sales - Variable Costs]/Operating Income * 100](https://image.slidesharecdn.com/financialkpi-1234121958898620-2/75/Financial-Key-Performance-Indicators-162-2048.jpg)


![PROJECT PROFIT MARGIN Definition Contribution Margin of projects. Calculation [Project Revenue - Project Costs] / Project Revenue * 100](https://image.slidesharecdn.com/financialkpi-1234121958898620-2/75/Financial-Key-Performance-Indicators-180-2048.jpg)
![RATE OF OPERATING RETURN ON CAPITAL Definition This rate is determined by multiplying the Capital-Employed-Ratio by Operating Income To Sales Ratio. Calculation Operating Income / [Capital - Noncurrent Assets] * 100](https://image.slidesharecdn.com/financialkpi-1234121958898620-2/75/Financial-Key-Performance-Indicators-182-2048.jpg)
![RATE OF RETURN ON CAPITAL Definition This rate is determined by multiplying the Capital-Employed-Ratio by Profitability. Calculation Net Income / [Capital - Noncurrent Assets] * 100](https://image.slidesharecdn.com/financialkpi-1234121958898620-2/75/Financial-Key-Performance-Indicators-183-2048.jpg)


![RESIDUAL INCOME Definition The Residual Income is defined as the Income minus Capital Charge (Capital times Weighted Average Cost of Capital WACC).Income = Operating Profit, EBIT, NOPAT, Net Income. Calculation Income - [Capital * WACC]](https://image.slidesharecdn.com/financialkpi-1234121958898620-2/75/Financial-Key-Performance-Indicators-187-2048.jpg)


![SALES Definition Sales is Total Sales less allowances for return and bad debt. Calculation Total Sales - [Returns + Bad Debt]](https://image.slidesharecdn.com/financialkpi-1234121958898620-2/75/Financial-Key-Performance-Indicators-202-2048.jpg)


![VALUE ADDED EMPLOYEE PRODUCTIVITY Definition Value added per employee is calculated as total product revenue less total material purchases ÷ total employment (in full-time equivalents). Calculation [Total product revenue - Total material purchases] / Headcount FTE](https://image.slidesharecdn.com/financialkpi-1234121958898620-2/75/Financial-Key-Performance-Indicators-230-2048.jpg)


![WEIGHT OF DEBT Definition This measure is obtained by dividing the cumulated value of debt by the cumulated value of debt plus value of equity for the entire sector. Calculation Debt/[Debt + Equity]](https://image.slidesharecdn.com/financialkpi-1234121958898620-2/75/Financial-Key-Performance-Indicators-233-2048.jpg)
![WEIGHT OF EQUITY Definition This measures is obtained by dividing equity by the cumulated value of debt plus value of equity for the entire sector. Calculation Equity/[Equity + Debt]](https://image.slidesharecdn.com/financialkpi-1234121958898620-2/75/Financial-Key-Performance-Indicators-234-2048.jpg)


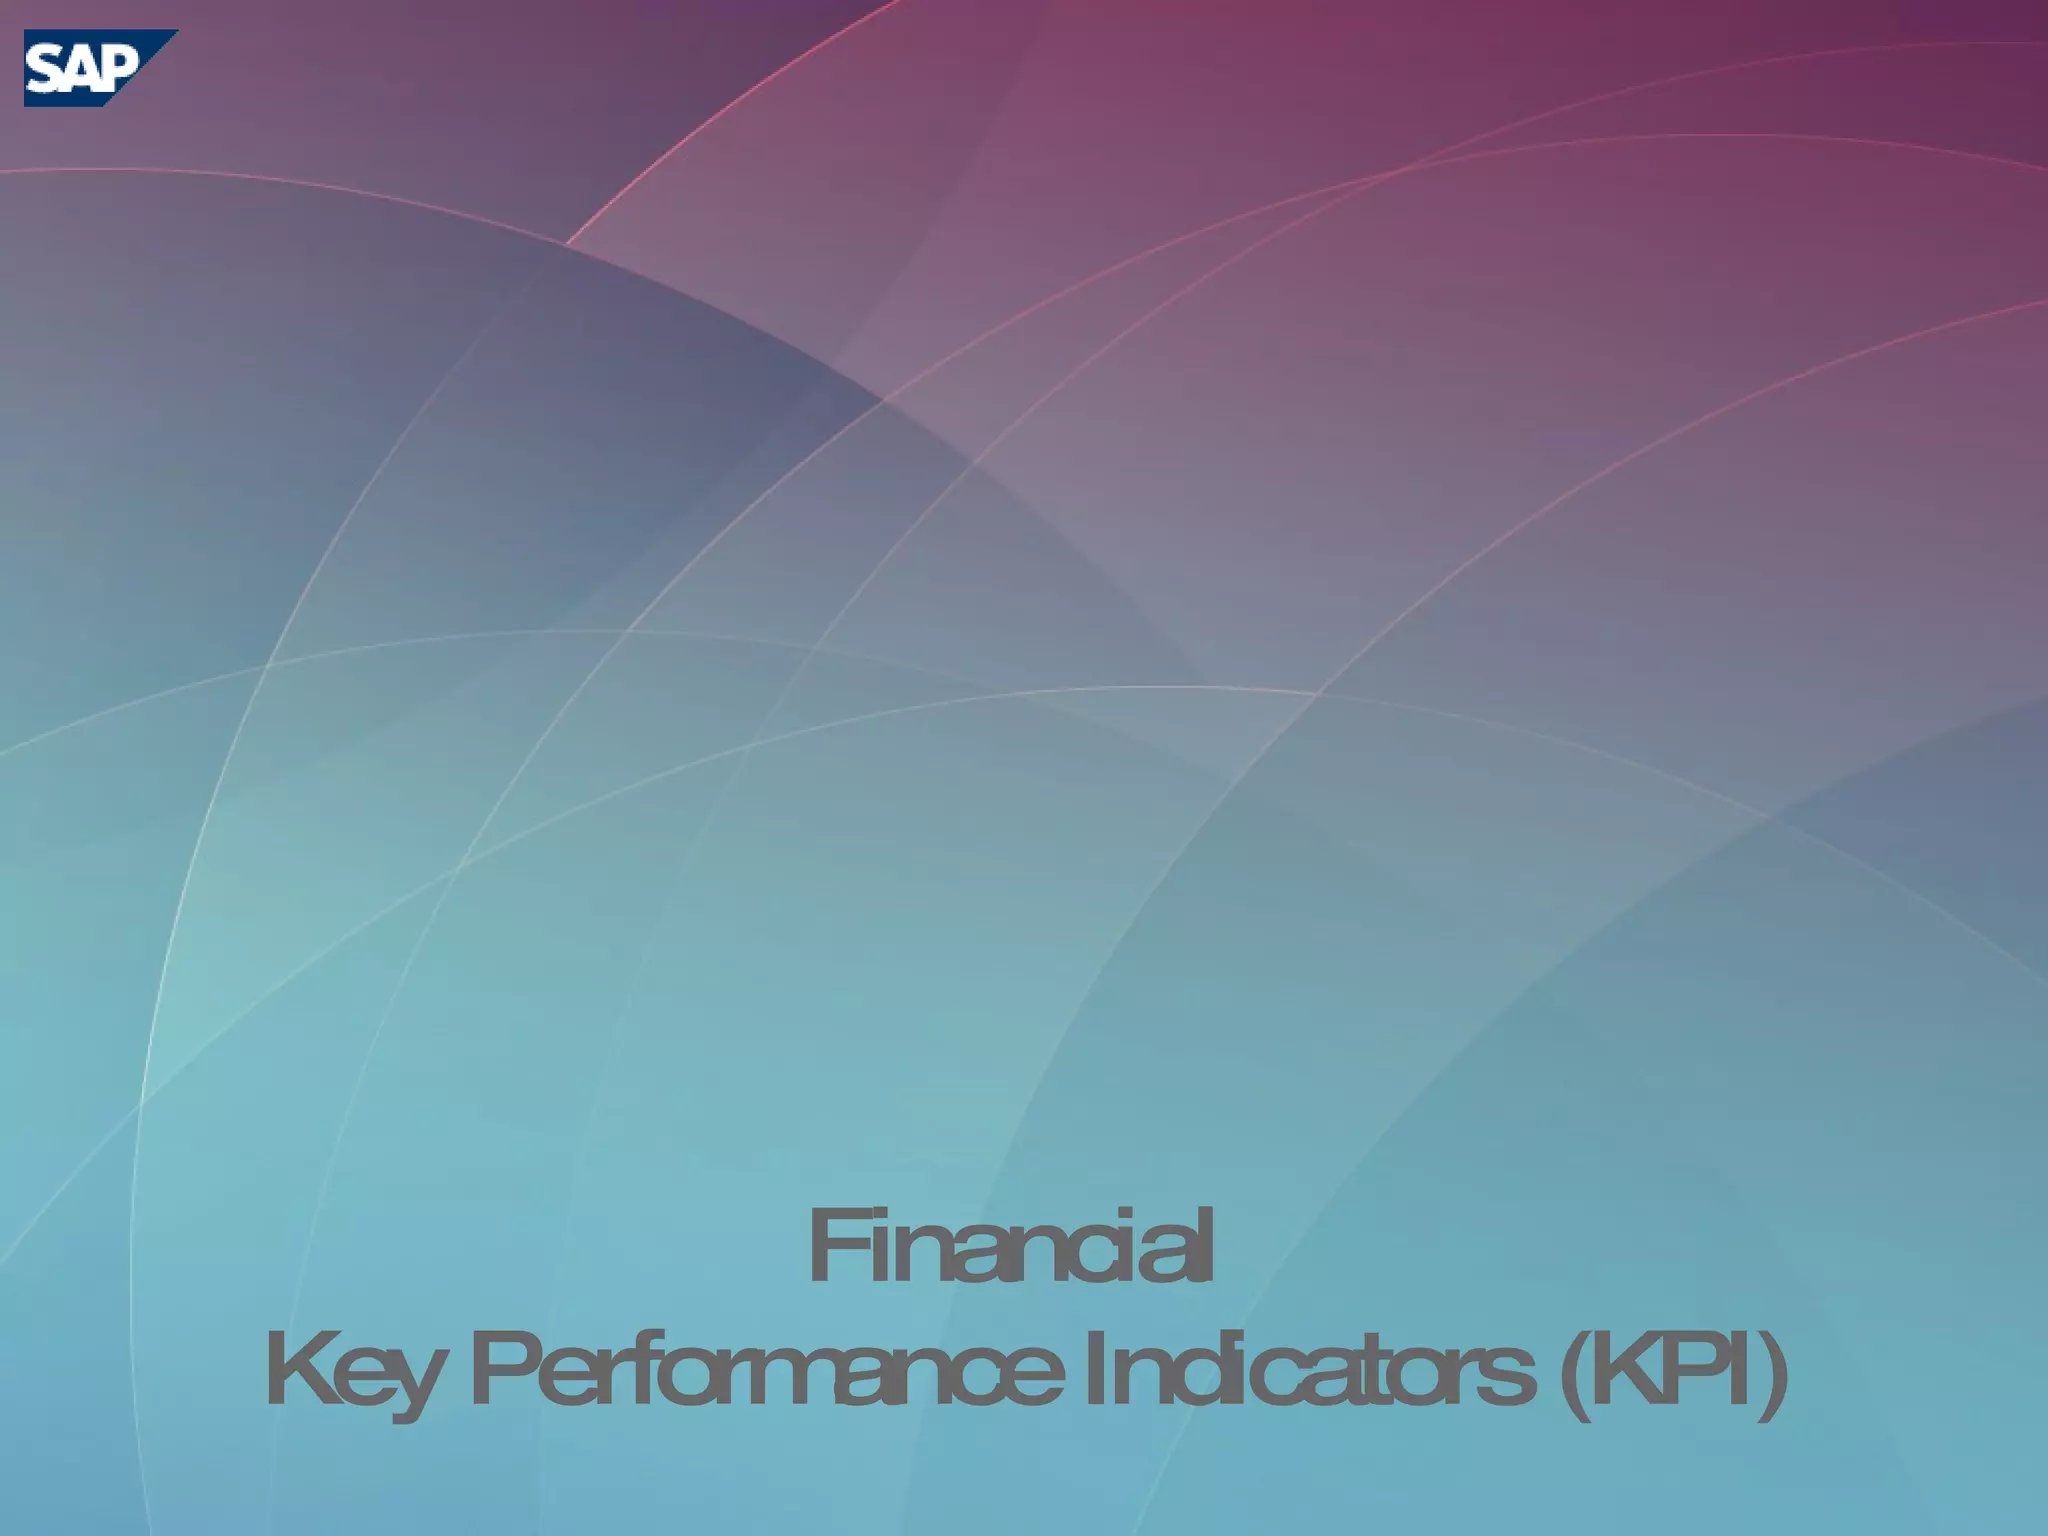
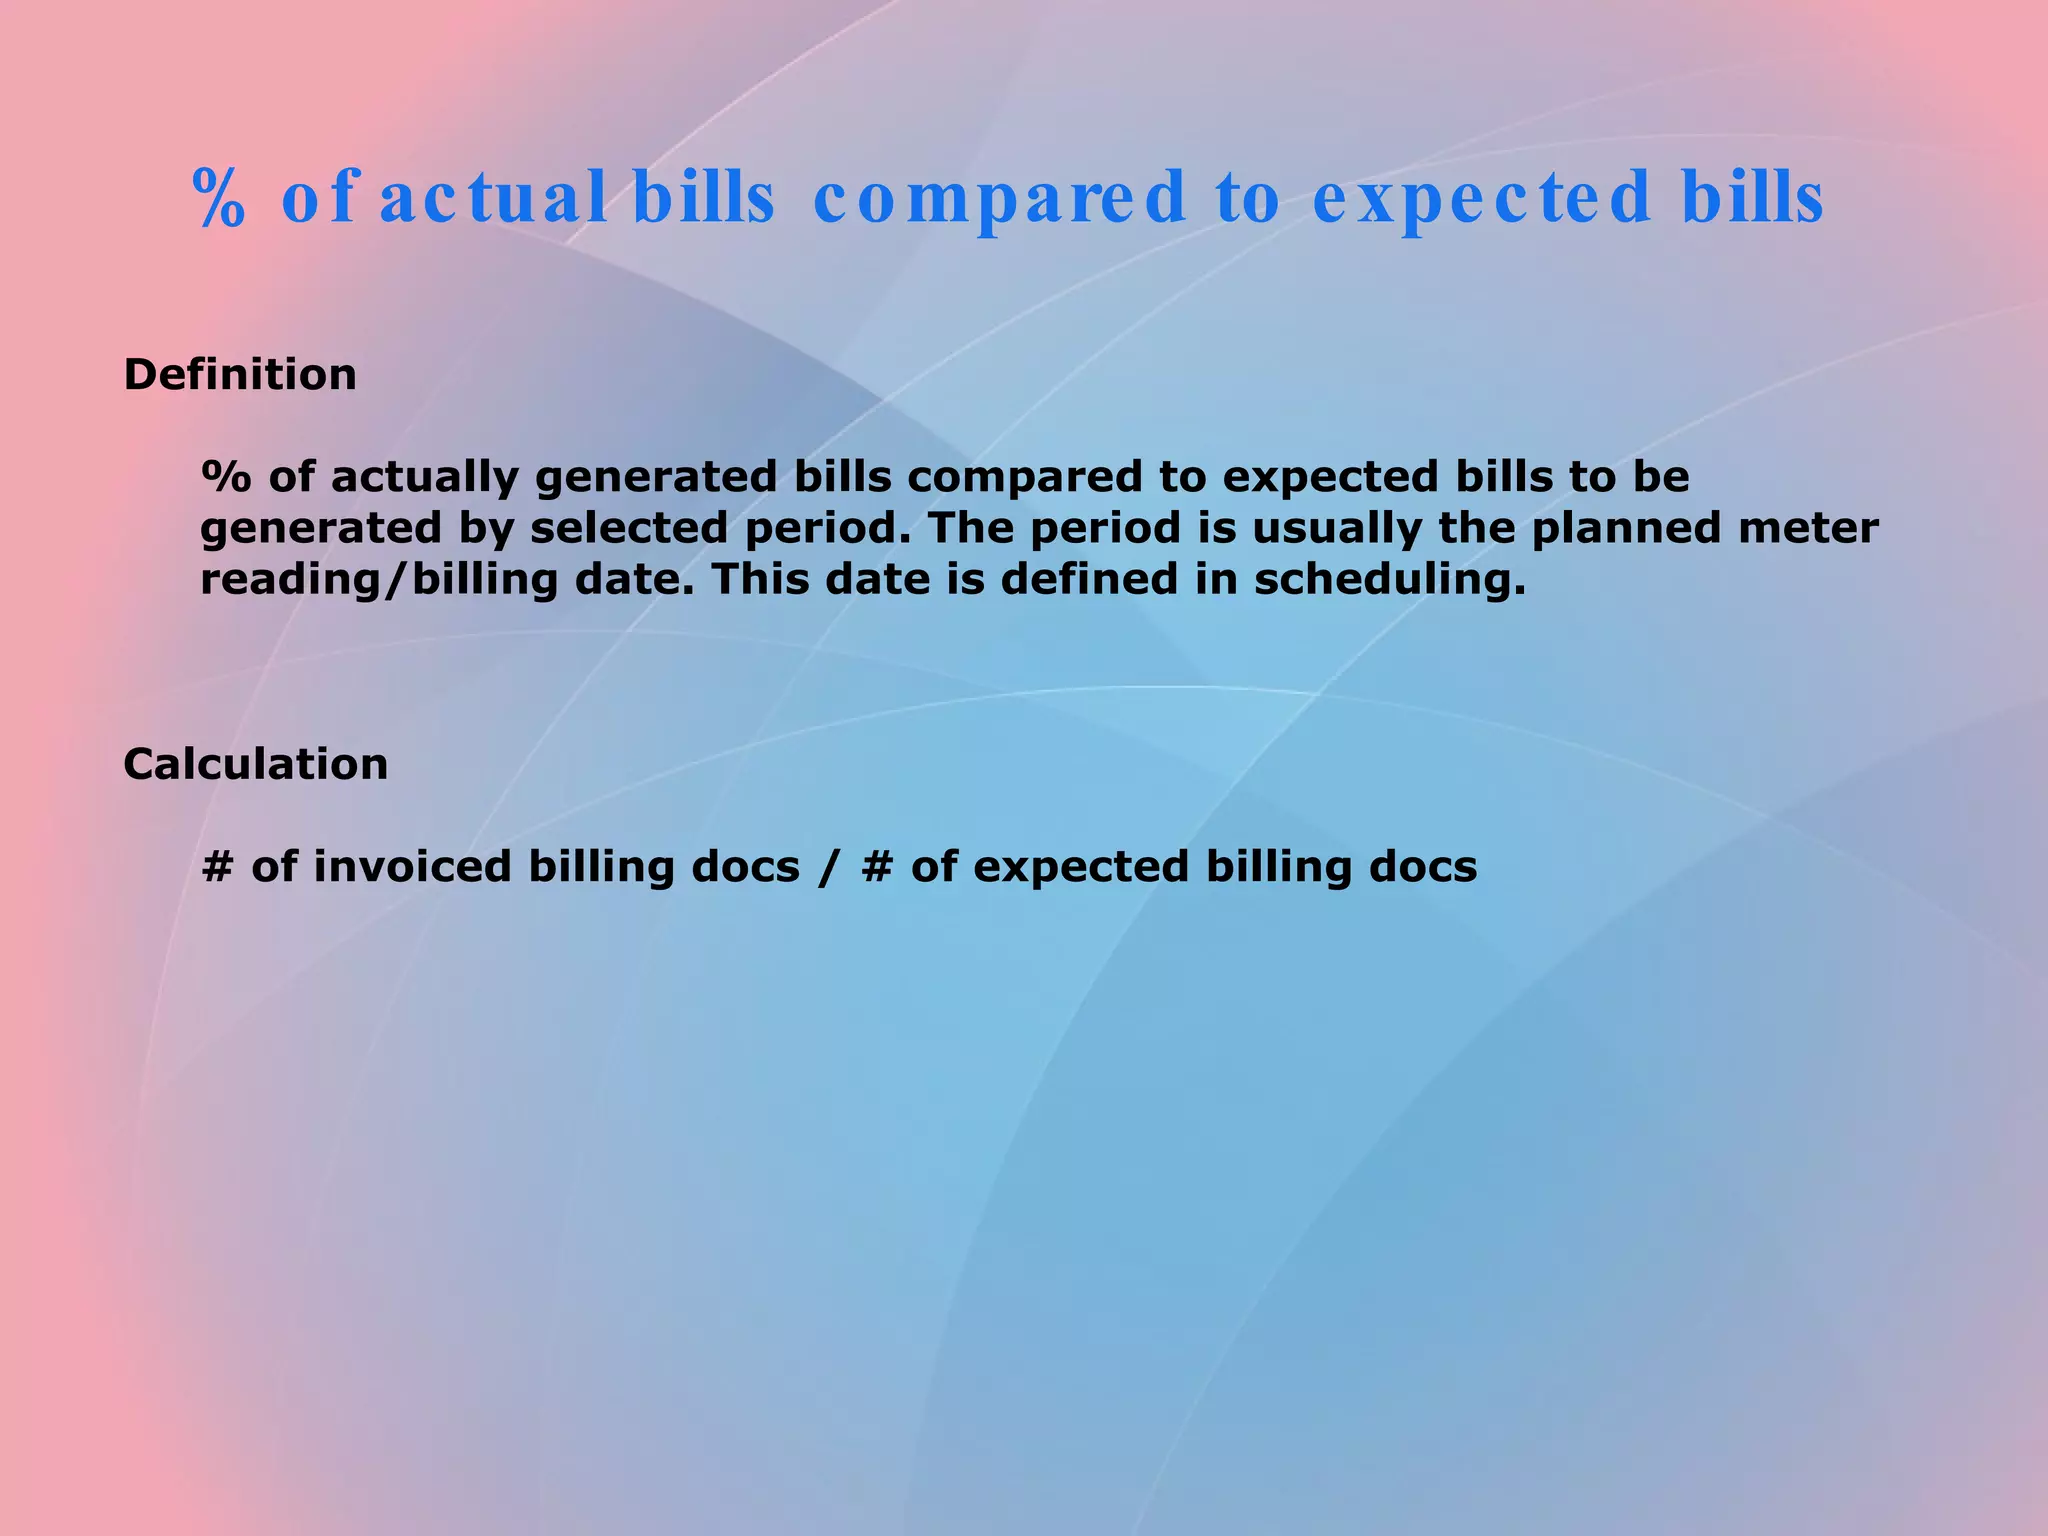
This document defines and provides the calculations for various financial key performance indicators (KPIs) used to measure business performance, including: 1) Percent of actual bills compared to expected bills measures billing efficiency by comparing actual invoices generated to planned invoices. 2) Accounts payable turnover ratio indicates how quickly a company pays its bills by comparing period purchases to ending accounts payable balance. 3) Acid test ratio compares current assets that can be quickly converted to cash to current liabilities to measure short-term liquidity.


