Key Financial Ratios (What your Financial Statements are saying)
•
2 likes•4,811 views

This Key Financial Ratios glossary assists small business owners in calculating key financial metrics of the business from their Financial Statements. This allows a business owner to understand what their financials mean and how a business has performed in the last financial year, comparably to historical performance and benchmarking performance against industry standards.

Recommended
More Related Content
What's hot
What's hot (20)
Similar to Key Financial Ratios (What your Financial Statements are saying)
Similar to Key Financial Ratios (What your Financial Statements are saying) (20)
Recently uploaded
Recently uploaded (20)
Key Financial Ratios (What your Financial Statements are saying)
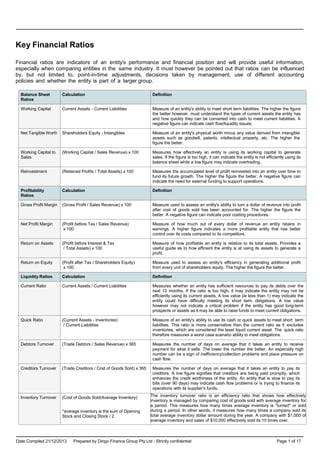
- 1. Date Compiled 21/12/2013 Prepared by Dirigo Finance Group Pty Ltd - Strictly confidential Page 1 of 17 Key Financial Ratios Financial ratios are indicators of an entity's performance and financial position and will provide useful information, especially when comparing entities in the same industry. It must however be pointed out that ratios can be influenced by, but not limited to, point-in-time adjustments, decisions taken by management, use of different accounting policies and whether the entity is part of a larger group. Balance Sheet Ratios Calculation Definition Working Capital Current Assets - Current Liabilities Measure of an entity's ability to meet short term liabilities. The higher the figure the better however, must understand the types of current assets the entity has and how quickly they can be converted into cash to meet current liabilities. A negative figure can indicate cash flow/liquidity issues. Net Tangible Worth Shareholders Equity - Intangibles Measure of an entity's physical worth minus any value derived from intangible assets such as goodwill, patents, intellectual property, etc. The higher the figure the better. Working Capital to Sales (Working Capital / Sales Revenue) x 100 Measures how effectively an entity is using its working capital to generate sales. If the figure is too high, it can indicate the entity is not efficiently using its balance sheet while a low figure may indicate overtrading. Reinvestment (Retained Profits / Total Assets) x 100 Measures the accumulated level of profit reinvested into an entity over time to fund its future growth. The higher the figure the better. A negative figure can indicate the need for external funding to support operations. Profitability Ratios Calculation Definition Gross Profit Margin (Gross Profit / Sales Revenue) x 100 Measure used to assess an entity's ability to turn a dollar of revenue into profit after cost of goods sold has been accounted for. The higher the figure the better. A negative figure can indicate poor costing procedures. Net Profit Margin (Profit before Tax / Sales Revenue) x 100 Measure of how much out of every dollar of revenue an entity retains in earnings. A higher figure indicates a more profitable entity that has better control over its costs compared to its competitors. Return on Assets (Profit before Interest & Tax / Total Assets) x 100 Measure of how profitable an entity is relative to its total assets. Provides a useful guide as to how efficient the entity is at using its assets to generate a profit. Return on Equity (Profit after Tax / Shareholders Equity) x 100 Measure used to assess an entity's efficiency in generating additional profit from every unit of shareholders equity. The higher the figure the better. Liquidity Ratios Calculation Definition Current Ratio Current Assets / Current Liabilities Measures whether an entity has sufficient resources to pay its debts over the next 12 months. If the ratio is too high, it may indicate the entity may not be efficiently using its current assets. A low value (ie less than 1) may indicate the entity could have difficulty meeting its short term obligations. A low value however may not indicate a critical problem if the entity has good long-term prospects or assets as it may be able to raise funds to meet current obligations. Quick Ratio (Current Assets - Inventories) / Current Liabilities Measure of an entity's ability to use its cash or quick assets to meet short term liabilities. This ratio is more conservative than the current ratio as it excludes inventories, which are considered the least liquid current asset. The quick ratio therefore measures a worst case scenario ability to meet obligations. Debtors Turnover (Trade Debtors / Sales Revenue) x 365 Measures the number of days on average that it takes an entity to receive payment for what it sells. The lower the number the better. An especially high number can be a sign of inefficiency/collection problems and place pressure on cash flow. Creditors Turnover (Trade Creditors / Cost of Goods Sold) x 365 Measures the number of days on average that it takes an entity to pay its creditors. A low figure signifies that creditors are being paid promptly, which enhances the credit worthiness of the entity. An entity that is slow to pay its bills (over 90 days) may indicate cash flow problems or is trying to finance its operations with its supplier’s funds. Inventory Turnover (Cost of Goods Sold/Average Inventory) *average inventory is the sum of Opening Stock and Closing Stock / 2 The inventory turnover ratio is an efficiency ratio that shows how effectively inventory is managed by comparing cost of goods sold with average inventory for a period. This measures how many times average inventory is "turned" or sold during a period. In other words, it measures how many times a company sold its total average inventory dollar amount during the year. A company with $1,000 of average inventory and sales of $10,000 effectively sold its 10 times over.
- 2. Date Compiled 21/12/2013 Prepared by Dirigo Finance Group Pty Ltd - Strictly confidential Page 2 of 17 Inventory Turnover This ratio is important because total turnover depends on two main components of performance. The first component is stock purchasing. If larger amounts of inventory are purchased during the year, the company will have to sell greater amounts of inventory to improve its turnover. If the company can't sell these greater amounts of inventory, it will incur storage costs and other holding. The second component is sales. Sales have to match inventory purchases otherwise the inventory will not turn effectively. That's why the purchasing and sales departments must be in tune with each other. Debt Ratios Calculation Definition Gearing (Total Liabilities / Total Assets) x 100 Measures the proportion of total debt outstanding relative to an entity's total assets. Used to indicate an entity's longer term stability, in particular its ability to meet debts from its asset base. The lower the percentage, the better is the ability to cover debt from assets. A high gearing is generally considered speculative. Debt to Equity (Total Liabilities / Shareholders Equity) x 100 Measures the proportion of capital invested by the entity's owners to the funds provided by external lenders/creditors. A high ratio generally means that the entity has been aggressive in financing its growth with debt. Leverage Total Liabilities / (Profit before Interest, Tax & Depreciation) Measures an entity's proportion of operating profit that is used to pay its liabilities . Entities that are highly leveraged may be at risk of failure and may also be unable to find new lenders. Interest Coverage (Profit before Tax + Interest Expense) / Interest Expense Measures an entity's level of profits that are available to meet its interest expense. Very important from a lender's point of view as it indicates the number of times interest is covered by profit. A high ratio provides greater assurance of regular interest payments. A low ratio could create problems to the entity in raising funds.