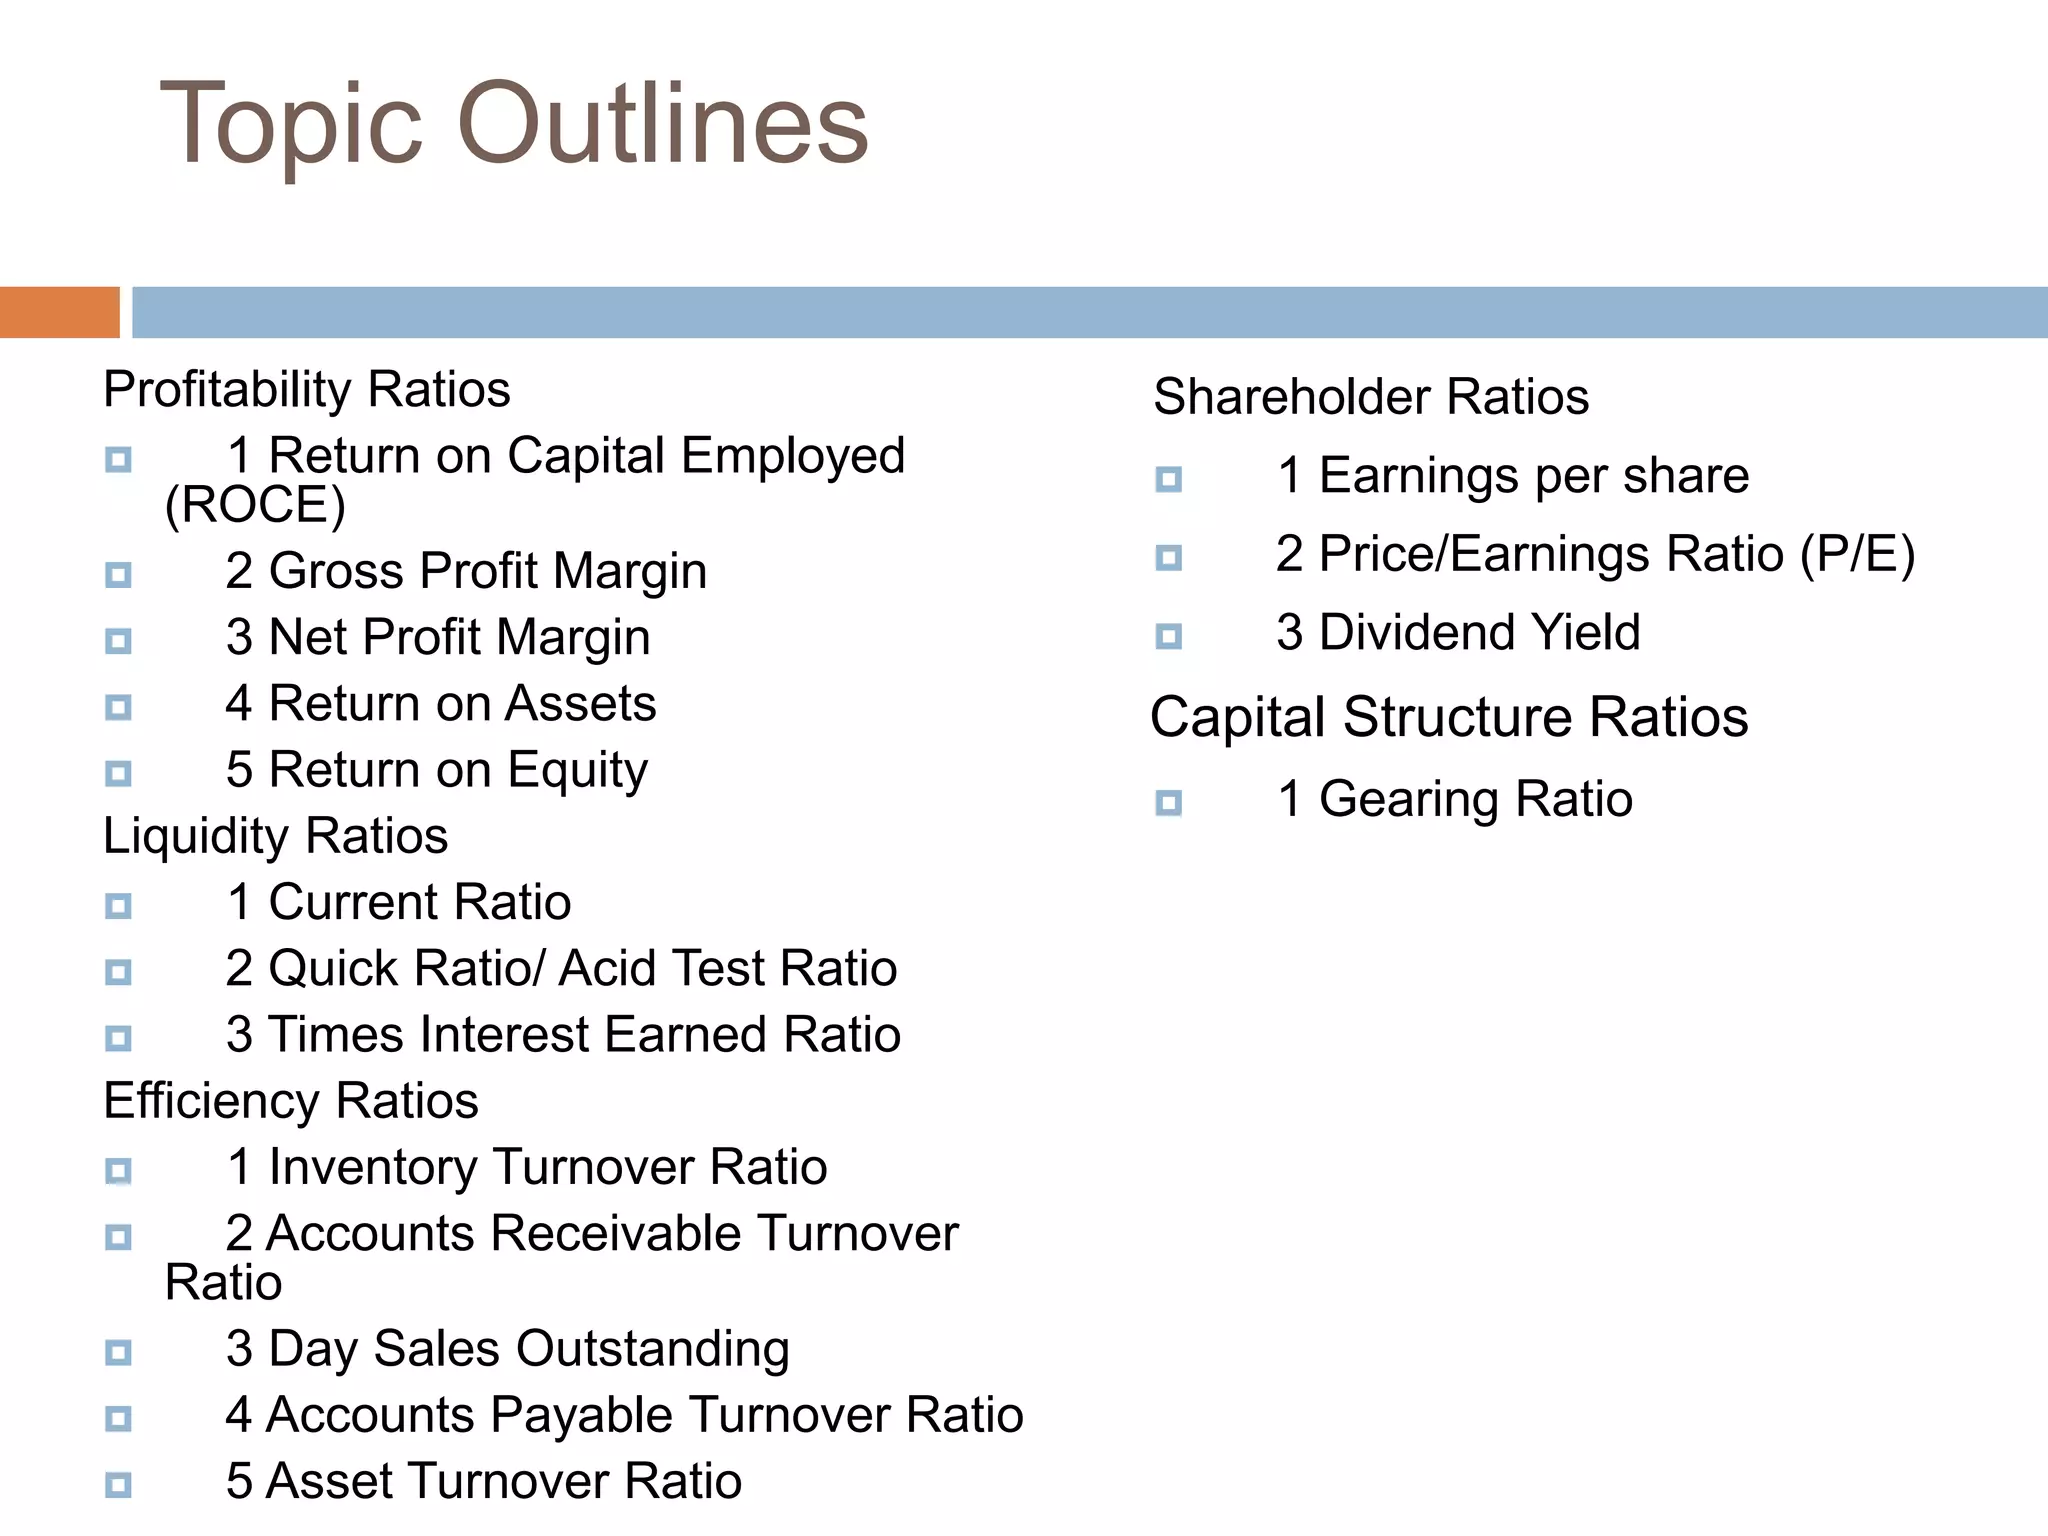
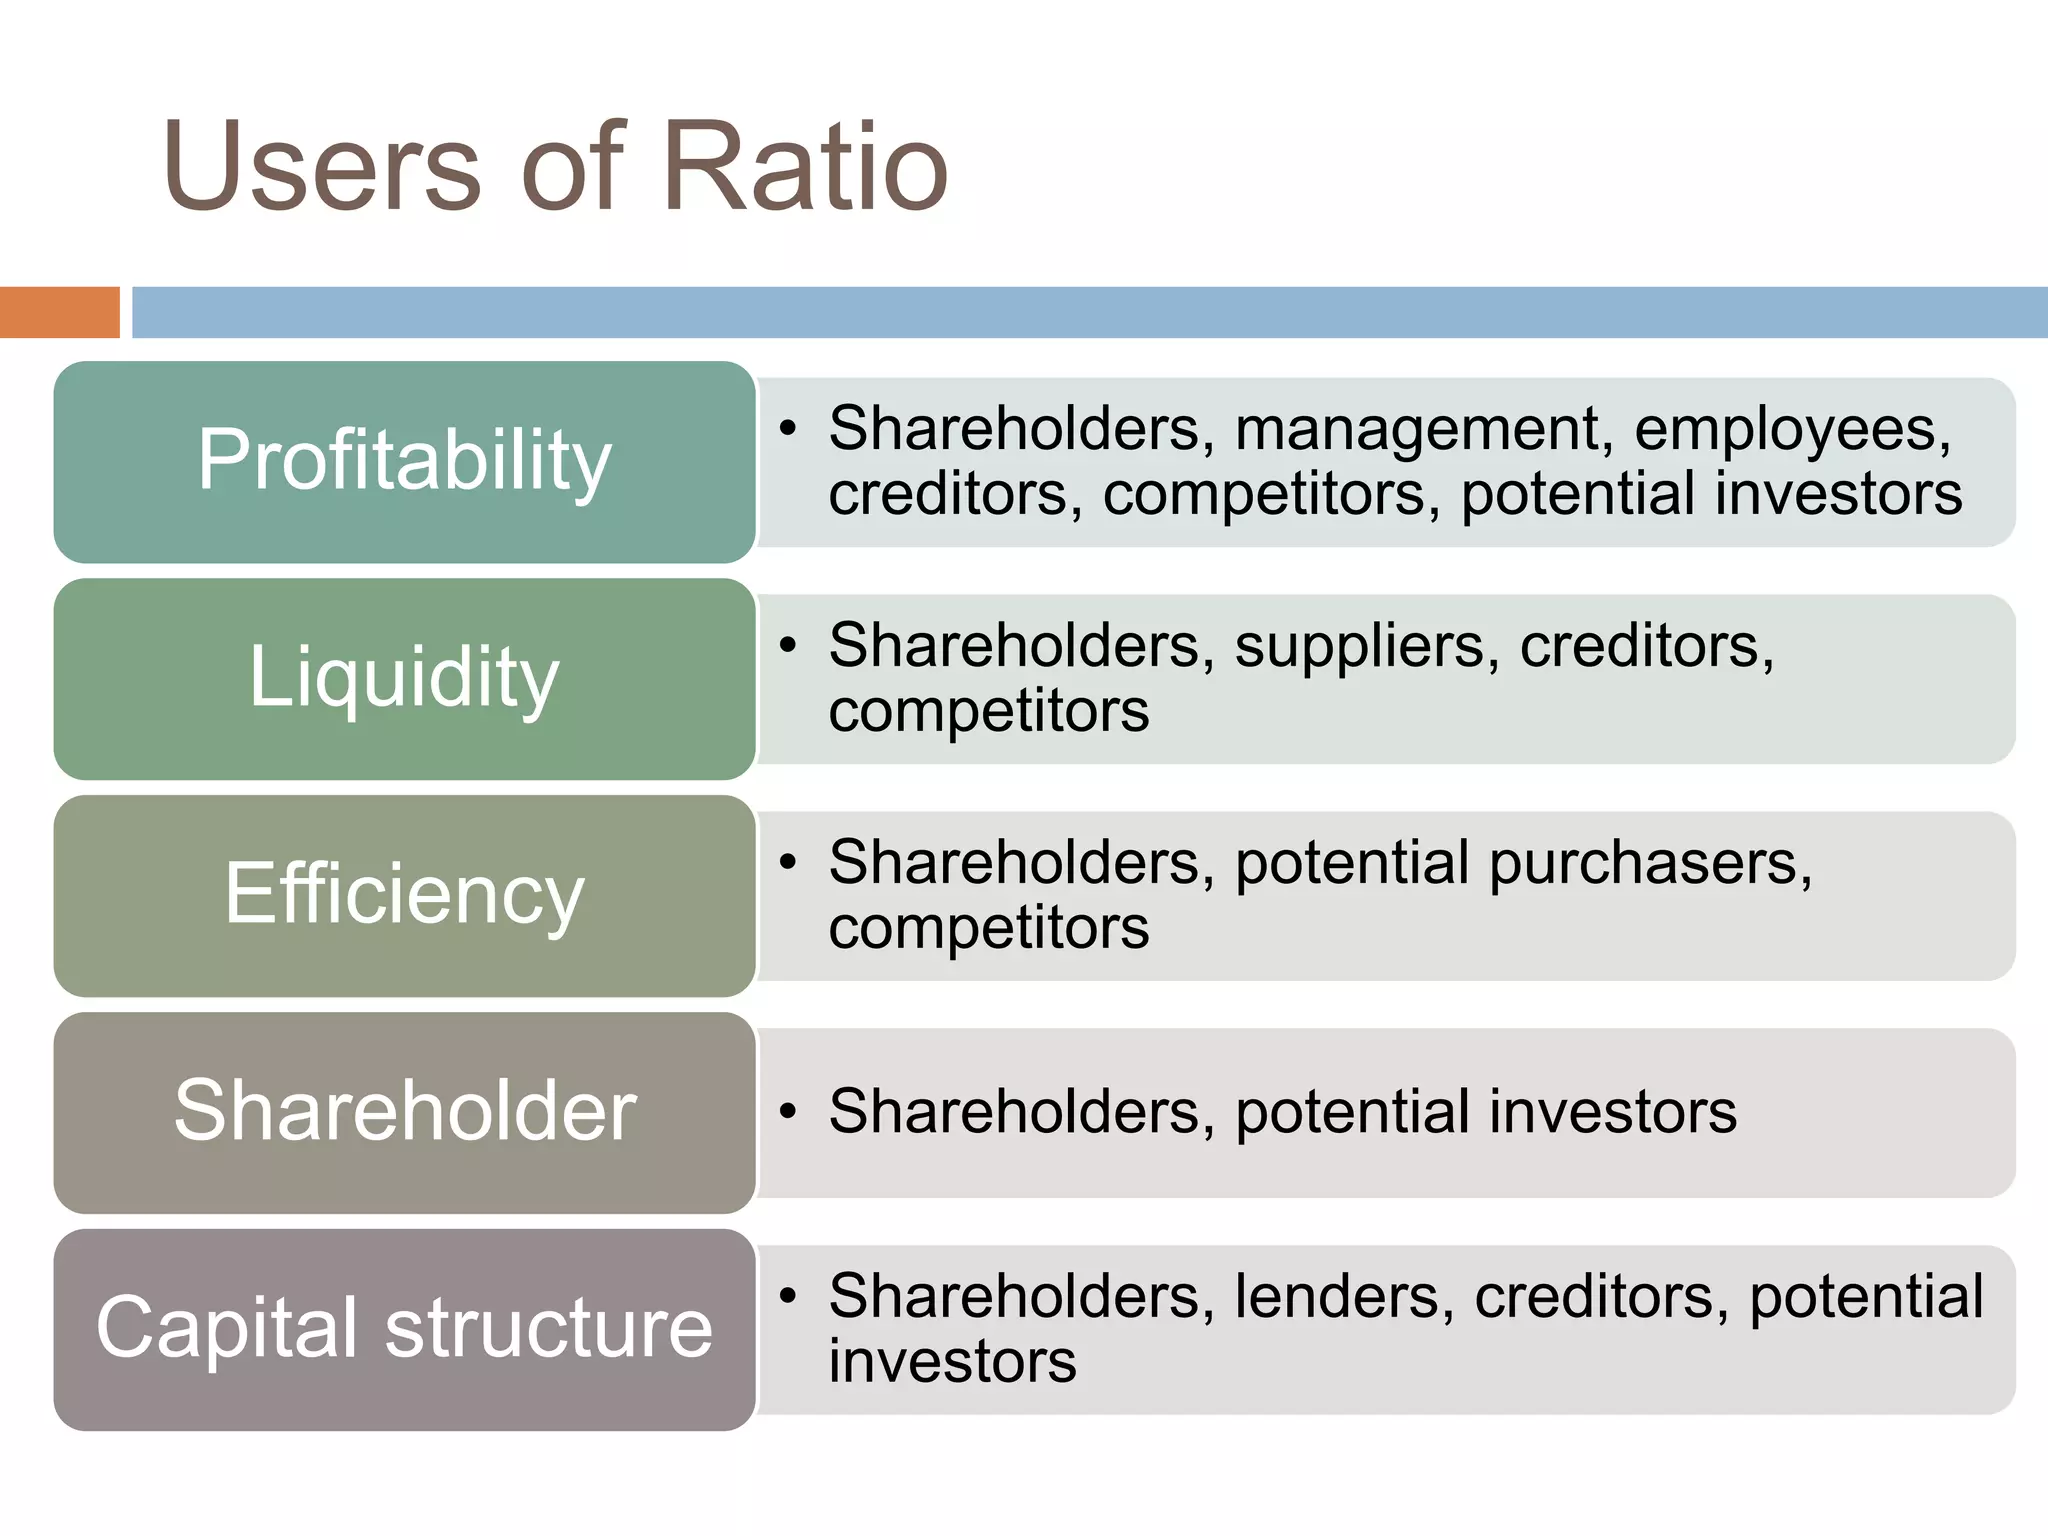
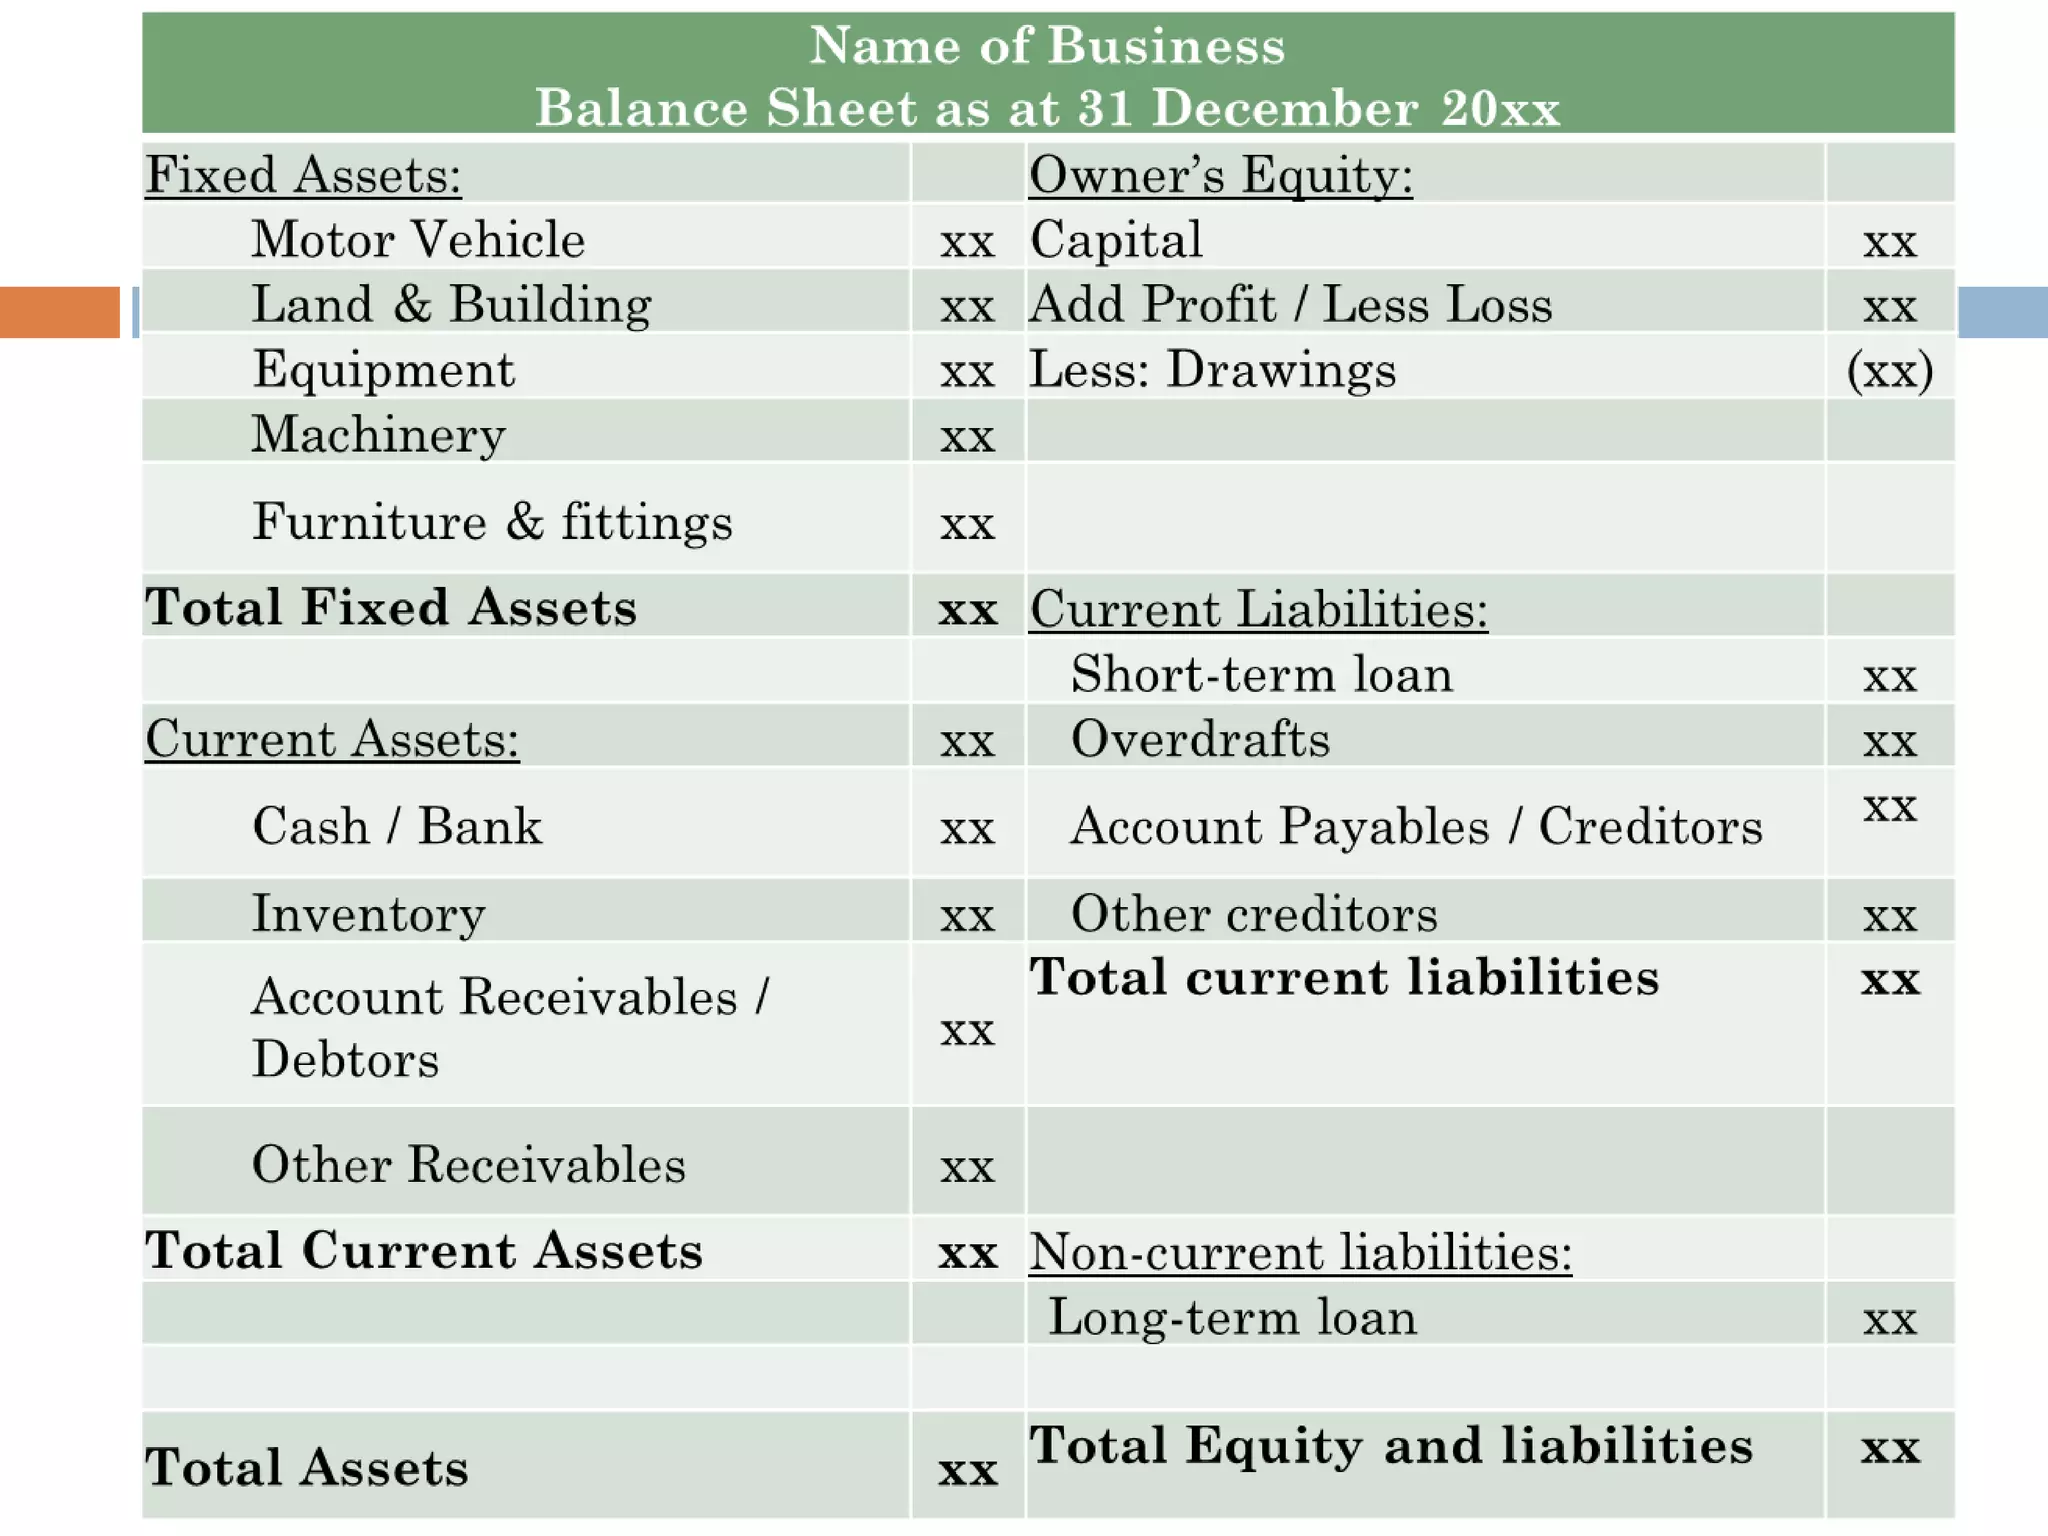
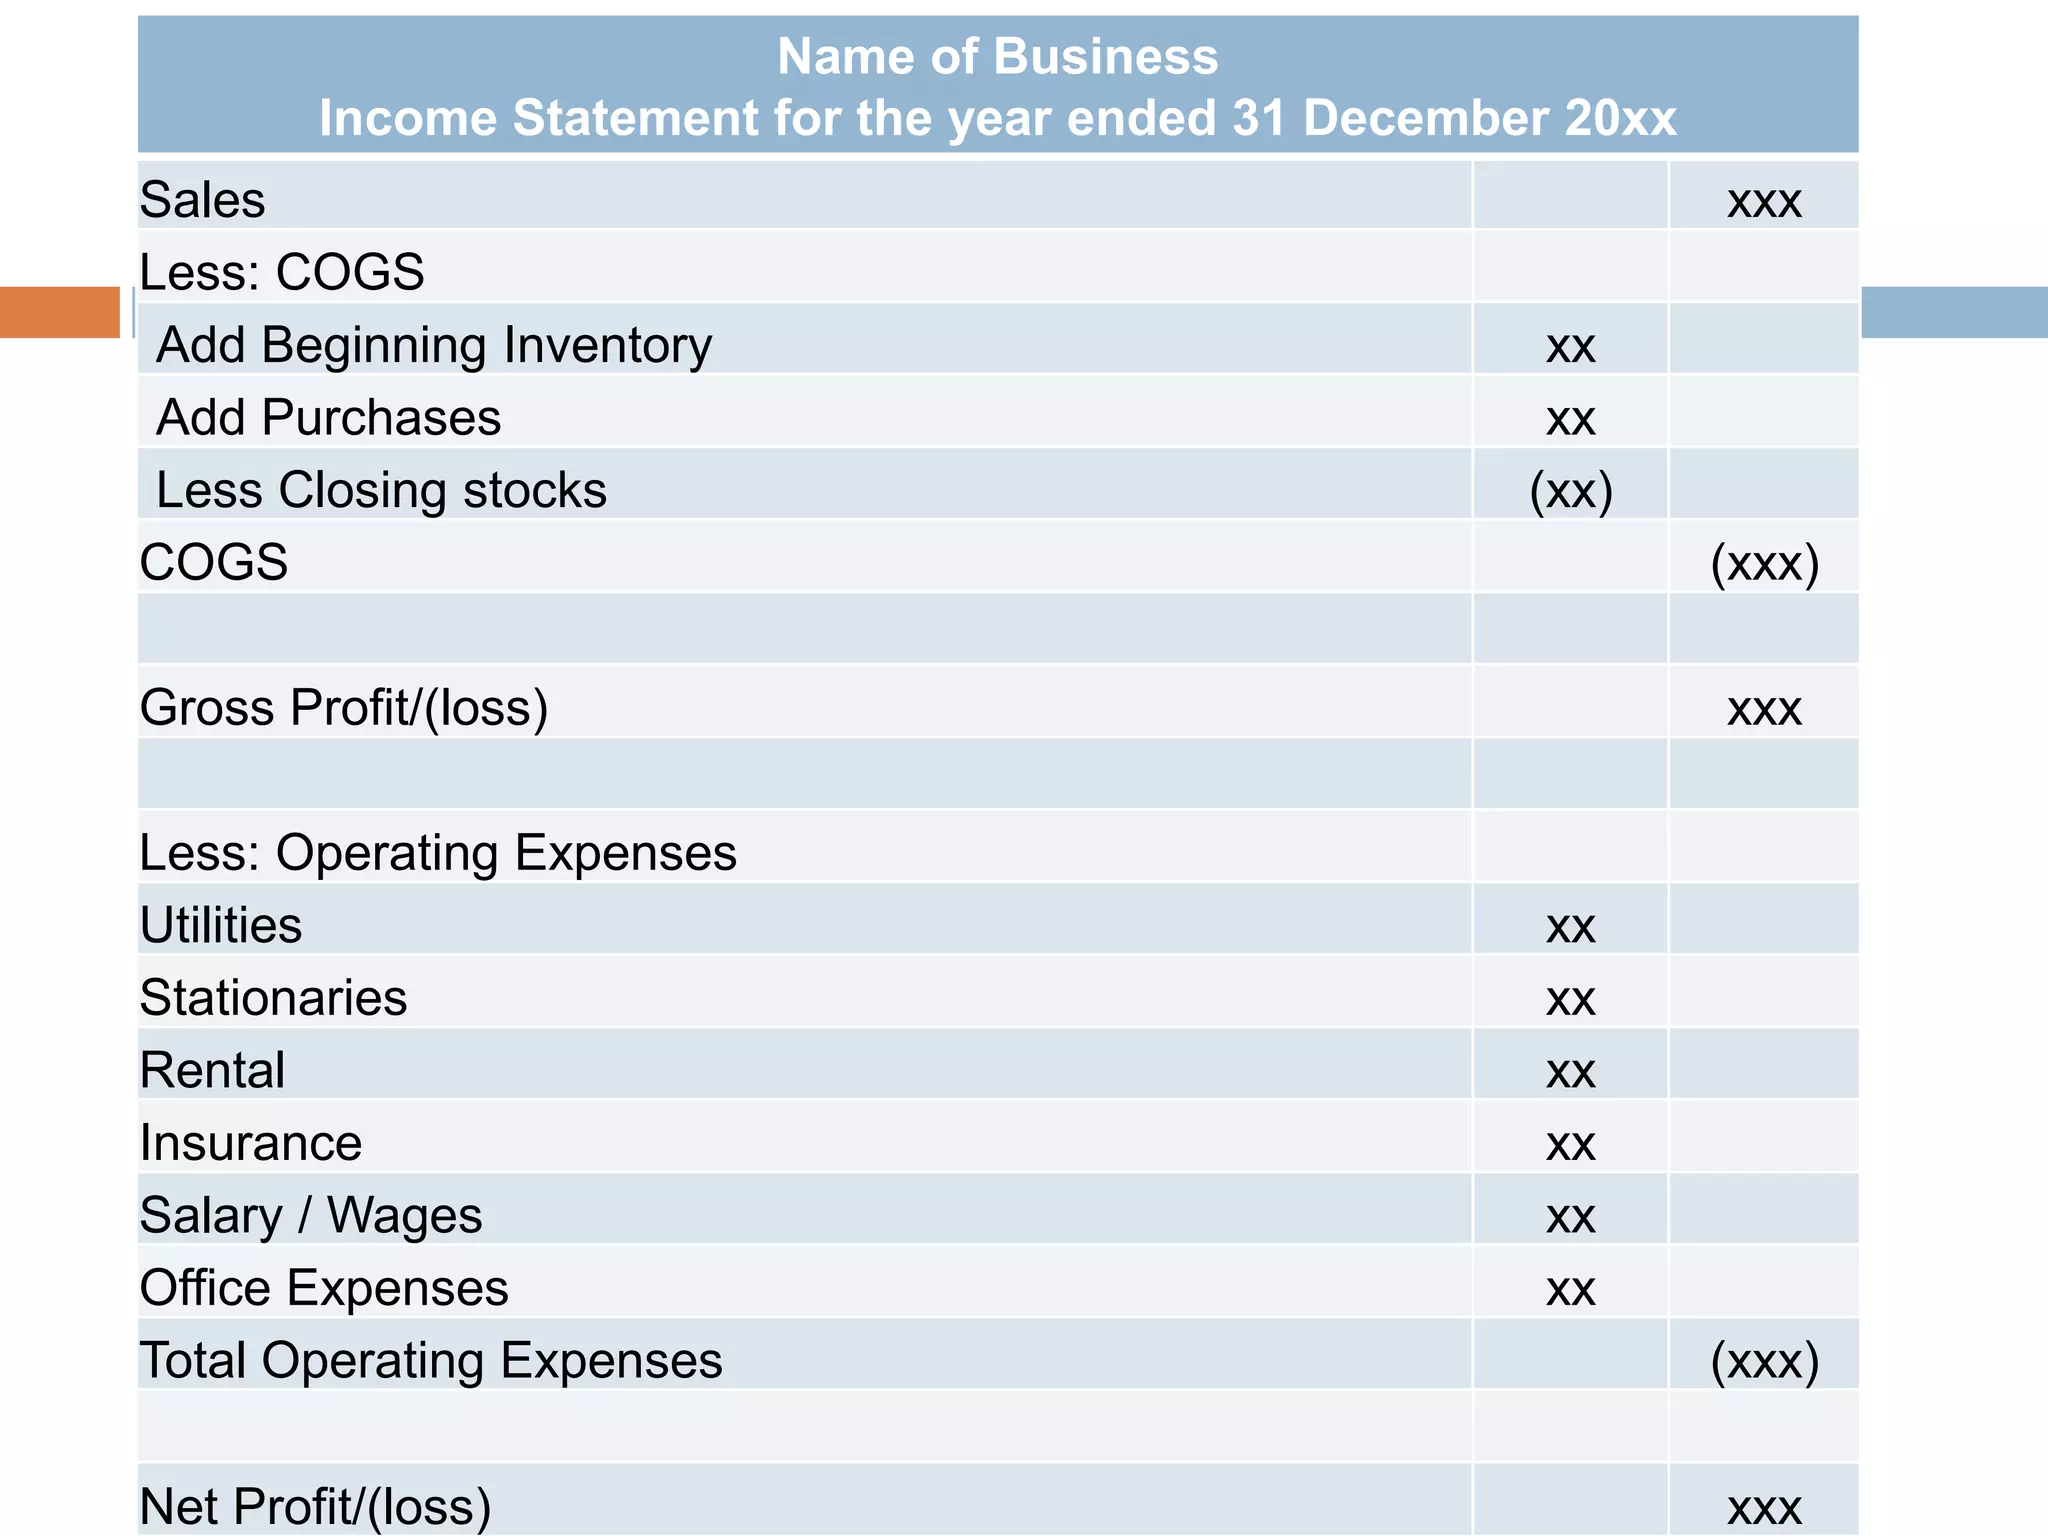
SlideShare a Scribd company logo
CHAPTER 2 ANALYSIS
OF FINANCIAL
STATEMENT
BAF2023 FFM
Learning Outcomes
 Explain the use of ratios can help to analyze
the profitability, liquidity, efficiency and capital
structure of business
 Calculate main accounting ratios
 Interpret the results of calculating accounting
ratios
 Explain the investors’ choice in choosing
between shares and debentures
 Explain trend analysis
 Explain limitations of accounting statements
Topic Outlines
Profitability Ratios
 1 Return on Capital Employed
(ROCE)
 2 Gross Profit Margin
 3 Net Profit Margin
 4 Return on Assets
 5 Return on Equity
Liquidity Ratios
 1 Current Ratio
 2 Quick Ratio/ Acid Test Ratio
 3 Times Interest Earned Ratio
Efficiency Ratios
 1 Inventory Turnover Ratio
 2 Accounts Receivable Turnover
Ratio
 3 Day Sales Outstanding
 4 Accounts Payable Turnover Ratio
 5 Asset Turnover Ratio
Shareholder Ratios
 1 Earnings per share
 2 Price/Earnings Ratio (P/E)
 3 Dividend Yield
Capital Structure Ratios
 1 Gearing Ratio
Users of Ratio
• Shareholders, management, employees,
creditors, competitors, potential investors
Profitability
• Shareholders, suppliers, creditors,
competitors
Liquidity
• Shareholders, potential purchasers,
competitors
Efficiency
• Shareholders, potential investors
Shareholder
• Shareholders, lenders, creditors, potential
investors
Capital structure
Name of Business
Income Statement for the year ended 31 December 20xx
Sales xxx
Less: COGS
Add Beginning Inventory xx
Add Purchases xx
Less Closing stocks (xx)
COGS (xxx)
Gross Profit/(loss) xxx
Less: Operating Expenses
Utilities xx
Stationaries xx
Rental xx
Insurance xx
Salary / Wages xx
Office Expenses xx
Total Operating Expenses (xxx)
Net Profit/(loss) xxx
Why use Ratio?
 Ratio analysis is a useful management tool
that will improve your understanding of
financial results and trends over time, and
provide key indicators of organizational
performance. Managers will use ratio
analysis to pinpoint strengths and
weaknesses from which strategies and
initiatives can be formed.
Why use Ratio?
 Company A
 2017
 Profit = RM25,000
 2018
 Profit = RM49,000
 Company B
 2017
 Profit = RM1,675,000
 2018
 Profit = RM1,839,500
Which is a better company?
a) Performance
b) Value
c) Size
Profitability Ratio
Financial metrics that are used to assess a
business’s ability to generate earnings as
compared to its expenses and other relevant
costs incurred during a specific period of
time.
Most of these ratios, having higher value
relative to a competitor’s ratio or the same
ratio from a previous period is indicative that
the company is doing well.
How many example of ratio will be covered?
Return on Capital Employed
Measures a company’s profitability and the efficiency with
which its capital is employed
Capital employed is the sum shareholders’ equity and debt
liabilities (Total Assets – Current Liabilities)
Often calculated based on ‘Average Capital Employed’ which
takes the average of opening and closing capital employed
for the time period
Higher ROCE indicates more efficient use of capital ( should
be higher than the company’s capital cost, otherwise it
indicates that the company is not employing its capital
effectively and is not generating shareholder value)
 Earnings Before Interest and Tax (EBIT) / Capital
Employed
Gross/Net Profit margin
Is the percentage of revenue after expenses have been
deducted from sales
Measurement reveals the amount of profit that a business
can extract from its total sales
Intended to be a measure of the overall success of a
business
A high profit margin indicates business is pricing its products
correctly and is exercising good cost control
 Gross Profit or Net Profit / Sales
Return on Assets
Measures the net income produced by total assets during a
period by comparing net income to the average total assets
Measures how efficiently a company can manage its assets
to produce profits during a period
Measure how effectively a company can turn earn a return on
its investment in assets
Shows how efficiently a company can convert the money
used to purchase assets into net income or profits
 Net Profit/ Total Assets
Return on Equity
Measures the ability of a firm to generate profits from its
shareholders investments in the company
Shows how much profit each dollar of common stockholders’
equity generates
Show how effective management is at using equity financing
( money from shareholders) to fund operations and grow the
company
Higher ROE indicates the company is using its investors'’
fund effectively
 Net Income/ Equity
Liquidity Ratios
Determine a company’s ability to pay off its short-term debts
obligations
The higher the value of the ratio, the larger the margin of
safety that the company possesses to cover short-term debts
Analyze the ability of a company to pay off both its current
liabilities as they become due as well as their long term
liabilities as they become current
Show cash levels of a company and ability to turn other
assets into cash to pay off liabilities and other current
obligations
 How many ratios will be covered?
Current ratio
Measures a firm’s ability to pay off its short term liabilities
with its current assets
Companies with larger amounts of current assets will easily
pay off current liabilities when they become due without
having to sell long-term, revenue generating assets
Help investors and creditors understand the liquidity of a
company and how easily that a company will be able to pay
off its current liabilities
A higher current ratio more favorable than a lower current
ratio because it shows the company can easily pay current
debt
 Current Assets / Current Liabilities
Quick ratio/ Acid Test ratio
Ability of a company to pay its current liabilities when
they come due with only quick assets
Quick assets are current assets that can be converted
to cash within 90 days or in the short term (cash, cash
equivalents, short term investments or marketable
securities and current account receivables)
Higher quick ratios more favorable because it shows
there are more quick assets than current liabilities
Current Assets – Inventory / Current Liabilities
Times Interest Earned ratio
Also known as interest coverage ratio
Measures the proportionate amount of income that can be
used to cover interest expenses in the future
Measures a firm’s ability to make interest and debt service
payments
Interest expenses considered to be fixed expenses, if the
company can’t make the payments, it could go bankrupt and
cease to exist
Ratio indicates how many times a company could pay the
interest with its before tax income, so larger ratios are
considered more favorable than smaller ratios
 Earning before Tax and Interest/ Interest
Efficiency Ratio
 measure a company's ability to use its assets
and manage its liabilities effectively.
Inventory turnover ratio
Show how effectively inventory is managed by
comparing cost of goods sold with average
inventory for a period
Measures how many times average inventory is
turned or sold during a period
Measures how many times a company sold its
total average inventory dollar amount during the
year
Cost of Good sold / Inventory
Account receivables turnover
ratio
Measures how many times a business can turn its
accounts receivable into cash during the period
How many times a business can collect its average
accounts receivables during the year
Show how efficient a company is collecting its credit
sales from customers
Higher efficiency is favorable from a cash flow ( the
sooner the company collect cash from customer, it will
be able to pay bills and other obligations sooner)
 Sales /Average Account receivables
Days Sales Outstanding
 Average collection period or days’ sales in receivables
 Measures the number of days it takes a company to collect cash
from its credit sales
 Shows the liquidity and efficiency of a company’s collections
department
 Shows how well a company can collect cash from its customers
 The sooner cash can be collected, the sooner this cash can be
used for other operations
 Lower ratio is more favorable because it means companies collect
cash earlier from customers
 365 days / Receivable Turnover ratio
Account payable turnover ratio
Shows a company’s ability to pay off its accounts
payable by comparing net credit purchases to the
average accounts payable during a period
Show how many times a company can pay off its
average accounts payable balance during the course
of a year
It is used by suppliers and creditors to help decide
whether or not to grant credit to business
A higher ratio shows suppliers and creditors that the
company pays its bills frequently and regularly
Purchase / Average account payable
Asset turnover ratio
 The asset turnover ratio is an efficiency ratio that
measures a company’s ability to generate sales from its
assets by comparing net sales with average total assets.
 In other words, this ratio shows how efficiently a
company can use its assets to generate sales.
 The total asset turnover ratio calculates net sales as a
percentage of assets to show how many sales are
generated from each dollar of company assets. For
instance, a ratio of .5 means that each dollar of assets
generates 50 cents of sales.
 Sales / total assets
Shareholder Ratio
 The shareholder equity ratio determines how
much shareholders would receive in the event
of a company-wide liquidation.
 The ratio, expressed as a percentage, is
calculated by dividing total shareholders'
equity by total assets of the firm, and it
represents the amount of assets on which
shareholders have a residual claim.
Earning per share
Also known as net income per share
Measures the amount of net income earned per
share of stock outstanding
Shows how profitable a company is on a shareholders
basis
Higher EPS us always better than a lower ratio
because this means the company is more profitable (
company has more profits to distribute to its
shareholders)
Higher EPS often makes the stock price of a company
rise
Price Earning ratio
Is a market prospect ratio that calculates the market value of
a stock relative to its earnings by comparing the market price
per share by the earnings per share
Shows what the market is willing to pay for a stock based on
its current earnings
Evaluate what a stock’s fair market value by predicting future
earnings per share (higher future earnings are expected to
issue higher dividends)
Company with higher P/E ratio indicated positive future
performance and investors are willing to pay more for this
company’s shares
Price per share / earning per share
Dividend Yield
Measures the amount of cash dividends distributed to
common shareholders to the market value per share
Used by investors to show how their investment in
stock is generating either cash flows in the form of
dividends or increases in asset value by stock
appreciation
Investors want to know how much dividends they are
getting for every dollar that the stock is worth
Company with high dividend yield pay its investors a
large dividend compared to the fair market value of
the stock
Capital Structure
Capital structure is how a firm finances its overall
operations and growth by using different sources
of funds
Debt comes in the form of bond issues or long
term notes payable, while equity is classified as
common stock, preferred stock or retained
earnings
Short term debt such as working capital
requirements also considered to be part of the
capital structure
Gearing ratio
Measures the proportion of a company’s borrowed funds to
its equity
Indicates the financial risk to which a business is subjected,
since excessive debt can lead to financial difficulties
A high gearing ratio represents a high proportion of debt to
equity (great deal of leverage, where company is using debt
to pay for its continuing operations)
A low gearing ratio may be indicative of conservative financial
management, but also mean a company is located in a high
cyclical industry
 Long term liabilities / capital employed
Choosing between shares and
debentures
 Lower Risk
 Debenture holders have their interest paid to them whether or not
profits are made
 If there is insufficient cash funds available to pay debenture
dividends, many debentures give their holders the right to sell of
some or all of the assets of the company, to recoup the amount of
their debentures before anyone else has a claim
 Ranks above the shares of that same company
 Medium Risk
 Preference shareholders have their dividends paid after the
debenture interest has been paid, but before the ordinary
shareholders
 Still dependent upon the profits being available for distribution
 Highest Risk
 Ordinary shareholders ( must give way to both debenture holders and
to preference shares for interest and dividends)
 Ordinary shareholders ( must give way to both debenture holders and
to preference shares for interest and dividends)
 However, should the remaining profits for distribution be very high
then they may get a high return on their money
Trend Analysis
One of the tools for the analysis of the company’s
monetary statements for the investment purposes
To determine the financial position of the business
The financial statements of the company are compared
with each other for several years after converted into
percentage form in order to compare them with each
other
Trend analysis percentage = (figure of the previous
period- figure of the current period) / total both figures
If the current-year percentages were greater than
previous year percentage (current-year result is better
Limitation of Accounting
statement
Impossible to sensibly compare two businesses which are
completely unlike one another
Compare a supermarket’s figures with those of a
chemical factory would be rather pointless
A lot of other factors that the past-focused financial
statements do not disclose
Desire to keep money measurement concept, objectives
will exclude great deal of desirable information
Comparative ratios and
benchmarking
Comparisons –a company’s ratios are
compared with those of other firms in the
same industry, that is, to industry average
figures.
Benchmarking –compare ratios with
those a smaller set of leading companies
END OF
CHAPTERS
THANK YOU
FOR YOUR

More Related Content

What's hot

Financial Statement Analysis: Learn The Best Tricks And Tips!
Financial Statement Analysis: Learn The Best Tricks And Tips!Financial Statement Analysis: Learn The Best Tricks And Tips!
Financial Statement Analysis: Learn The Best Tricks And Tips!
Andrew Li
 
Chapter 5 capital budgeting
Chapter 5 capital budgetingChapter 5 capital budgeting
Chapter 5 capital budgeting
SamsonJohn14
 
Abdm4223 lecture week 9 290612
Abdm4223 lecture week 9 290612Abdm4223 lecture week 9 290612
Abdm4223 lecture week 9 290612
Stephen Ong
 
Working Capital Management
Working Capital ManagementWorking Capital Management
Working Capital ManagementDayasagar S
 
Akaun Chapter 7
Akaun Chapter 7Akaun Chapter 7
Akaun Chapter 7WanBK Leo
 
Analysis & interpretation of financial statements
Analysis & interpretation of financial statementsAnalysis & interpretation of financial statements
Analysis & interpretation of financial statementsry_moore
 
Financial ratios
Financial ratiosFinancial ratios
Financial ratios
Faltu Focat
 
accounts ppt on ratio analysis
accounts ppt on ratio analysisaccounts ppt on ratio analysis
accounts ppt on ratio analysisvaishali_bansal
 
Ratio analysis
Ratio analysisRatio analysis
Ratio analysis
Prasanth Khanna
 
Financial ratios
Financial ratiosFinancial ratios
Financial ratioselthea18
 
Ratio analysis
Ratio analysisRatio analysis
Ratio analysis
Karthik Rao [LION]
 
Bba 2204 fin mgt week 3 financial ratios
Bba 2204 fin mgt week 3 financial ratiosBba 2204 fin mgt week 3 financial ratios
Bba 2204 fin mgt week 3 financial ratios
Stephen Ong
 
ADM 658: Chapter 3 - Financial Analysis (Ratio)
ADM 658: Chapter 3 - Financial Analysis (Ratio)ADM 658: Chapter 3 - Financial Analysis (Ratio)
ADM 658: Chapter 3 - Financial Analysis (Ratio)FSPPP - UiTM ( AM225 )
 
Chapter 9-ratio-analysis121
Chapter 9-ratio-analysis121Chapter 9-ratio-analysis121
Chapter 9-ratio-analysis121Anjaneyulu Bandi
 
Financial statement analysis types & techniques
Financial statement analysis types & techniquesFinancial statement analysis types & techniques
Financial statement analysis types & techniquesDr. Abzal Basha
 
Types of Ratio analyis and their significance
Types of Ratio analyis and their significanceTypes of Ratio analyis and their significance
Types of Ratio analyis and their significance
Fred Mmbololo
 

What's hot (19)

Financial Statement Analysis: Learn The Best Tricks And Tips!
Financial Statement Analysis: Learn The Best Tricks And Tips!Financial Statement Analysis: Learn The Best Tricks And Tips!
Financial Statement Analysis: Learn The Best Tricks And Tips!
 
Chapter 5 capital budgeting
Chapter 5 capital budgetingChapter 5 capital budgeting
Chapter 5 capital budgeting
 
Abdm4223 lecture week 9 290612
Abdm4223 lecture week 9 290612Abdm4223 lecture week 9 290612
Abdm4223 lecture week 9 290612
 
Ratio analysis....
Ratio analysis....Ratio analysis....
Ratio analysis....
 
Working Capital Management
Working Capital ManagementWorking Capital Management
Working Capital Management
 
Akaun Chapter 7
Akaun Chapter 7Akaun Chapter 7
Akaun Chapter 7
 
Analysis & interpretation of financial statements
Analysis & interpretation of financial statementsAnalysis & interpretation of financial statements
Analysis & interpretation of financial statements
 
2 ratio analysis
2 ratio analysis2 ratio analysis
2 ratio analysis
 
Financial ratios
Financial ratiosFinancial ratios
Financial ratios
 
accounts ppt on ratio analysis
accounts ppt on ratio analysisaccounts ppt on ratio analysis
accounts ppt on ratio analysis
 
Ratio analysis
Ratio analysisRatio analysis
Ratio analysis
 
6 ratio analysis
6   ratio analysis6   ratio analysis
6 ratio analysis
 
Financial ratios
Financial ratiosFinancial ratios
Financial ratios
 
Ratio analysis
Ratio analysisRatio analysis
Ratio analysis
 
Bba 2204 fin mgt week 3 financial ratios
Bba 2204 fin mgt week 3 financial ratiosBba 2204 fin mgt week 3 financial ratios
Bba 2204 fin mgt week 3 financial ratios
 
ADM 658: Chapter 3 - Financial Analysis (Ratio)
ADM 658: Chapter 3 - Financial Analysis (Ratio)ADM 658: Chapter 3 - Financial Analysis (Ratio)
ADM 658: Chapter 3 - Financial Analysis (Ratio)
 
Chapter 9-ratio-analysis121
Chapter 9-ratio-analysis121Chapter 9-ratio-analysis121
Chapter 9-ratio-analysis121
 
Financial statement analysis types & techniques
Financial statement analysis types & techniquesFinancial statement analysis types & techniques
Financial statement analysis types & techniques
 
Types of Ratio analyis and their significance
Types of Ratio analyis and their significanceTypes of Ratio analyis and their significance
Types of Ratio analyis and their significance
 

Similar to Chapter 2 analysis of financial statements

C:\Fakepath\44 Ratio Analysis 1
C:\Fakepath\44 Ratio Analysis 1 C:\Fakepath\44 Ratio Analysis 1
C:\Fakepath\44 Ratio Analysis 1 guestb31b11
 
Chapter 6_Interpretation of Financial Statement
Chapter 6_Interpretation of Financial StatementChapter 6_Interpretation of Financial Statement
Chapter 6_Interpretation of Financial Statement
Presana1
 
CH 4 PART 1 RATIO ANALYSIS.pdf
CH 4 PART 1 RATIO ANALYSIS.pdfCH 4 PART 1 RATIO ANALYSIS.pdf
CH 4 PART 1 RATIO ANALYSIS.pdf
IkaQoma
 
Instructional intervention work sheet
Instructional intervention work sheetInstructional intervention work sheet
Instructional intervention work sheetFeljone Ragma
 
Ratio analysis
Ratio analysisRatio analysis
Ratio analysis
VadivelM9
 
Ratio Analysis
Ratio AnalysisRatio Analysis
Ratio Analysis
VadivelM9
 
90-ratio.pdf
90-ratio.pdf90-ratio.pdf
90-ratio.pdf
Dhrupal Tripathi
 
Ratio Analysis Ppt
Ratio Analysis PptRatio Analysis Ppt
Ratio Analysis PptMobasher Ali
 
Business analysis ppt
Business analysis ppt Business analysis ppt
Business analysis ppt
Babasab Patil
 
Financial analysis for juhayna & domty co . graduation project zagzig uni...
Financial analysis for juhayna & domty co . graduation project zagzig uni...Financial analysis for juhayna & domty co . graduation project zagzig uni...
Financial analysis for juhayna & domty co . graduation project zagzig uni...
Eslam Fathi
 
Ratios and Formulas in Customer Financial AnalysisFinancial stat.docx
Ratios and Formulas in Customer Financial AnalysisFinancial stat.docxRatios and Formulas in Customer Financial AnalysisFinancial stat.docx
Ratios and Formulas in Customer Financial AnalysisFinancial stat.docx
catheryncouper
 
Ratio analysis
Ratio analysisRatio analysis
Ratio analysis
Dr. Bhavik Shah
 
17 Key Financial Ratios
17 Key Financial Ratios17 Key Financial Ratios
17 Key Financial Ratios
Value Stock Guide
 
accounting important regarding the importance of accounting in accounts
accounting important regarding the importance of accounting in accountsaccounting important regarding the importance of accounting in accounts
accounting important regarding the importance of accounting in accounts
balckstone358
 
elearm.pdf
elearm.pdfelearm.pdf
Ratio analysis of maruti suzuzki india ltd
Ratio analysis of maruti suzuzki india ltdRatio analysis of maruti suzuzki india ltd
Ratio analysis of maruti suzuzki india ltd
ravneetubs
 
Financial statement analysis
Financial statement analysisFinancial statement analysis
Financial statement analysisNikhiliit
 
Business analysis ppt babasab patil
Business analysis ppt babasab patil Business analysis ppt babasab patil
Business analysis ppt babasab patil
Babasab Patil
 
RATIO ANALYSIS
RATIO ANALYSISRATIO ANALYSIS
RATIO ANALYSIS
Nikhil Priya
 

Similar to Chapter 2 analysis of financial statements (20)

C:\Fakepath\44 Ratio Analysis 1
C:\Fakepath\44 Ratio Analysis 1 C:\Fakepath\44 Ratio Analysis 1
C:\Fakepath\44 Ratio Analysis 1
 
Chapter 6_Interpretation of Financial Statement
Chapter 6_Interpretation of Financial StatementChapter 6_Interpretation of Financial Statement
Chapter 6_Interpretation of Financial Statement
 
CH 4 PART 1 RATIO ANALYSIS.pdf
CH 4 PART 1 RATIO ANALYSIS.pdfCH 4 PART 1 RATIO ANALYSIS.pdf
CH 4 PART 1 RATIO ANALYSIS.pdf
 
Instructional intervention work sheet
Instructional intervention work sheetInstructional intervention work sheet
Instructional intervention work sheet
 
Ratio analysis
Ratio analysisRatio analysis
Ratio analysis
 
Ratio Analysis
Ratio AnalysisRatio Analysis
Ratio Analysis
 
90-ratio.pdf
90-ratio.pdf90-ratio.pdf
90-ratio.pdf
 
Ratio Analysis Ppt
Ratio Analysis PptRatio Analysis Ppt
Ratio Analysis Ppt
 
Business analysis ppt
Business analysis ppt Business analysis ppt
Business analysis ppt
 
Financial analysis for juhayna & domty co . graduation project zagzig uni...
Financial analysis for juhayna & domty co . graduation project zagzig uni...Financial analysis for juhayna & domty co . graduation project zagzig uni...
Financial analysis for juhayna & domty co . graduation project zagzig uni...
 
Ratios and Formulas in Customer Financial AnalysisFinancial stat.docx
Ratios and Formulas in Customer Financial AnalysisFinancial stat.docxRatios and Formulas in Customer Financial AnalysisFinancial stat.docx
Ratios and Formulas in Customer Financial AnalysisFinancial stat.docx
 
Ratio analysis
Ratio analysisRatio analysis
Ratio analysis
 
17 Key Financial Ratios
17 Key Financial Ratios17 Key Financial Ratios
17 Key Financial Ratios
 
accounting important regarding the importance of accounting in accounts
accounting important regarding the importance of accounting in accountsaccounting important regarding the importance of accounting in accounts
accounting important regarding the importance of accounting in accounts
 
elearm.pdf
elearm.pdfelearm.pdf
elearm.pdf
 
Ratio analysis1
Ratio analysis1Ratio analysis1
Ratio analysis1
 
Ratio analysis of maruti suzuzki india ltd
Ratio analysis of maruti suzuzki india ltdRatio analysis of maruti suzuzki india ltd
Ratio analysis of maruti suzuzki india ltd
 
Financial statement analysis
Financial statement analysisFinancial statement analysis
Financial statement analysis
 
Business analysis ppt babasab patil
Business analysis ppt babasab patil Business analysis ppt babasab patil
Business analysis ppt babasab patil
 
RATIO ANALYSIS
RATIO ANALYSISRATIO ANALYSIS
RATIO ANALYSIS
 

Recently uploaded

Gen AI Study Jams _ For the GDSC Leads in India.pdf
Gen AI Study Jams _ For the GDSC Leads in India.pdfGen AI Study Jams _ For the GDSC Leads in India.pdf
Gen AI Study Jams _ For the GDSC Leads in India.pdf
gdsczhcet
 
Nuclear Power Economics and Structuring 2024
Nuclear Power Economics and Structuring 2024Nuclear Power Economics and Structuring 2024
Nuclear Power Economics and Structuring 2024
Massimo Talia
 
weather web application report.pdf
weather web application report.pdfweather web application report.pdf
weather web application report.pdf
Pratik Pawar
 
Fundamentals of Electric Drives and its applications.pptx
Fundamentals of Electric Drives and its applications.pptxFundamentals of Electric Drives and its applications.pptx
Fundamentals of Electric Drives and its applications.pptx
manasideore6
 
ethical hacking in wireless-hacking1.ppt
ethical hacking in wireless-hacking1.pptethical hacking in wireless-hacking1.ppt
ethical hacking in wireless-hacking1.ppt
Jayaprasanna4
 
Standard Reomte Control Interface - Neometrix
Standard Reomte Control Interface - NeometrixStandard Reomte Control Interface - Neometrix
Standard Reomte Control Interface - Neometrix
Neometrix_Engineering_Pvt_Ltd
 
MCQ Soil mechanics questions (Soil shear strength).pdf
MCQ Soil mechanics questions (Soil shear strength).pdfMCQ Soil mechanics questions (Soil shear strength).pdf
MCQ Soil mechanics questions (Soil shear strength).pdf
Osamah Alsalih
 
Immunizing Image Classifiers Against Localized Adversary Attacks
Immunizing Image Classifiers Against Localized Adversary AttacksImmunizing Image Classifiers Against Localized Adversary Attacks
Immunizing Image Classifiers Against Localized Adversary Attacks
gerogepatton
 
road safety engineering r s e unit 3.pdf
road safety engineering  r s e unit 3.pdfroad safety engineering  r s e unit 3.pdf
road safety engineering r s e unit 3.pdf
VENKATESHvenky89705
 
ML for identifying fraud using open blockchain data.pptx
ML for identifying fraud using open blockchain data.pptxML for identifying fraud using open blockchain data.pptx
ML for identifying fraud using open blockchain data.pptx
Vijay Dialani, PhD
 
Water Industry Process Automation and Control Monthly - May 2024.pdf
Water Industry Process Automation and Control Monthly - May 2024.pdfWater Industry Process Automation and Control Monthly - May 2024.pdf
Water Industry Process Automation and Control Monthly - May 2024.pdf
Water Industry Process Automation & Control
 
Top 10 Oil and Gas Projects in Saudi Arabia 2024.pdf
Top 10 Oil and Gas Projects in Saudi Arabia 2024.pdfTop 10 Oil and Gas Projects in Saudi Arabia 2024.pdf
Top 10 Oil and Gas Projects in Saudi Arabia 2024.pdf
Teleport Manpower Consultant
 
Railway Signalling Principles Edition 3.pdf
Railway Signalling Principles Edition 3.pdfRailway Signalling Principles Edition 3.pdf
Railway Signalling Principles Edition 3.pdf
TeeVichai
 
WATER CRISIS and its solutions-pptx 1234
WATER CRISIS and its solutions-pptx 1234WATER CRISIS and its solutions-pptx 1234
WATER CRISIS and its solutions-pptx 1234
AafreenAbuthahir2
 
AP LAB PPT.pdf ap lab ppt no title specific
AP LAB PPT.pdf ap lab ppt no title specificAP LAB PPT.pdf ap lab ppt no title specific
AP LAB PPT.pdf ap lab ppt no title specific
BrazilAccount1
 
J.Yang, ICLR 2024, MLILAB, KAIST AI.pdf
J.Yang,  ICLR 2024, MLILAB, KAIST AI.pdfJ.Yang,  ICLR 2024, MLILAB, KAIST AI.pdf
J.Yang, ICLR 2024, MLILAB, KAIST AI.pdf
MLILAB
 
一比一原版(IIT毕业证)伊利诺伊理工大学毕业证成绩单专业办理
一比一原版(IIT毕业证)伊利诺伊理工大学毕业证成绩单专业办理一比一原版(IIT毕业证)伊利诺伊理工大学毕业证成绩单专业办理
一比一原版(IIT毕业证)伊利诺伊理工大学毕业证成绩单专业办理
zwunae
 
AKS UNIVERSITY Satna Final Year Project By OM Hardaha.pdf
AKS UNIVERSITY Satna Final Year Project By OM Hardaha.pdfAKS UNIVERSITY Satna Final Year Project By OM Hardaha.pdf
AKS UNIVERSITY Satna Final Year Project By OM Hardaha.pdf
SamSarthak3
 
一比一原版(SFU毕业证)西蒙菲莎大学毕业证成绩单如何办理
一比一原版(SFU毕业证)西蒙菲莎大学毕业证成绩单如何办理一比一原版(SFU毕业证)西蒙菲莎大学毕业证成绩单如何办理
一比一原版(SFU毕业证)西蒙菲莎大学毕业证成绩单如何办理
bakpo1
 
Architectural Portfolio Sean Lockwood
Architectural Portfolio Sean LockwoodArchitectural Portfolio Sean Lockwood
Architectural Portfolio Sean Lockwood
seandesed
 

Recently uploaded (20)

Gen AI Study Jams _ For the GDSC Leads in India.pdf
Gen AI Study Jams _ For the GDSC Leads in India.pdfGen AI Study Jams _ For the GDSC Leads in India.pdf
Gen AI Study Jams _ For the GDSC Leads in India.pdf
 
Nuclear Power Economics and Structuring 2024
Nuclear Power Economics and Structuring 2024Nuclear Power Economics and Structuring 2024
Nuclear Power Economics and Structuring 2024
 
weather web application report.pdf
weather web application report.pdfweather web application report.pdf
weather web application report.pdf
 
Fundamentals of Electric Drives and its applications.pptx
Fundamentals of Electric Drives and its applications.pptxFundamentals of Electric Drives and its applications.pptx
Fundamentals of Electric Drives and its applications.pptx
 
ethical hacking in wireless-hacking1.ppt
ethical hacking in wireless-hacking1.pptethical hacking in wireless-hacking1.ppt
ethical hacking in wireless-hacking1.ppt
 
Standard Reomte Control Interface - Neometrix
Standard Reomte Control Interface - NeometrixStandard Reomte Control Interface - Neometrix
Standard Reomte Control Interface - Neometrix
 
MCQ Soil mechanics questions (Soil shear strength).pdf
MCQ Soil mechanics questions (Soil shear strength).pdfMCQ Soil mechanics questions (Soil shear strength).pdf
MCQ Soil mechanics questions (Soil shear strength).pdf
 
Immunizing Image Classifiers Against Localized Adversary Attacks
Immunizing Image Classifiers Against Localized Adversary AttacksImmunizing Image Classifiers Against Localized Adversary Attacks
Immunizing Image Classifiers Against Localized Adversary Attacks
 
road safety engineering r s e unit 3.pdf
road safety engineering  r s e unit 3.pdfroad safety engineering  r s e unit 3.pdf
road safety engineering r s e unit 3.pdf
 
ML for identifying fraud using open blockchain data.pptx
ML for identifying fraud using open blockchain data.pptxML for identifying fraud using open blockchain data.pptx
ML for identifying fraud using open blockchain data.pptx
 
Water Industry Process Automation and Control Monthly - May 2024.pdf
Water Industry Process Automation and Control Monthly - May 2024.pdfWater Industry Process Automation and Control Monthly - May 2024.pdf
Water Industry Process Automation and Control Monthly - May 2024.pdf
 
Top 10 Oil and Gas Projects in Saudi Arabia 2024.pdf
Top 10 Oil and Gas Projects in Saudi Arabia 2024.pdfTop 10 Oil and Gas Projects in Saudi Arabia 2024.pdf
Top 10 Oil and Gas Projects in Saudi Arabia 2024.pdf
 
Railway Signalling Principles Edition 3.pdf
Railway Signalling Principles Edition 3.pdfRailway Signalling Principles Edition 3.pdf
Railway Signalling Principles Edition 3.pdf
 
WATER CRISIS and its solutions-pptx 1234
WATER CRISIS and its solutions-pptx 1234WATER CRISIS and its solutions-pptx 1234
WATER CRISIS and its solutions-pptx 1234
 
AP LAB PPT.pdf ap lab ppt no title specific
AP LAB PPT.pdf ap lab ppt no title specificAP LAB PPT.pdf ap lab ppt no title specific
AP LAB PPT.pdf ap lab ppt no title specific
 
J.Yang, ICLR 2024, MLILAB, KAIST AI.pdf
J.Yang,  ICLR 2024, MLILAB, KAIST AI.pdfJ.Yang,  ICLR 2024, MLILAB, KAIST AI.pdf
J.Yang, ICLR 2024, MLILAB, KAIST AI.pdf
 
一比一原版(IIT毕业证)伊利诺伊理工大学毕业证成绩单专业办理
一比一原版(IIT毕业证)伊利诺伊理工大学毕业证成绩单专业办理一比一原版(IIT毕业证)伊利诺伊理工大学毕业证成绩单专业办理
一比一原版(IIT毕业证)伊利诺伊理工大学毕业证成绩单专业办理
 
AKS UNIVERSITY Satna Final Year Project By OM Hardaha.pdf
AKS UNIVERSITY Satna Final Year Project By OM Hardaha.pdfAKS UNIVERSITY Satna Final Year Project By OM Hardaha.pdf
AKS UNIVERSITY Satna Final Year Project By OM Hardaha.pdf
 
一比一原版(SFU毕业证)西蒙菲莎大学毕业证成绩单如何办理
一比一原版(SFU毕业证)西蒙菲莎大学毕业证成绩单如何办理一比一原版(SFU毕业证)西蒙菲莎大学毕业证成绩单如何办理
一比一原版(SFU毕业证)西蒙菲莎大学毕业证成绩单如何办理
 
Architectural Portfolio Sean Lockwood
Architectural Portfolio Sean LockwoodArchitectural Portfolio Sean Lockwood
Architectural Portfolio Sean Lockwood
 

Chapter 2 analysis of financial statements

  • 1. CHAPTER 2 ANALYSIS OF FINANCIAL STATEMENT BAF2023 FFM
  • 2. Learning Outcomes  Explain the use of ratios can help to analyze the profitability, liquidity, efficiency and capital structure of business  Calculate main accounting ratios  Interpret the results of calculating accounting ratios  Explain the investors’ choice in choosing between shares and debentures  Explain trend analysis  Explain limitations of accounting statements
  • 3. Topic Outlines Profitability Ratios  1 Return on Capital Employed (ROCE)  2 Gross Profit Margin  3 Net Profit Margin  4 Return on Assets  5 Return on Equity Liquidity Ratios  1 Current Ratio  2 Quick Ratio/ Acid Test Ratio  3 Times Interest Earned Ratio Efficiency Ratios  1 Inventory Turnover Ratio  2 Accounts Receivable Turnover Ratio  3 Day Sales Outstanding  4 Accounts Payable Turnover Ratio  5 Asset Turnover Ratio Shareholder Ratios  1 Earnings per share  2 Price/Earnings Ratio (P/E)  3 Dividend Yield Capital Structure Ratios  1 Gearing Ratio
  • 4. Users of Ratio • Shareholders, management, employees, creditors, competitors, potential investors Profitability • Shareholders, suppliers, creditors, competitors Liquidity • Shareholders, potential purchasers, competitors Efficiency • Shareholders, potential investors Shareholder • Shareholders, lenders, creditors, potential investors Capital structure
  • 5.
  • 6. Name of Business Income Statement for the year ended 31 December 20xx Sales xxx Less: COGS Add Beginning Inventory xx Add Purchases xx Less Closing stocks (xx) COGS (xxx) Gross Profit/(loss) xxx Less: Operating Expenses Utilities xx Stationaries xx Rental xx Insurance xx Salary / Wages xx Office Expenses xx Total Operating Expenses (xxx) Net Profit/(loss) xxx
  • 7. Why use Ratio?  Ratio analysis is a useful management tool that will improve your understanding of financial results and trends over time, and provide key indicators of organizational performance. Managers will use ratio analysis to pinpoint strengths and weaknesses from which strategies and initiatives can be formed.
  • 8. Why use Ratio?  Company A  2017  Profit = RM25,000  2018  Profit = RM49,000  Company B  2017  Profit = RM1,675,000  2018  Profit = RM1,839,500 Which is a better company? a) Performance b) Value c) Size
  • 9. Profitability Ratio Financial metrics that are used to assess a business’s ability to generate earnings as compared to its expenses and other relevant costs incurred during a specific period of time. Most of these ratios, having higher value relative to a competitor’s ratio or the same ratio from a previous period is indicative that the company is doing well. How many example of ratio will be covered?
  • 10. Return on Capital Employed Measures a company’s profitability and the efficiency with which its capital is employed Capital employed is the sum shareholders’ equity and debt liabilities (Total Assets – Current Liabilities) Often calculated based on ‘Average Capital Employed’ which takes the average of opening and closing capital employed for the time period Higher ROCE indicates more efficient use of capital ( should be higher than the company’s capital cost, otherwise it indicates that the company is not employing its capital effectively and is not generating shareholder value)  Earnings Before Interest and Tax (EBIT) / Capital Employed
  • 11. Gross/Net Profit margin Is the percentage of revenue after expenses have been deducted from sales Measurement reveals the amount of profit that a business can extract from its total sales Intended to be a measure of the overall success of a business A high profit margin indicates business is pricing its products correctly and is exercising good cost control  Gross Profit or Net Profit / Sales
  • 12. Return on Assets Measures the net income produced by total assets during a period by comparing net income to the average total assets Measures how efficiently a company can manage its assets to produce profits during a period Measure how effectively a company can turn earn a return on its investment in assets Shows how efficiently a company can convert the money used to purchase assets into net income or profits  Net Profit/ Total Assets
  • 13. Return on Equity Measures the ability of a firm to generate profits from its shareholders investments in the company Shows how much profit each dollar of common stockholders’ equity generates Show how effective management is at using equity financing ( money from shareholders) to fund operations and grow the company Higher ROE indicates the company is using its investors'’ fund effectively  Net Income/ Equity
  • 14. Liquidity Ratios Determine a company’s ability to pay off its short-term debts obligations The higher the value of the ratio, the larger the margin of safety that the company possesses to cover short-term debts Analyze the ability of a company to pay off both its current liabilities as they become due as well as their long term liabilities as they become current Show cash levels of a company and ability to turn other assets into cash to pay off liabilities and other current obligations  How many ratios will be covered?
  • 15.
  • 16. Current ratio Measures a firm’s ability to pay off its short term liabilities with its current assets Companies with larger amounts of current assets will easily pay off current liabilities when they become due without having to sell long-term, revenue generating assets Help investors and creditors understand the liquidity of a company and how easily that a company will be able to pay off its current liabilities A higher current ratio more favorable than a lower current ratio because it shows the company can easily pay current debt  Current Assets / Current Liabilities
  • 17. Quick ratio/ Acid Test ratio Ability of a company to pay its current liabilities when they come due with only quick assets Quick assets are current assets that can be converted to cash within 90 days or in the short term (cash, cash equivalents, short term investments or marketable securities and current account receivables) Higher quick ratios more favorable because it shows there are more quick assets than current liabilities Current Assets – Inventory / Current Liabilities
  • 18. Times Interest Earned ratio Also known as interest coverage ratio Measures the proportionate amount of income that can be used to cover interest expenses in the future Measures a firm’s ability to make interest and debt service payments Interest expenses considered to be fixed expenses, if the company can’t make the payments, it could go bankrupt and cease to exist Ratio indicates how many times a company could pay the interest with its before tax income, so larger ratios are considered more favorable than smaller ratios  Earning before Tax and Interest/ Interest
  • 19. Efficiency Ratio  measure a company's ability to use its assets and manage its liabilities effectively.
  • 20. Inventory turnover ratio Show how effectively inventory is managed by comparing cost of goods sold with average inventory for a period Measures how many times average inventory is turned or sold during a period Measures how many times a company sold its total average inventory dollar amount during the year Cost of Good sold / Inventory
  • 21. Account receivables turnover ratio Measures how many times a business can turn its accounts receivable into cash during the period How many times a business can collect its average accounts receivables during the year Show how efficient a company is collecting its credit sales from customers Higher efficiency is favorable from a cash flow ( the sooner the company collect cash from customer, it will be able to pay bills and other obligations sooner)  Sales /Average Account receivables
  • 22. Days Sales Outstanding  Average collection period or days’ sales in receivables  Measures the number of days it takes a company to collect cash from its credit sales  Shows the liquidity and efficiency of a company’s collections department  Shows how well a company can collect cash from its customers  The sooner cash can be collected, the sooner this cash can be used for other operations  Lower ratio is more favorable because it means companies collect cash earlier from customers  365 days / Receivable Turnover ratio
  • 23. Account payable turnover ratio Shows a company’s ability to pay off its accounts payable by comparing net credit purchases to the average accounts payable during a period Show how many times a company can pay off its average accounts payable balance during the course of a year It is used by suppliers and creditors to help decide whether or not to grant credit to business A higher ratio shows suppliers and creditors that the company pays its bills frequently and regularly Purchase / Average account payable
  • 24. Asset turnover ratio  The asset turnover ratio is an efficiency ratio that measures a company’s ability to generate sales from its assets by comparing net sales with average total assets.  In other words, this ratio shows how efficiently a company can use its assets to generate sales.  The total asset turnover ratio calculates net sales as a percentage of assets to show how many sales are generated from each dollar of company assets. For instance, a ratio of .5 means that each dollar of assets generates 50 cents of sales.  Sales / total assets
  • 25. Shareholder Ratio  The shareholder equity ratio determines how much shareholders would receive in the event of a company-wide liquidation.  The ratio, expressed as a percentage, is calculated by dividing total shareholders' equity by total assets of the firm, and it represents the amount of assets on which shareholders have a residual claim.
  • 26. Earning per share Also known as net income per share Measures the amount of net income earned per share of stock outstanding Shows how profitable a company is on a shareholders basis Higher EPS us always better than a lower ratio because this means the company is more profitable ( company has more profits to distribute to its shareholders) Higher EPS often makes the stock price of a company rise
  • 27. Price Earning ratio Is a market prospect ratio that calculates the market value of a stock relative to its earnings by comparing the market price per share by the earnings per share Shows what the market is willing to pay for a stock based on its current earnings Evaluate what a stock’s fair market value by predicting future earnings per share (higher future earnings are expected to issue higher dividends) Company with higher P/E ratio indicated positive future performance and investors are willing to pay more for this company’s shares Price per share / earning per share
  • 28. Dividend Yield Measures the amount of cash dividends distributed to common shareholders to the market value per share Used by investors to show how their investment in stock is generating either cash flows in the form of dividends or increases in asset value by stock appreciation Investors want to know how much dividends they are getting for every dollar that the stock is worth Company with high dividend yield pay its investors a large dividend compared to the fair market value of the stock
  • 29. Capital Structure Capital structure is how a firm finances its overall operations and growth by using different sources of funds Debt comes in the form of bond issues or long term notes payable, while equity is classified as common stock, preferred stock or retained earnings Short term debt such as working capital requirements also considered to be part of the capital structure
  • 30. Gearing ratio Measures the proportion of a company’s borrowed funds to its equity Indicates the financial risk to which a business is subjected, since excessive debt can lead to financial difficulties A high gearing ratio represents a high proportion of debt to equity (great deal of leverage, where company is using debt to pay for its continuing operations) A low gearing ratio may be indicative of conservative financial management, but also mean a company is located in a high cyclical industry  Long term liabilities / capital employed
  • 31. Choosing between shares and debentures  Lower Risk  Debenture holders have their interest paid to them whether or not profits are made  If there is insufficient cash funds available to pay debenture dividends, many debentures give their holders the right to sell of some or all of the assets of the company, to recoup the amount of their debentures before anyone else has a claim  Ranks above the shares of that same company  Medium Risk  Preference shareholders have their dividends paid after the debenture interest has been paid, but before the ordinary shareholders  Still dependent upon the profits being available for distribution  Highest Risk  Ordinary shareholders ( must give way to both debenture holders and to preference shares for interest and dividends)  Ordinary shareholders ( must give way to both debenture holders and to preference shares for interest and dividends)  However, should the remaining profits for distribution be very high then they may get a high return on their money
  • 32. Trend Analysis One of the tools for the analysis of the company’s monetary statements for the investment purposes To determine the financial position of the business The financial statements of the company are compared with each other for several years after converted into percentage form in order to compare them with each other Trend analysis percentage = (figure of the previous period- figure of the current period) / total both figures If the current-year percentages were greater than previous year percentage (current-year result is better
  • 33. Limitation of Accounting statement Impossible to sensibly compare two businesses which are completely unlike one another Compare a supermarket’s figures with those of a chemical factory would be rather pointless A lot of other factors that the past-focused financial statements do not disclose Desire to keep money measurement concept, objectives will exclude great deal of desirable information
  • 34. Comparative ratios and benchmarking Comparisons –a company’s ratios are compared with those of other firms in the same industry, that is, to industry average figures. Benchmarking –compare ratios with those a smaller set of leading companies