1) India has a population of over 1.2 billion people as of the 2011 census, with over 800 million living in rural areas and over 260 million working in agriculture.
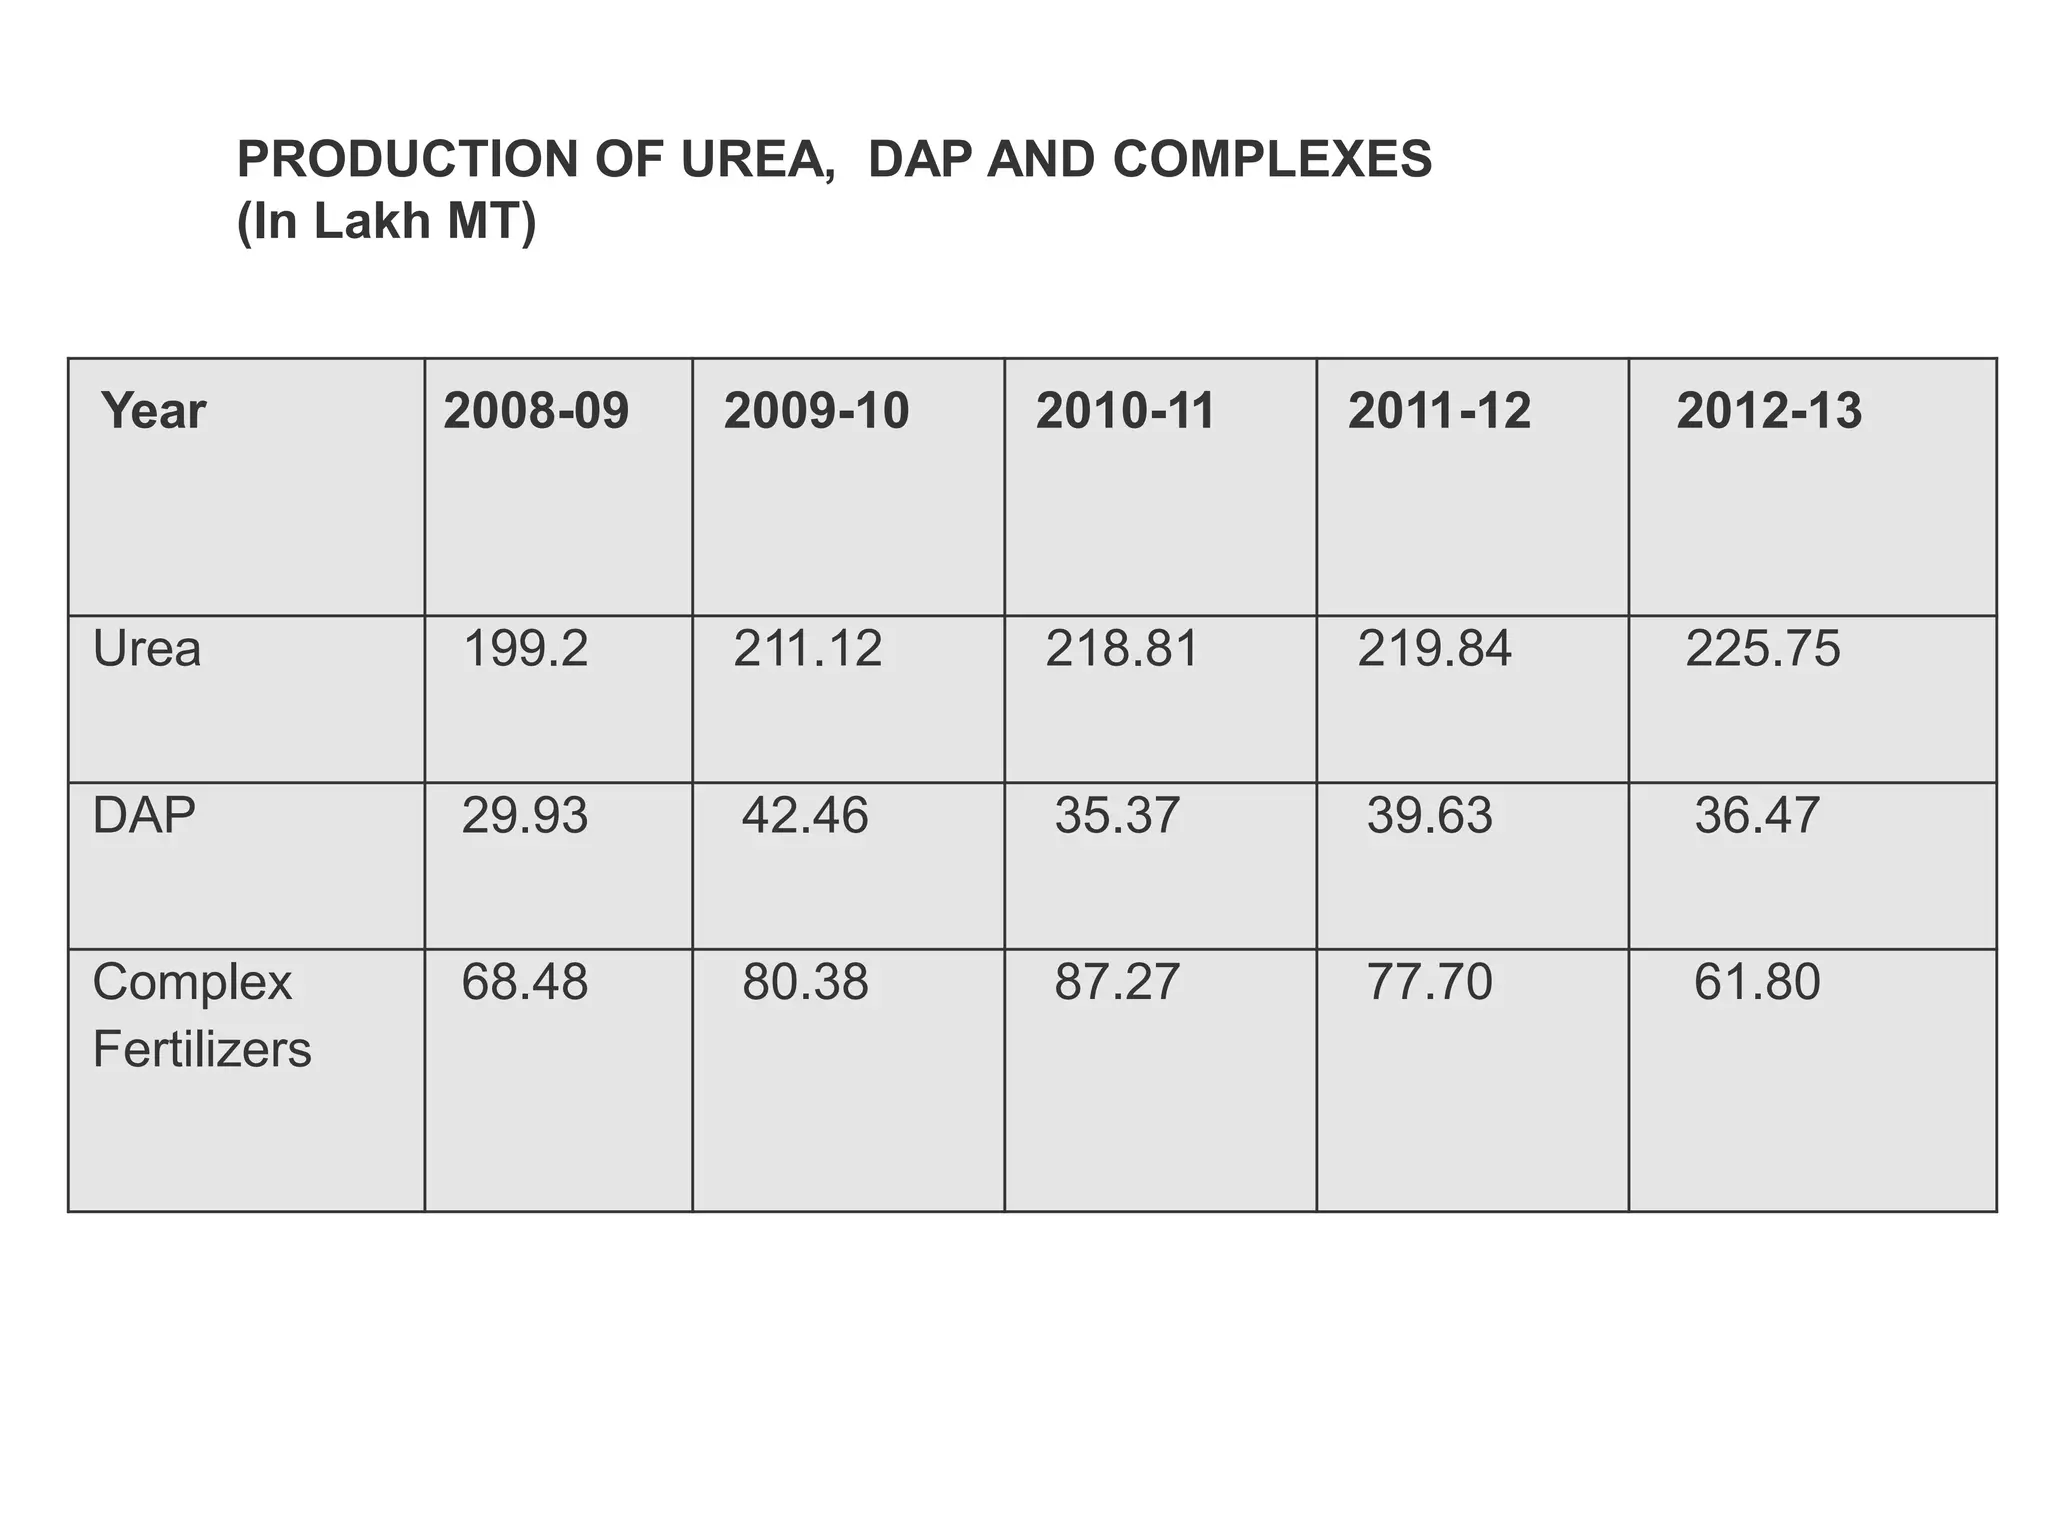
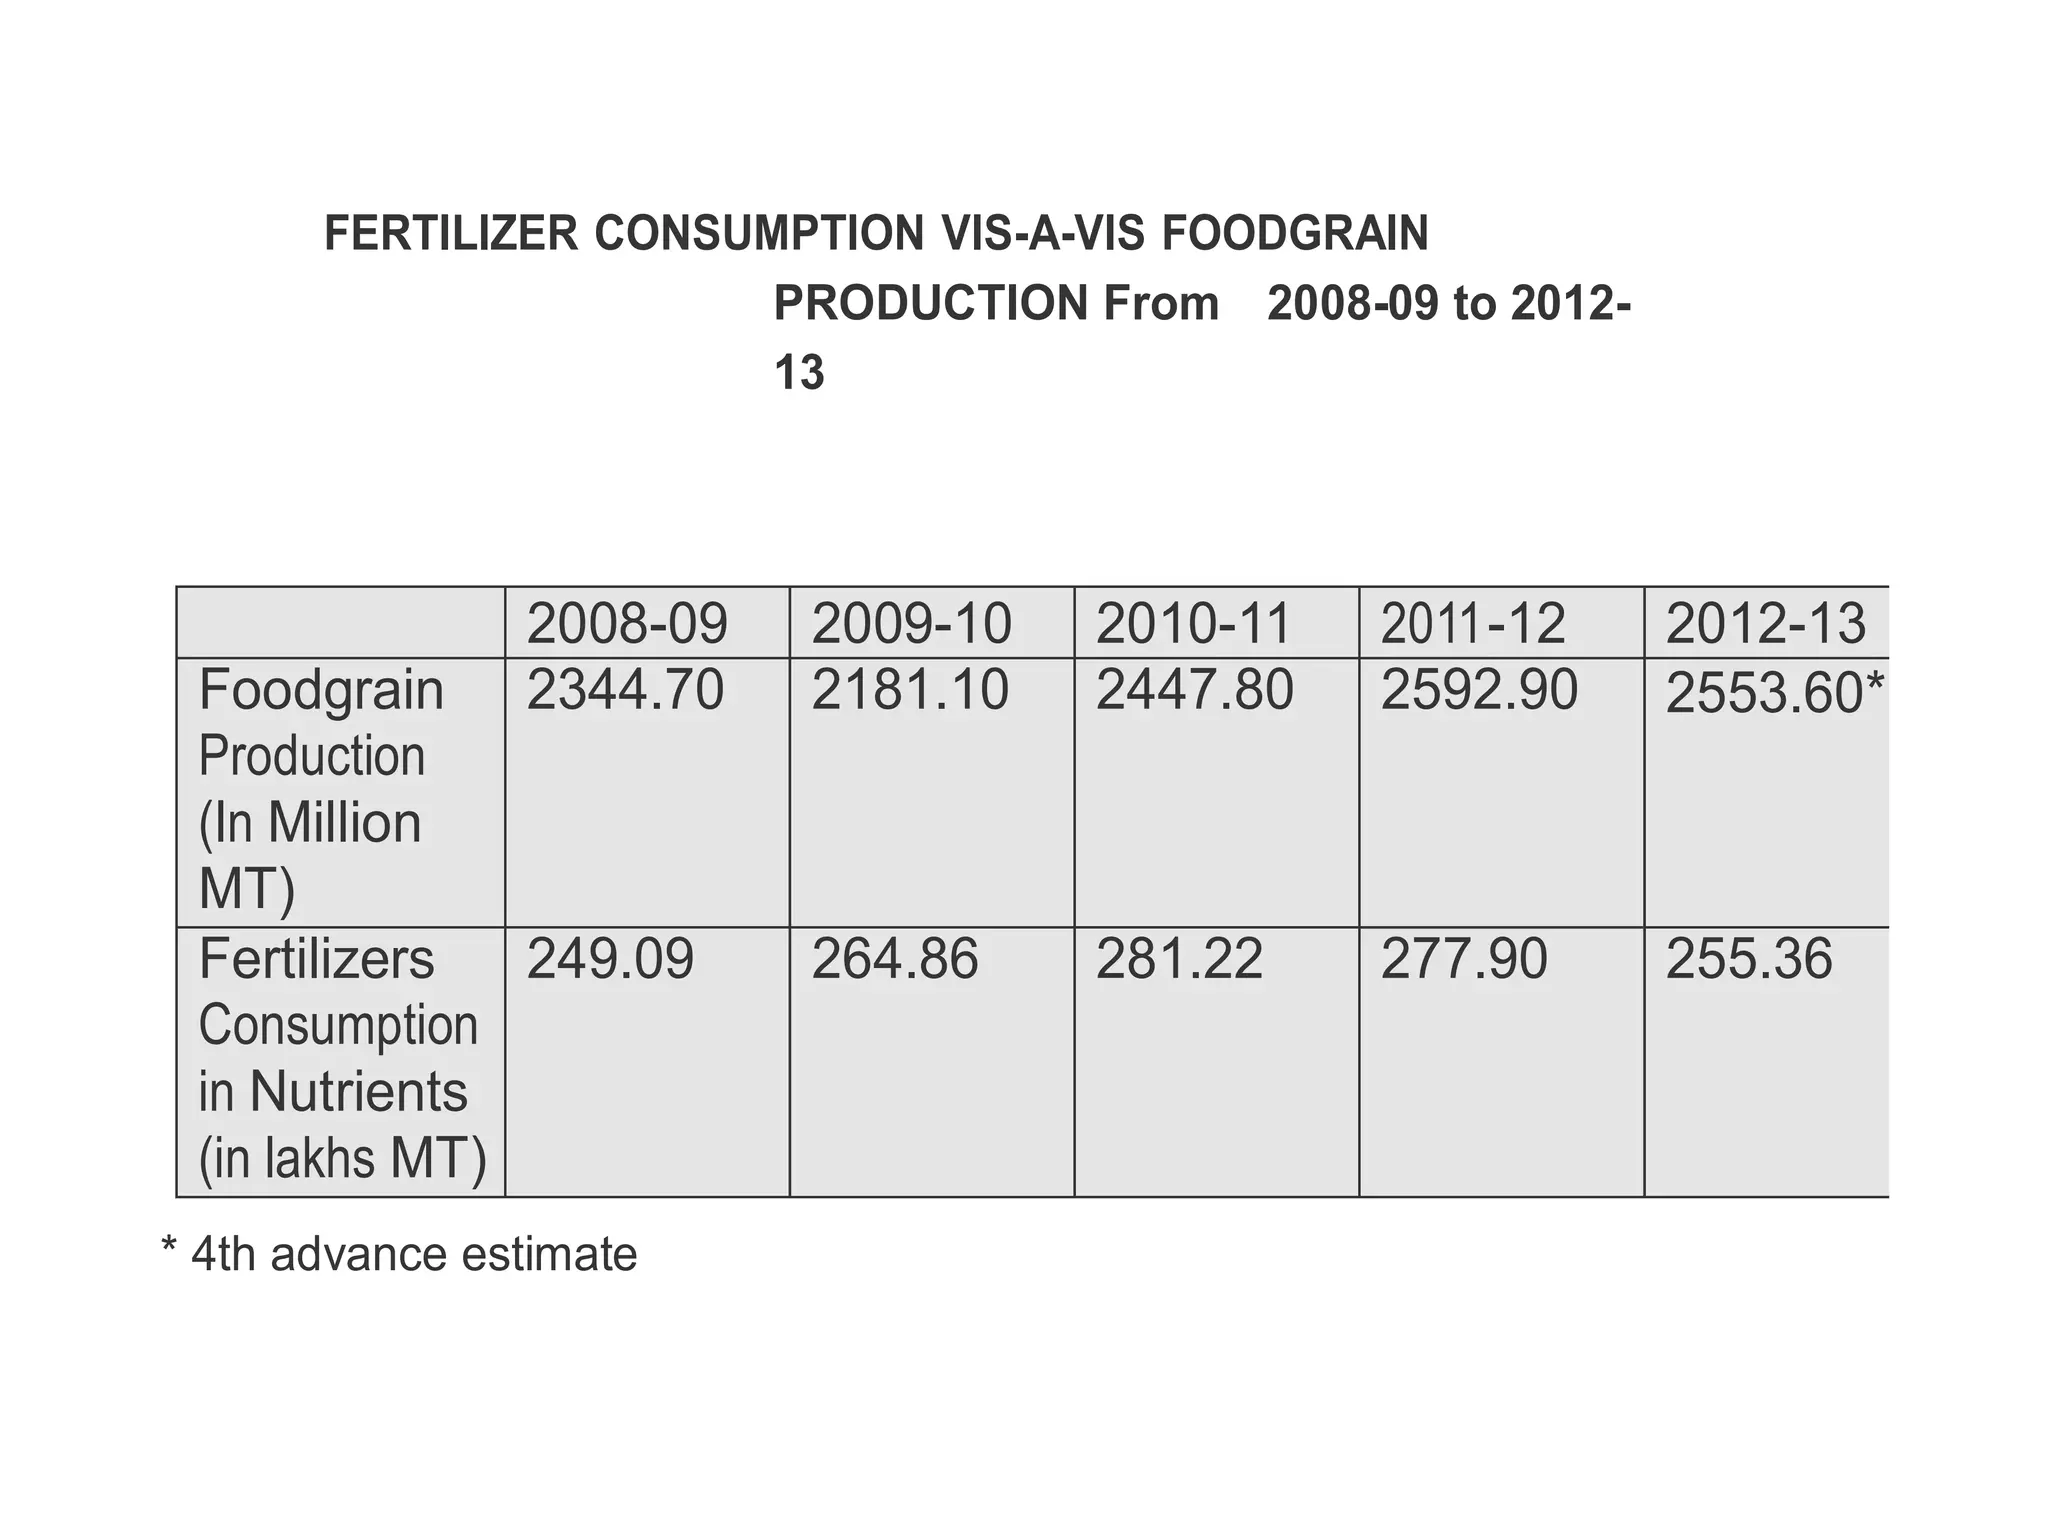
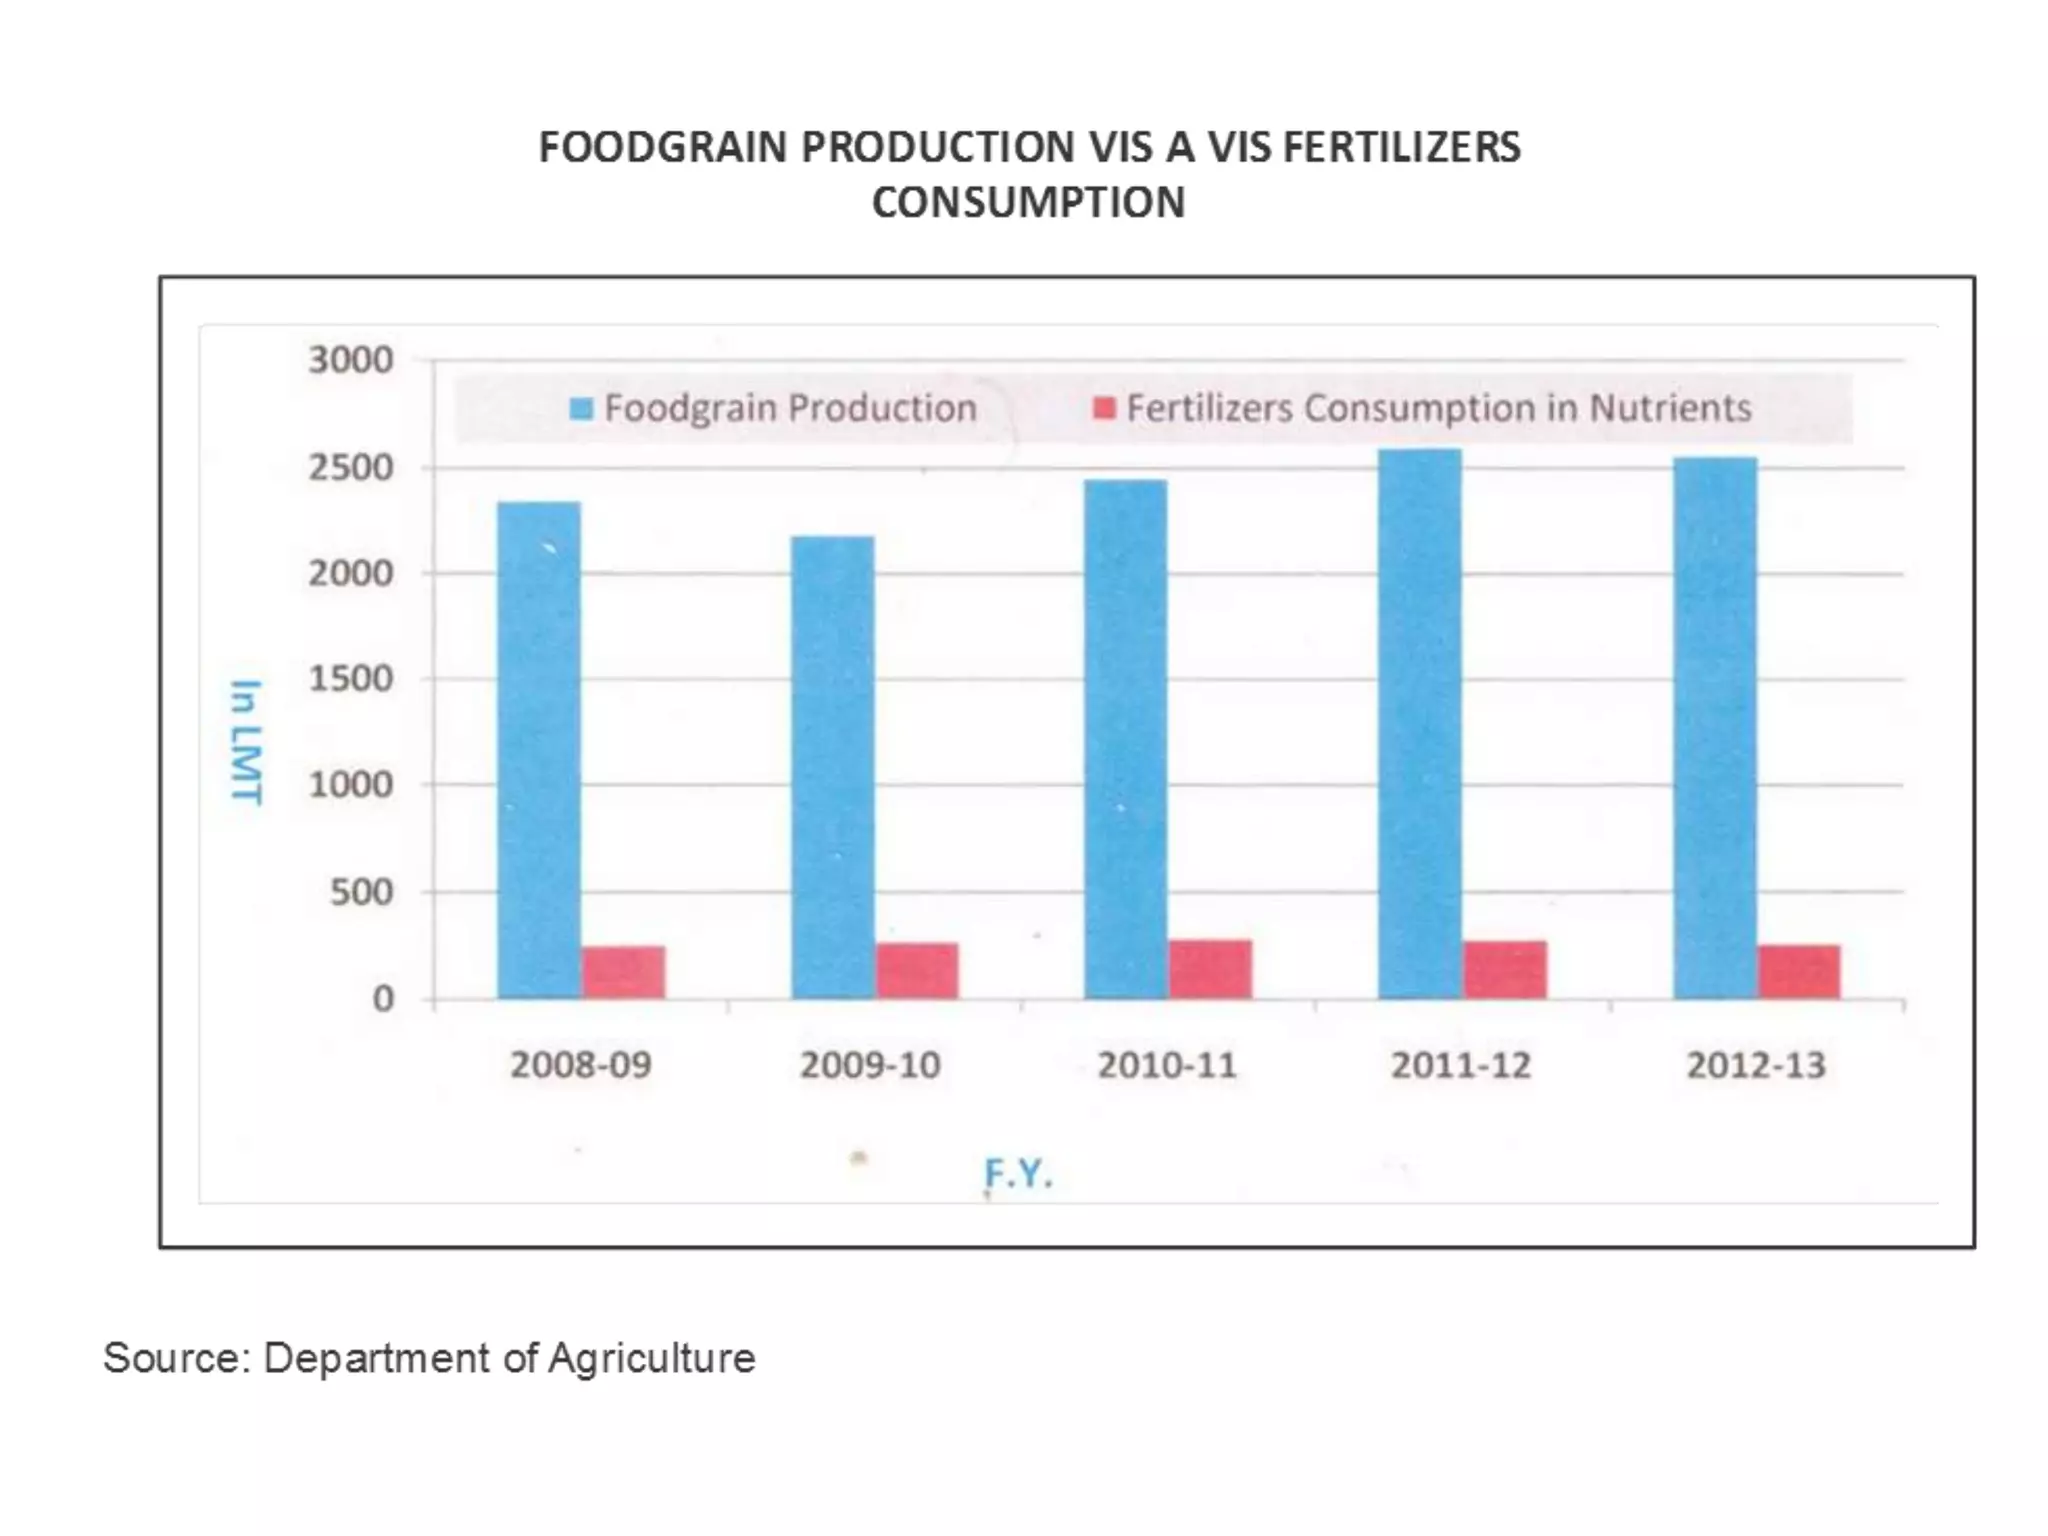
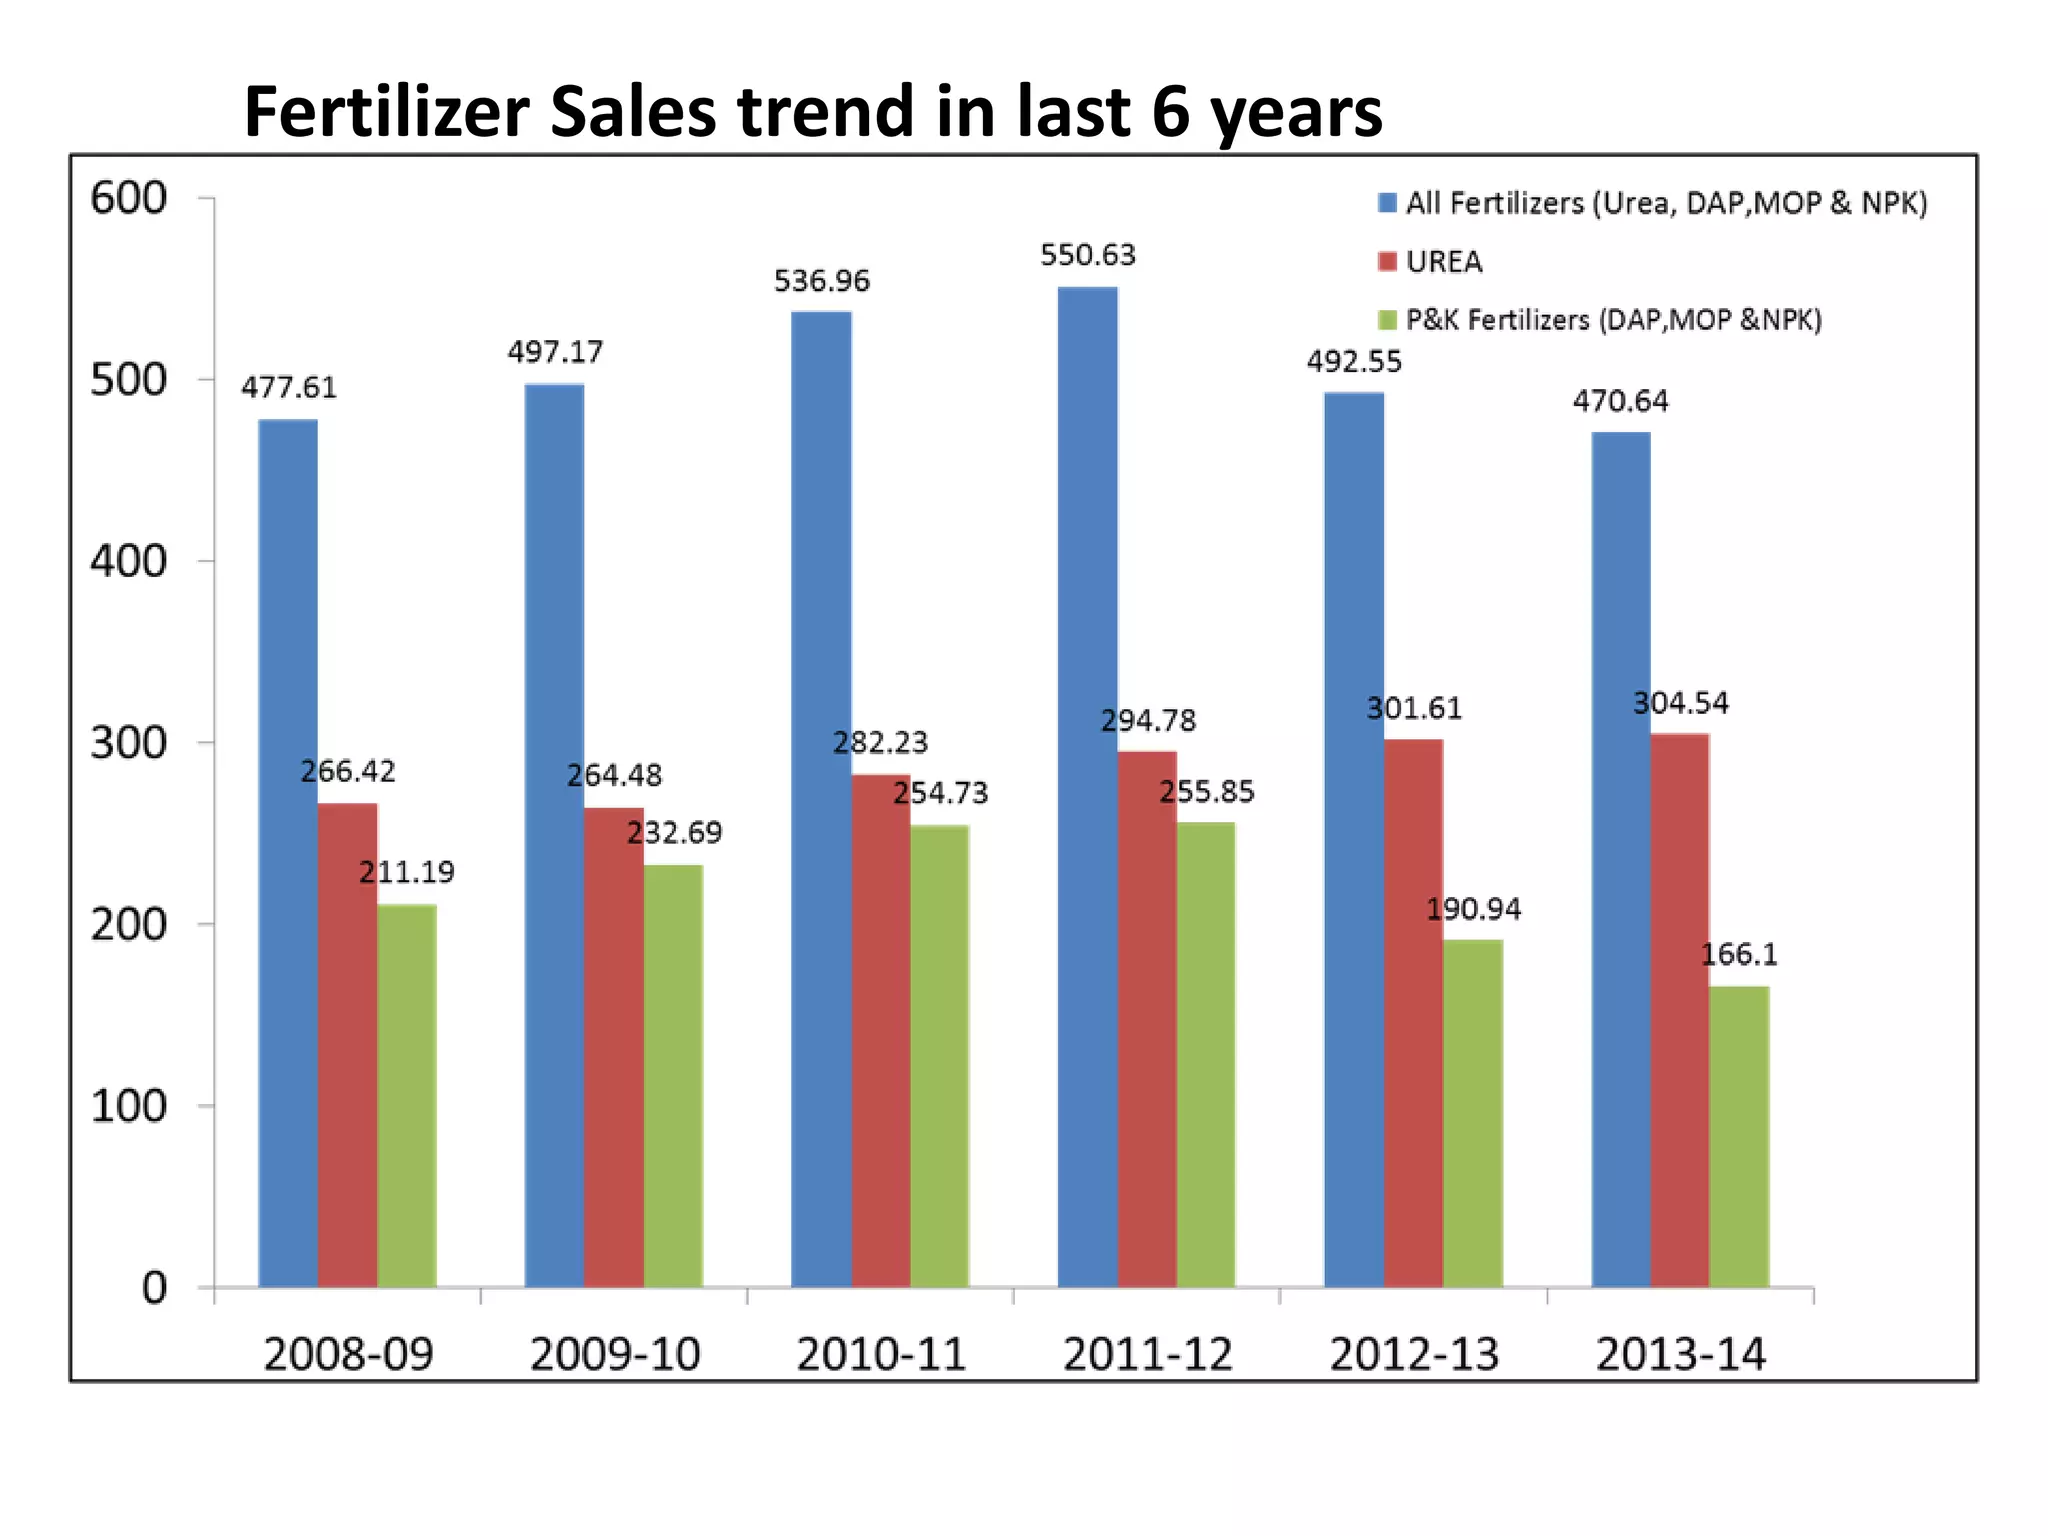
2) Fertilizer production and consumption in India is significant, with over 15 million tonnes produced and over 25 million tonnes consumed annually to support agriculture and food production.
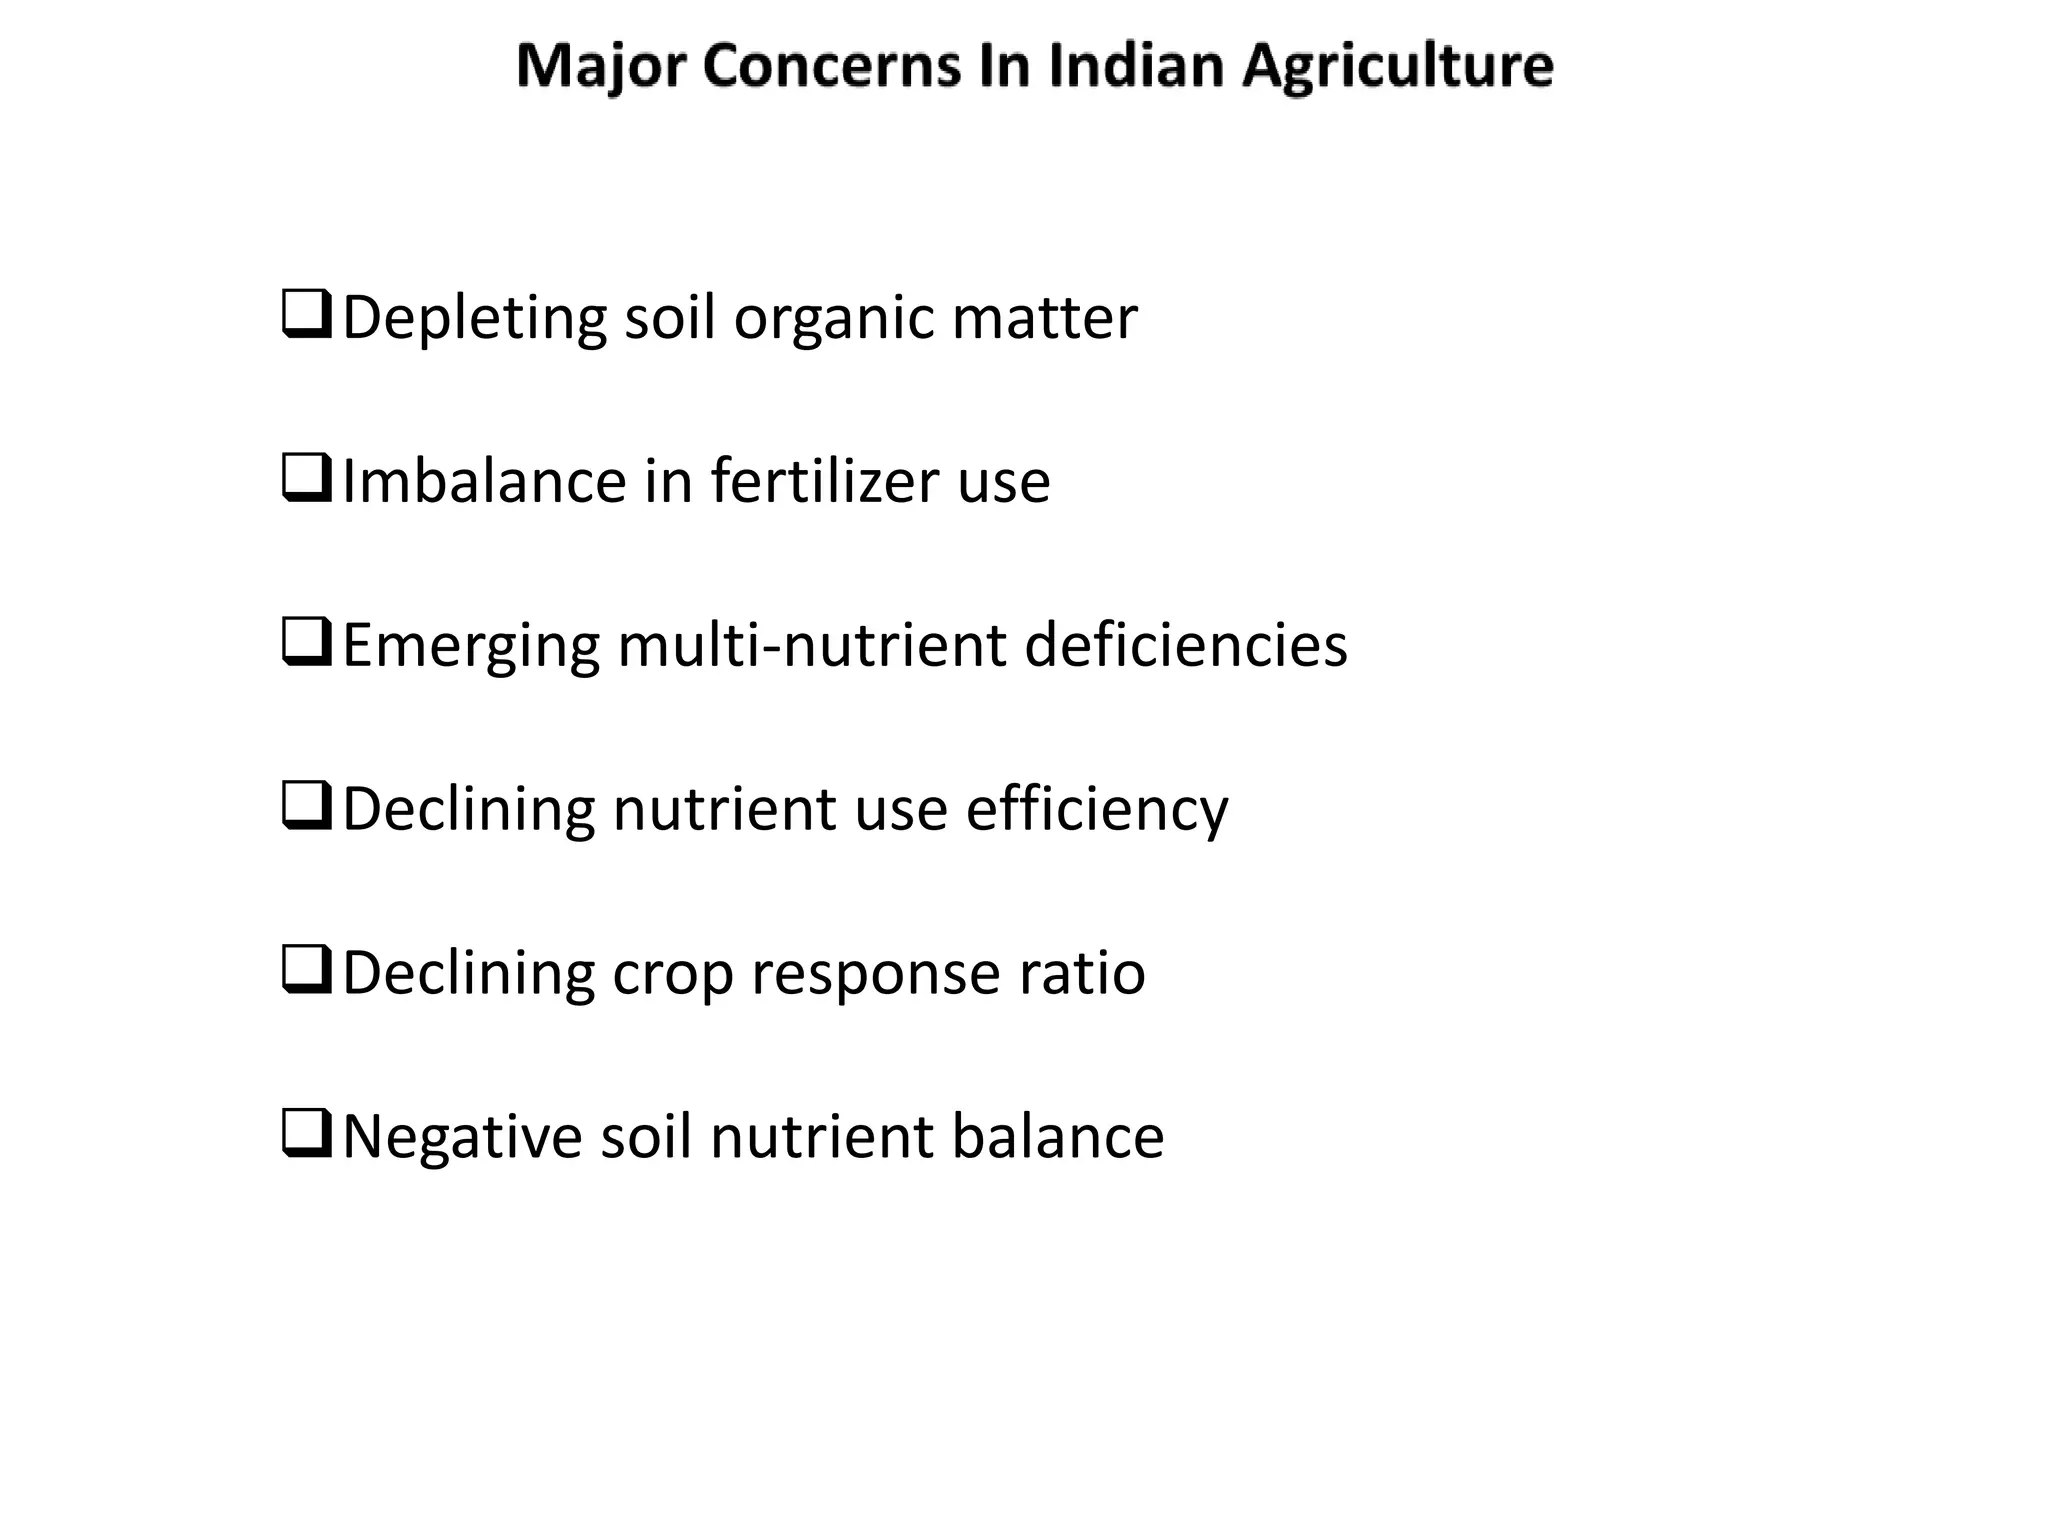
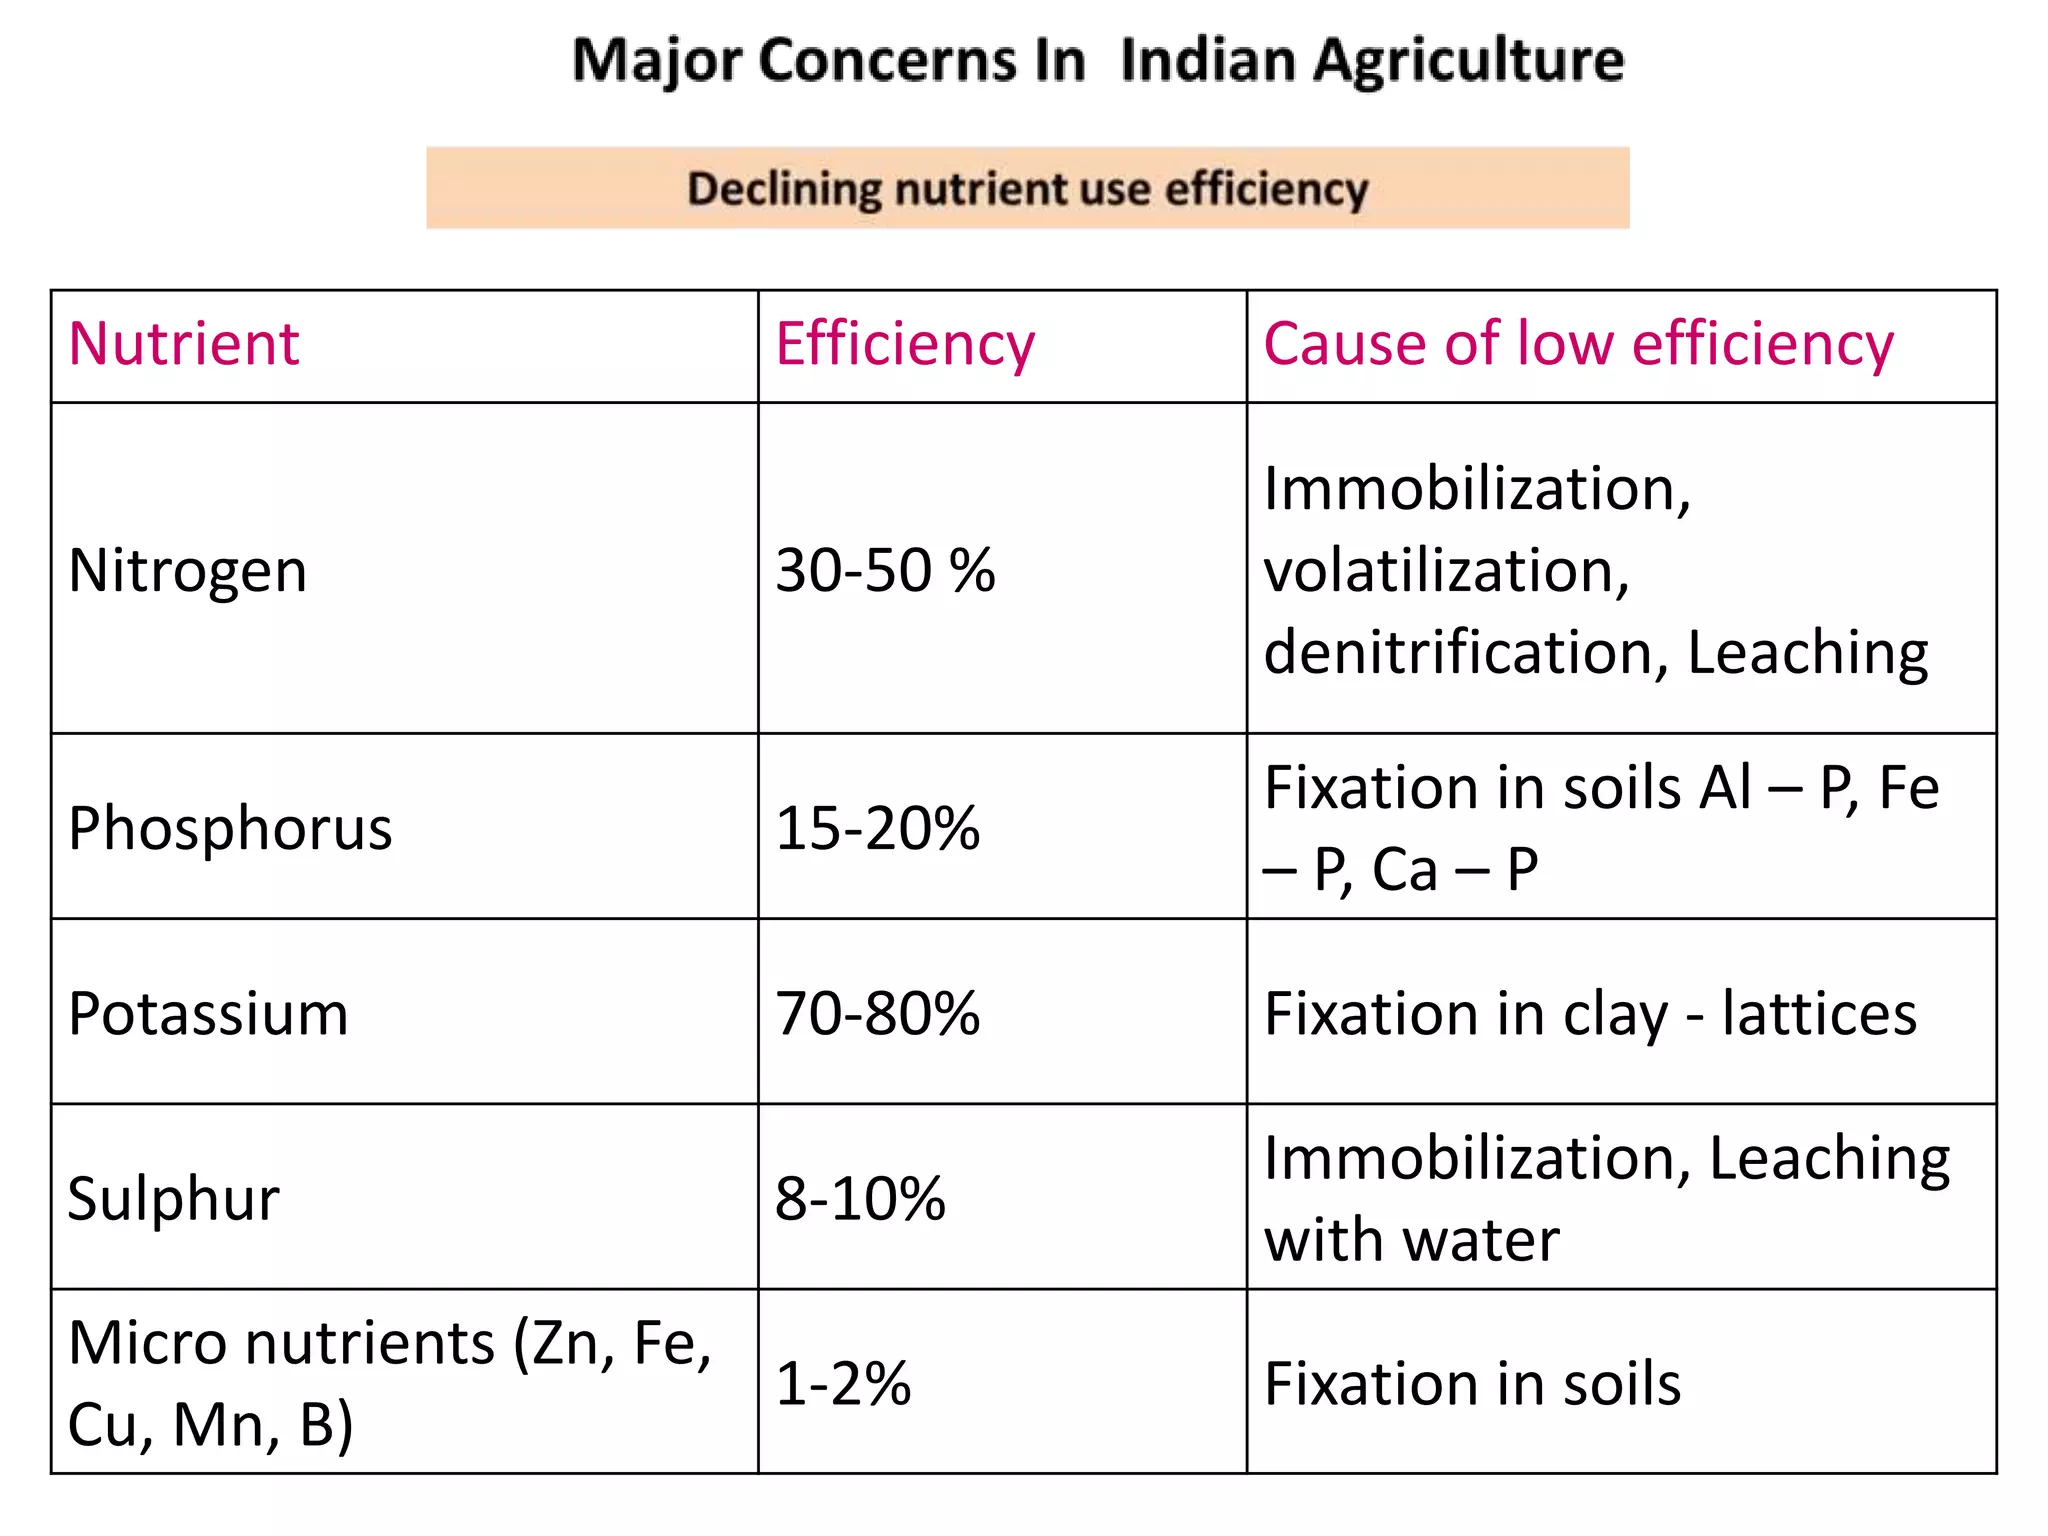
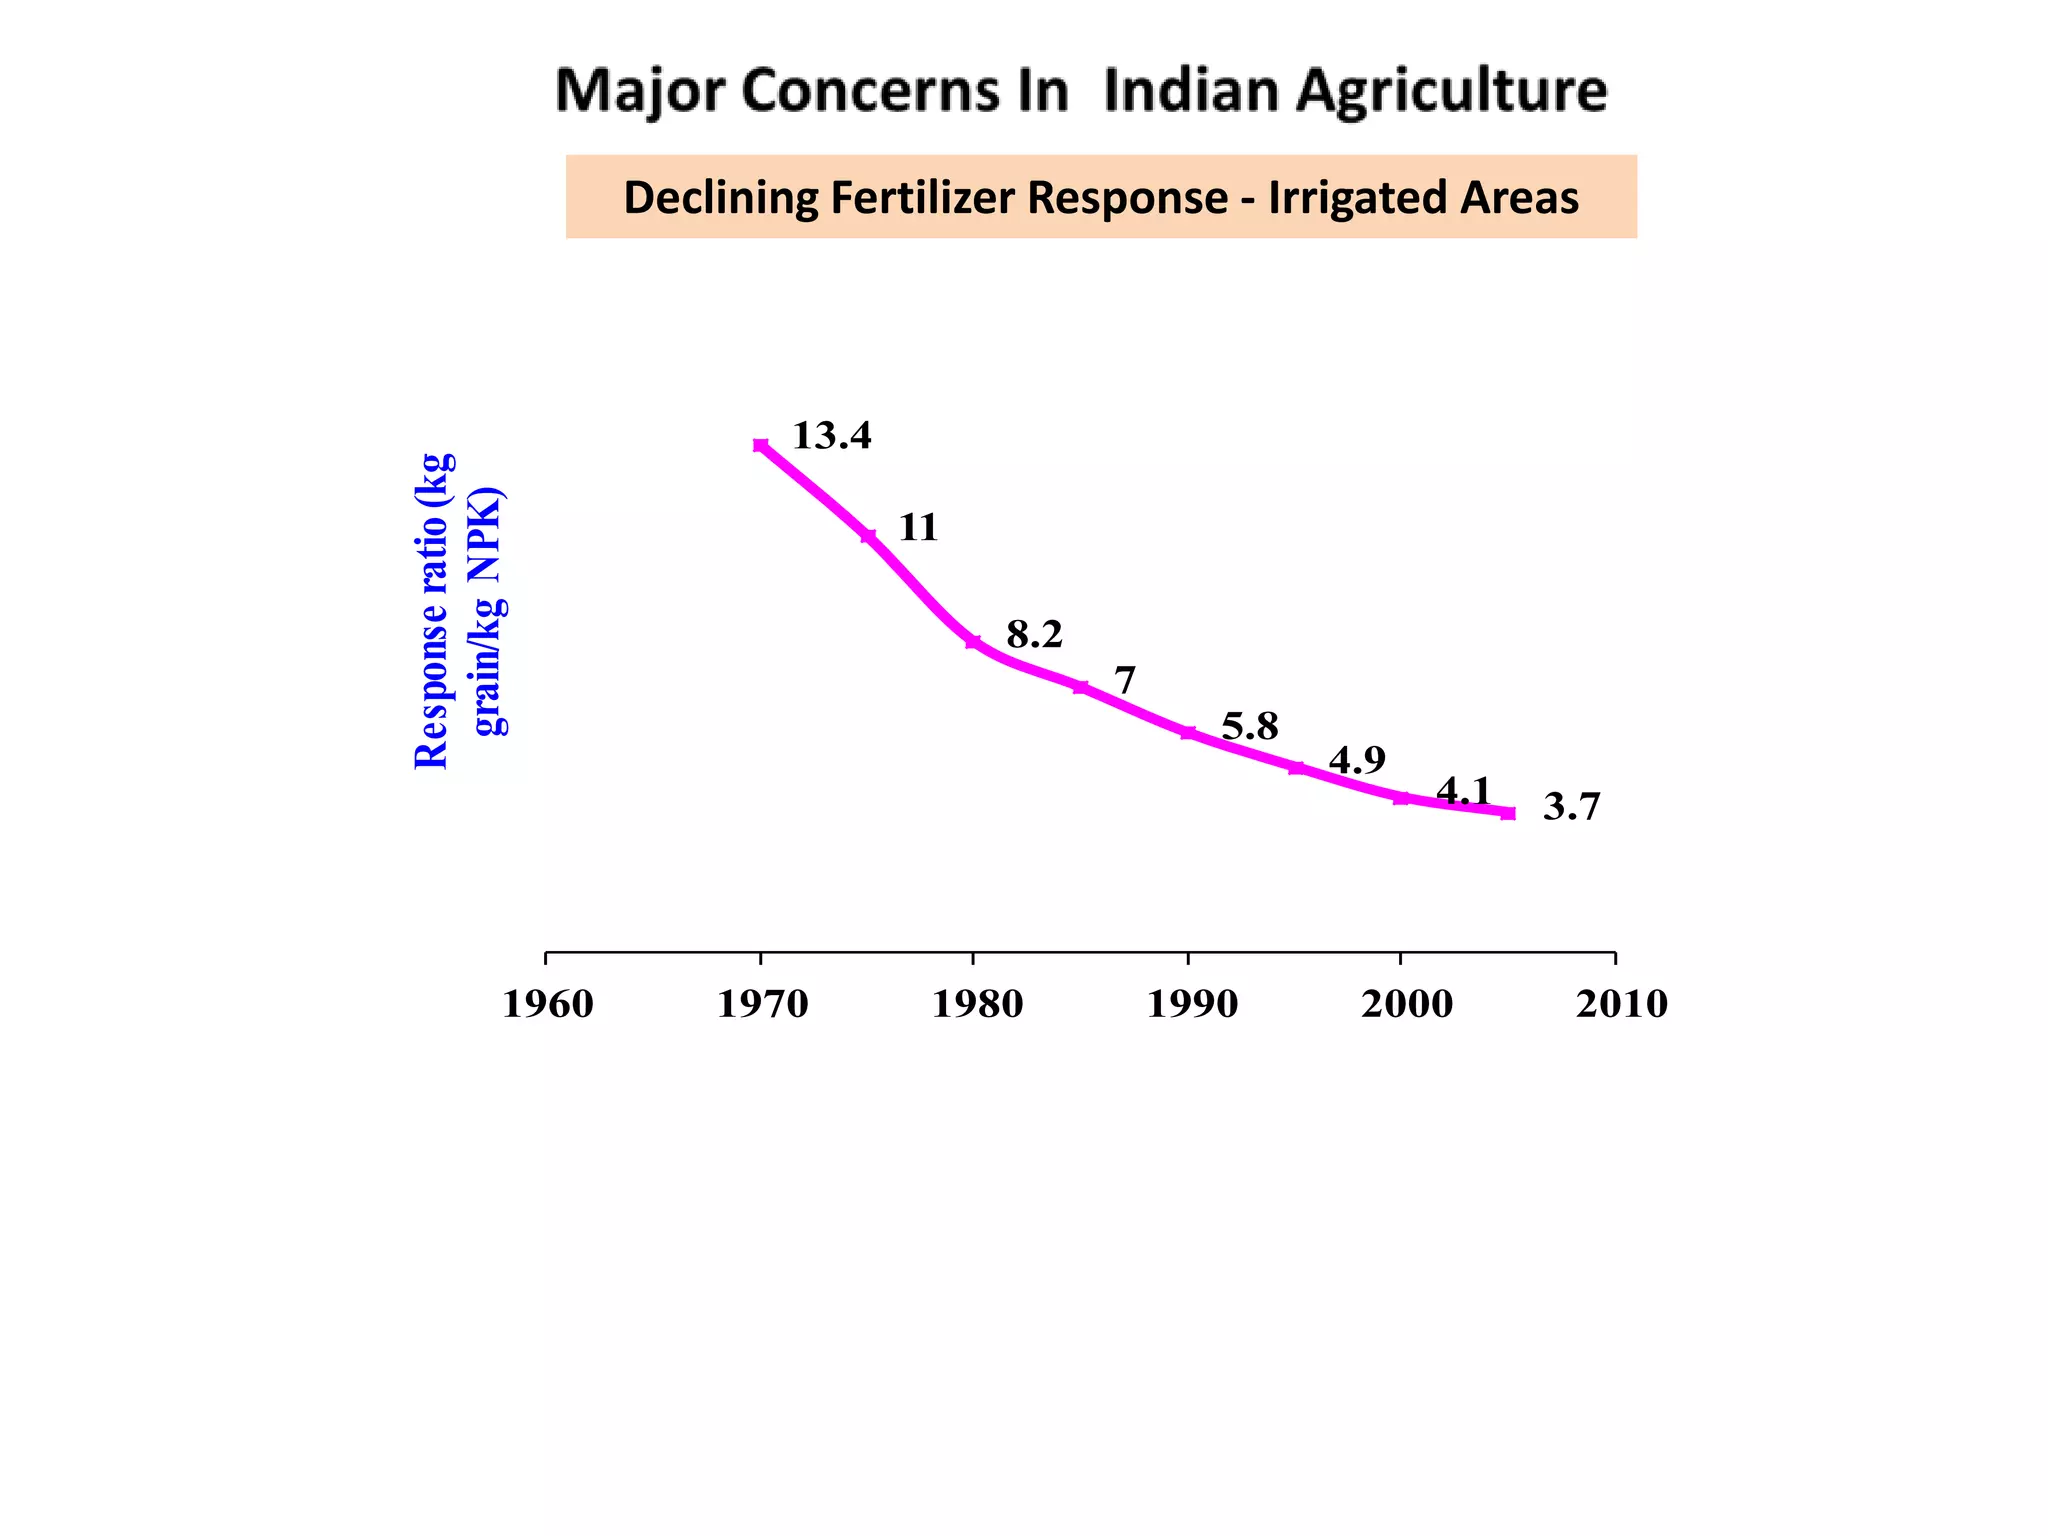
3) However, fertilizer use efficiency is relatively low in India, at 30-50% for nitrogen and 15-20% for phosphorus, due to issues like soil nutrient imbalances, lack of awareness on balanced nutrition, and poor crop management practices.