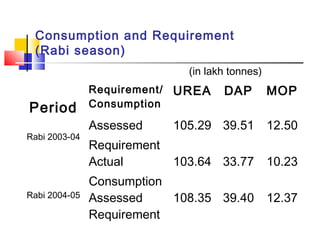
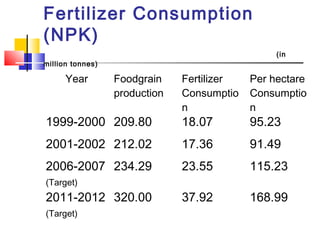
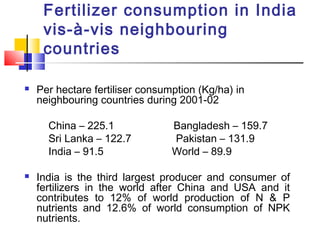
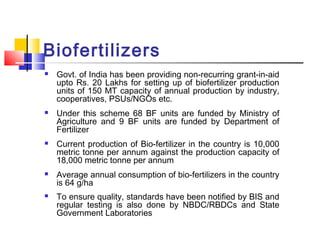
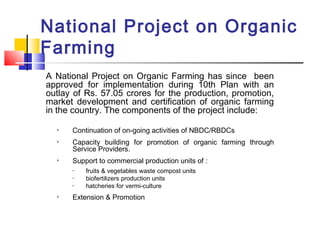
INTEGRATED
NUTRIENT
MANAGEMENT (INM)
Consumption and Requirement
(Rabi season)
(in lakh tonnes)
Period
Requirement/
Consumption
UREA DAP MOP
Rabi 2003-04
Assessed
Requirement
105.29 39.51 12.50
Actual
Consumption
103.64 33.77 10.23
Rabi 2004-05 Assessed
Requirement
108.35 39.40 12.37
Fertilizer Consumption
(NPK)
(in
million tonnes)
Year Foodgrain
production
Fertilizer
Consumptio
n
Per hectare
Consumptio
n
1999-2000 209.80 18.07 95.23
2001-2002 212.02 17.36 91.49
2006-2007
(Target)
234.29 23.55 115.23
2011-2012
(Target)
320.00 37.92 168.99
Fertilizer consumption in India
vis-à-vis neighbouring
countries
 Per hectare fertiliser consumption (Kg/ha) in
neighbouring countries during 2001-02
China – 225.1 Bangladesh – 159.7
Sri Lanka – 122.7 Pakistan – 131.9
India – 91.5 World – 89.9
 India is the third largest producer and consumer of
fertilizers in the world after China and USA and it
contributes to 12% of world production of N & P
nutrients and 12.6% of world consumption of NPK
nutrients.
NPK Ratio
YEAR N : P : K
1991 - 92 5.9 : 2.4 : 1
1992 - 93 9.5 : 3.2 : 1
2001 - 02 6.8 : 2.6 : 1
2003 – 04 (Estt) 6.5 : 2.5 : 1
Integrated Nutrient Management
 Integrated Nutrient Management advocates
balanced & integrated use of :
 Chemical fertilisers including secondary and
micro-nutrients
 Bio-fertilisers
 Organic manures, edible & non-edible oil cakes,
green manures, press mud etc
 Application of INM needs to be based upon
Soil test results
Soil Testing Laboratories
 Soil testing programme in the country is aimed to provide
services to farmers towards balanced application of fertilizers
based on soil tests.
 Total number of soil testing laboratories in the country are 543
(417 static + 126 mobile) with analyzing capacity of 6.6 million
soil samples per annum.
 Utilization of the capacity was about 70% for the year 2002-03
 Deficiency of micronutrients is a cause of concern. About 99
laboratories have micronutrient testing facilities
Details of soil testing laboratories
Static Mobile Total
State Govts. 392 106 498
Fertilizer Ind. 25 20 45
Total 417 126 543
Different grades of Fertilisers
Based on consumption pattern in 2001-02:
 Nitrogen (N) comes from –
Urea (81%), DAP (9.8%), Complexes (7.6%) and
Others (1.6%)
 Phosphate (P2O5) comes from –
DAP (64.9%), Complexes (25.3%), SSP (9.5%) and
Others (0.3%)
 Potash (K) comes from –
MOP (71.6%), Complexes (27.8%) and Others (0.6%)
Fortification of Fertilisers
(i) Boronated Single Super Phosphate
(ii) Zincated Phosphate
(iii) NPK Complex (12:32:16, 10:26:26) fortified
with Zinc & Boron
(iv) DAP fortified with Boron
(v) Neem Coated Urea
Grades notified in FCO
 10 Straight Nitrogenous fertilisers
 8 Straight Phosphatic fertilisers
 4 Straight Potassic fertilisers
 14 NP Complex fertilisers
 11 NPK Complex fertilisers
 12 Micronutrient Straight fertilisers
 7 Fortified fertilisers
 12 Water soluble Complex fertilisers
Besides, about 100 products of NPK mixtures
& micronutrient mixtures have been notified by the
State Govts. Under the delegated authority
Biofertilizers
 Govt. of India has been providing non-recurring grant-in-aid
upto Rs. 20 Lakhs for setting up of biofertilizer production
units of 150 MT capacity of annual production by industry,
cooperatives, PSUs/NGOs etc.
 Under this scheme 68 BF units are funded by Ministry of
Agriculture and 9 BF units are funded by Department of
Fertilizer
 Current production of Bio-fertilizer in the country is 10,000
metric tonne per annum against the production capacity of
18,000 metric tonne per annum
 Average annual consumption of bio-fertilizers in the country
is 64 g/ha
 To ensure quality, standards have been notified by BIS and
regular testing is also done by NBDC/RBDCs and State
Government Laboratories
National Project on Organic
Farming
A National Project on Organic Farming has since been
approved for implementation during 10th Plan with an
outlay of Rs. 57.05 crores for the production, promotion,
market development and certification of organic farming
in the country. The components of the project include:

Continuation of on-going activities of NBDC/RBDCs

Capacity building for promotion of organic farming through
Service Providers.

Support to commercial production units of :
• fruits & vegetables waste compost units
• biofertilizers production units
• hatcheries for vermi-culture
 Extension & Promotion
Integrated nutrient management

Integrated nutrient management

  • 1.
  • 2.
    Consumption and Requirement (Rabiseason) (in lakh tonnes) Period Requirement/ Consumption UREA DAP MOP Rabi 2003-04 Assessed Requirement 105.29 39.51 12.50 Actual Consumption 103.64 33.77 10.23 Rabi 2004-05 Assessed Requirement 108.35 39.40 12.37
  • 3.
    Fertilizer Consumption (NPK) (in million tonnes) YearFoodgrain production Fertilizer Consumptio n Per hectare Consumptio n 1999-2000 209.80 18.07 95.23 2001-2002 212.02 17.36 91.49 2006-2007 (Target) 234.29 23.55 115.23 2011-2012 (Target) 320.00 37.92 168.99
  • 4.
    Fertilizer consumption inIndia vis-à-vis neighbouring countries  Per hectare fertiliser consumption (Kg/ha) in neighbouring countries during 2001-02 China – 225.1 Bangladesh – 159.7 Sri Lanka – 122.7 Pakistan – 131.9 India – 91.5 World – 89.9  India is the third largest producer and consumer of fertilizers in the world after China and USA and it contributes to 12% of world production of N & P nutrients and 12.6% of world consumption of NPK nutrients.
  • 5.
    NPK Ratio YEAR N: P : K 1991 - 92 5.9 : 2.4 : 1 1992 - 93 9.5 : 3.2 : 1 2001 - 02 6.8 : 2.6 : 1 2003 – 04 (Estt) 6.5 : 2.5 : 1
  • 6.
    Integrated Nutrient Management Integrated Nutrient Management advocates balanced & integrated use of :  Chemical fertilisers including secondary and micro-nutrients  Bio-fertilisers  Organic manures, edible & non-edible oil cakes, green manures, press mud etc  Application of INM needs to be based upon Soil test results
  • 7.
    Soil Testing Laboratories Soil testing programme in the country is aimed to provide services to farmers towards balanced application of fertilizers based on soil tests.  Total number of soil testing laboratories in the country are 543 (417 static + 126 mobile) with analyzing capacity of 6.6 million soil samples per annum.  Utilization of the capacity was about 70% for the year 2002-03  Deficiency of micronutrients is a cause of concern. About 99 laboratories have micronutrient testing facilities Details of soil testing laboratories Static Mobile Total State Govts. 392 106 498 Fertilizer Ind. 25 20 45 Total 417 126 543
  • 8.
    Different grades ofFertilisers Based on consumption pattern in 2001-02:  Nitrogen (N) comes from – Urea (81%), DAP (9.8%), Complexes (7.6%) and Others (1.6%)  Phosphate (P2O5) comes from – DAP (64.9%), Complexes (25.3%), SSP (9.5%) and Others (0.3%)  Potash (K) comes from – MOP (71.6%), Complexes (27.8%) and Others (0.6%)
  • 9.
    Fortification of Fertilisers (i)Boronated Single Super Phosphate (ii) Zincated Phosphate (iii) NPK Complex (12:32:16, 10:26:26) fortified with Zinc & Boron (iv) DAP fortified with Boron (v) Neem Coated Urea
  • 10.
    Grades notified inFCO  10 Straight Nitrogenous fertilisers  8 Straight Phosphatic fertilisers  4 Straight Potassic fertilisers  14 NP Complex fertilisers  11 NPK Complex fertilisers  12 Micronutrient Straight fertilisers  7 Fortified fertilisers  12 Water soluble Complex fertilisers Besides, about 100 products of NPK mixtures & micronutrient mixtures have been notified by the State Govts. Under the delegated authority
  • 11.
    Biofertilizers  Govt. ofIndia has been providing non-recurring grant-in-aid upto Rs. 20 Lakhs for setting up of biofertilizer production units of 150 MT capacity of annual production by industry, cooperatives, PSUs/NGOs etc.  Under this scheme 68 BF units are funded by Ministry of Agriculture and 9 BF units are funded by Department of Fertilizer  Current production of Bio-fertilizer in the country is 10,000 metric tonne per annum against the production capacity of 18,000 metric tonne per annum  Average annual consumption of bio-fertilizers in the country is 64 g/ha  To ensure quality, standards have been notified by BIS and regular testing is also done by NBDC/RBDCs and State Government Laboratories
  • 12.
    National Project onOrganic Farming A National Project on Organic Farming has since been approved for implementation during 10th Plan with an outlay of Rs. 57.05 crores for the production, promotion, market development and certification of organic farming in the country. The components of the project include:  Continuation of on-going activities of NBDC/RBDCs  Capacity building for promotion of organic farming through Service Providers.  Support to commercial production units of : • fruits & vegetables waste compost units • biofertilizers production units • hatcheries for vermi-culture  Extension & Promotion