
Downloaded 165 times


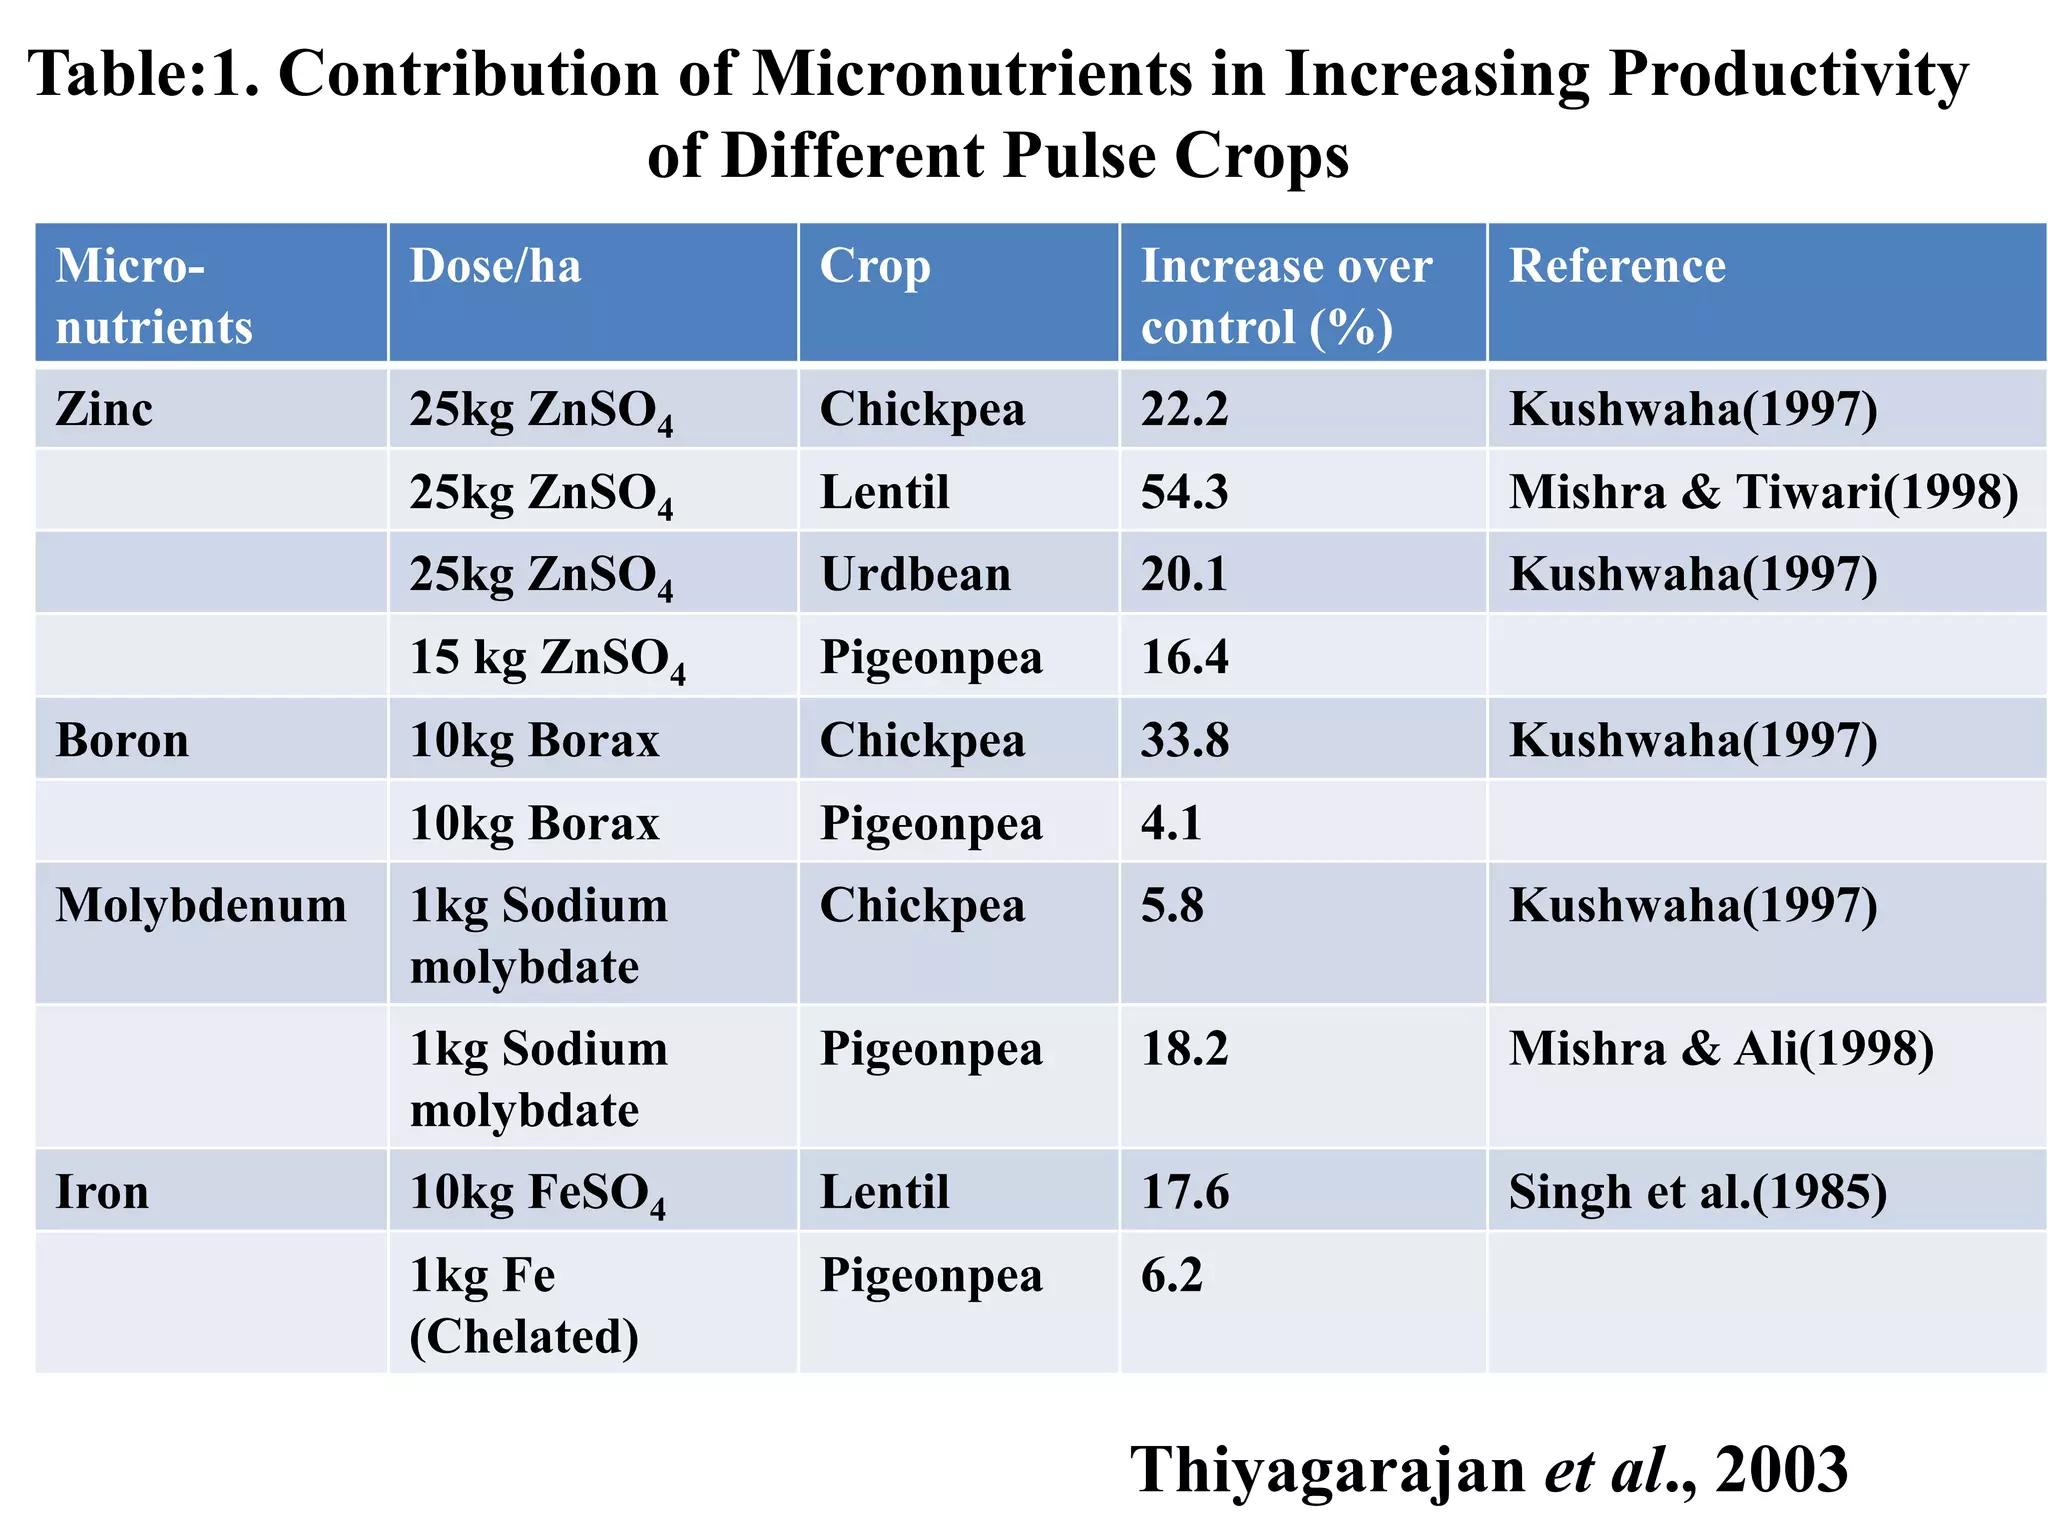
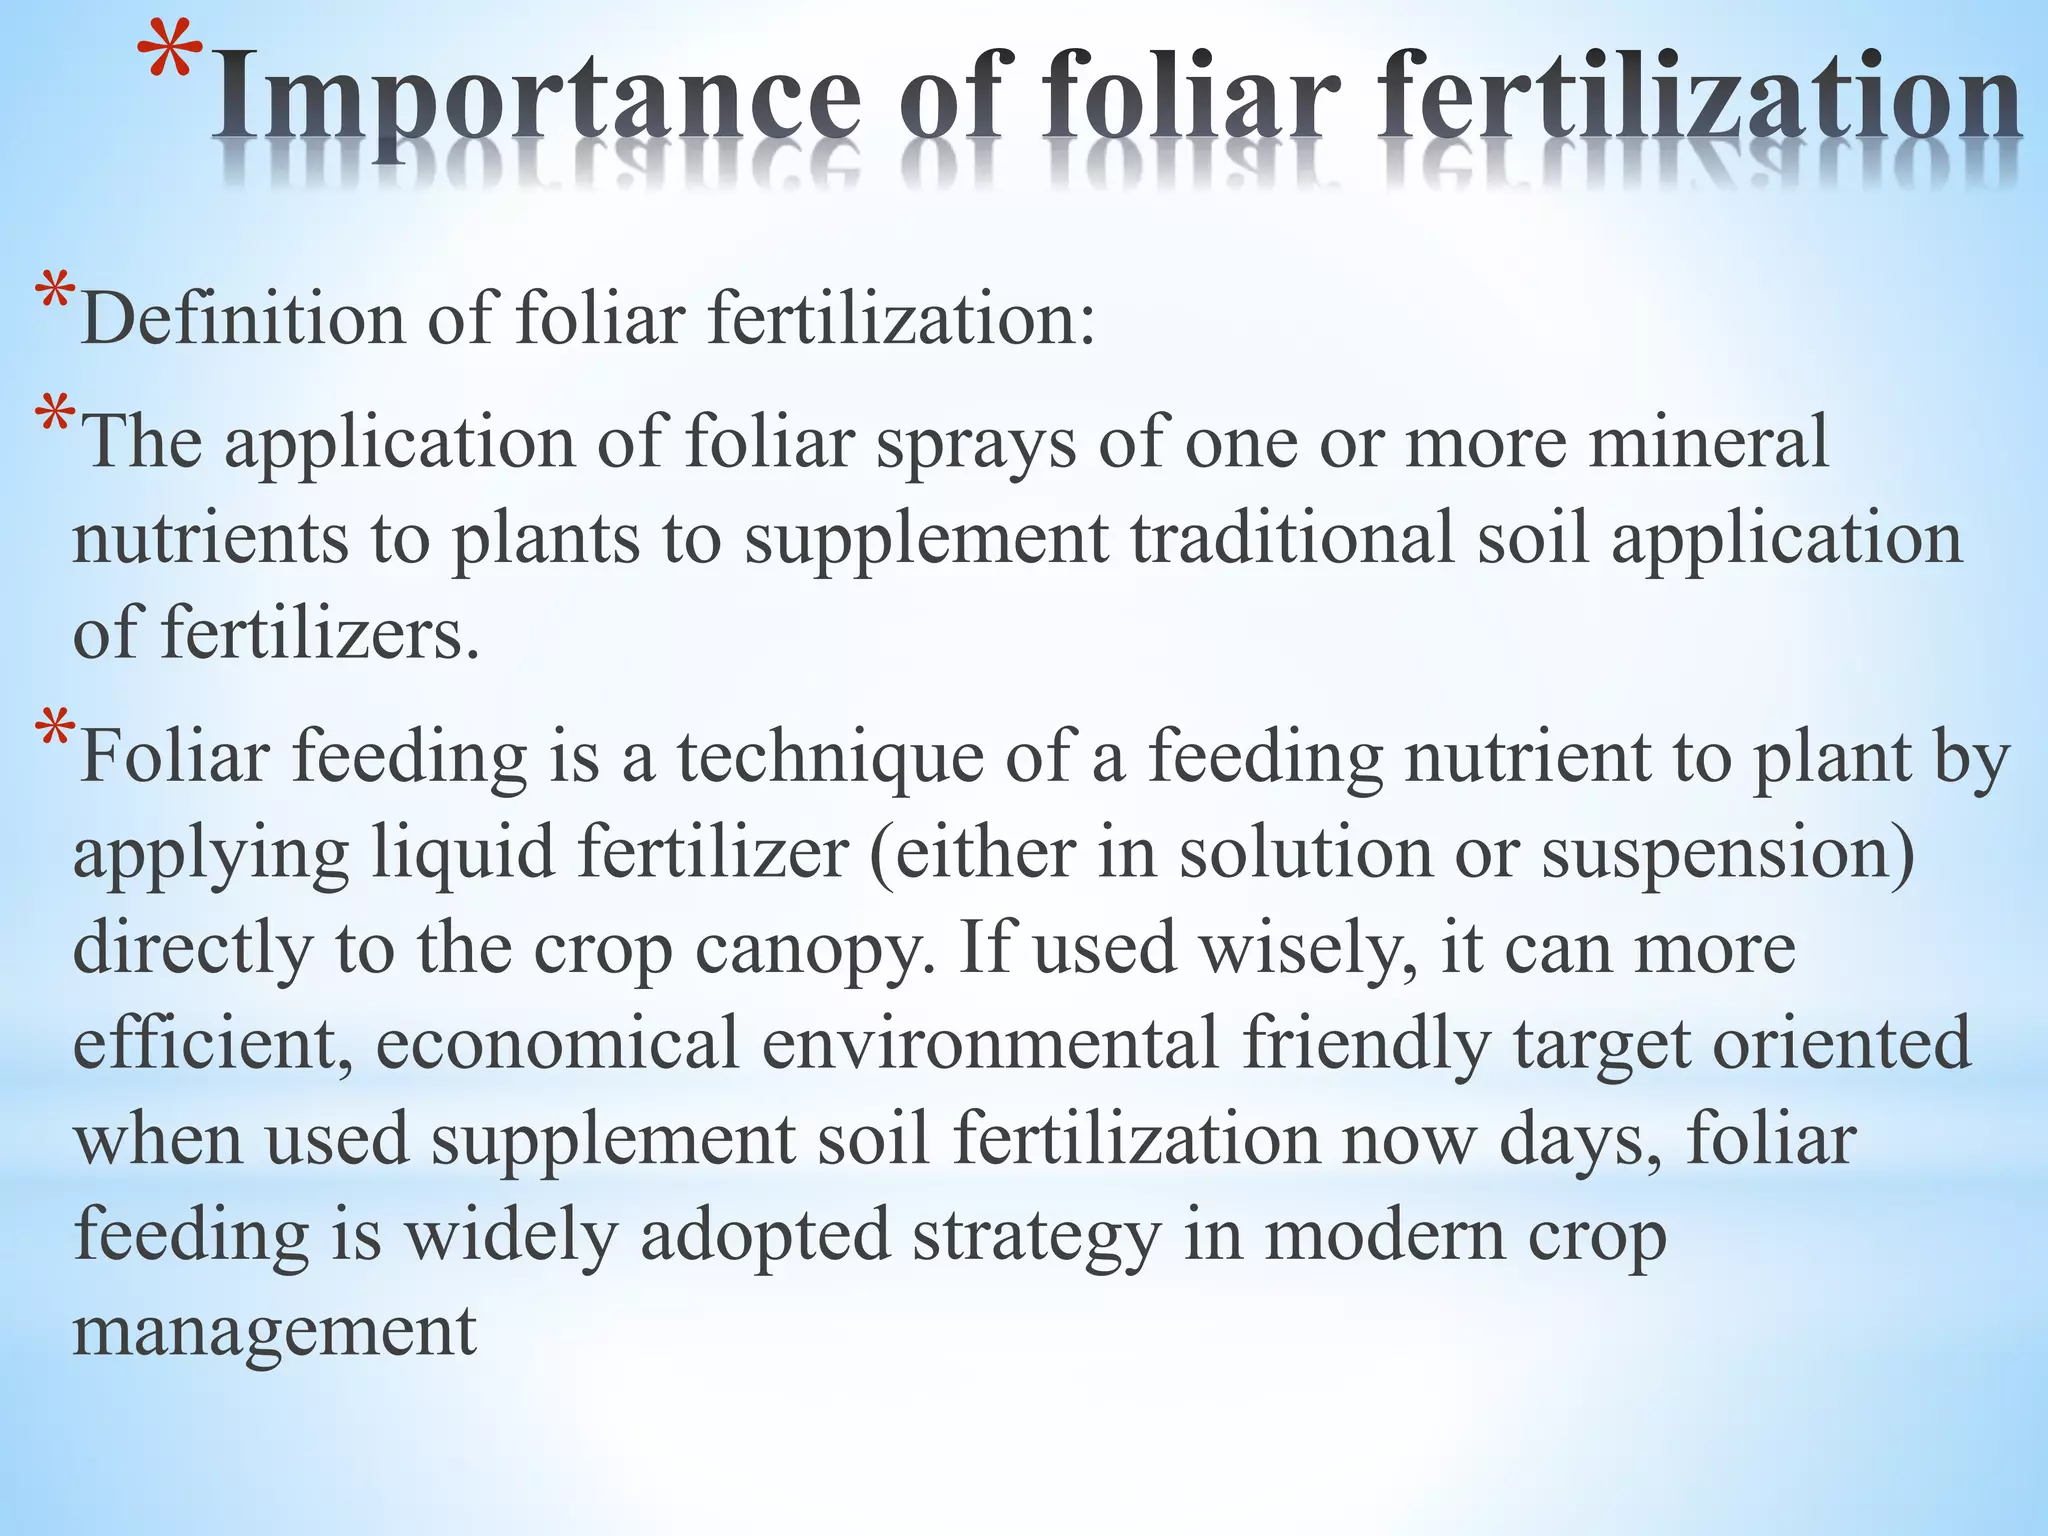


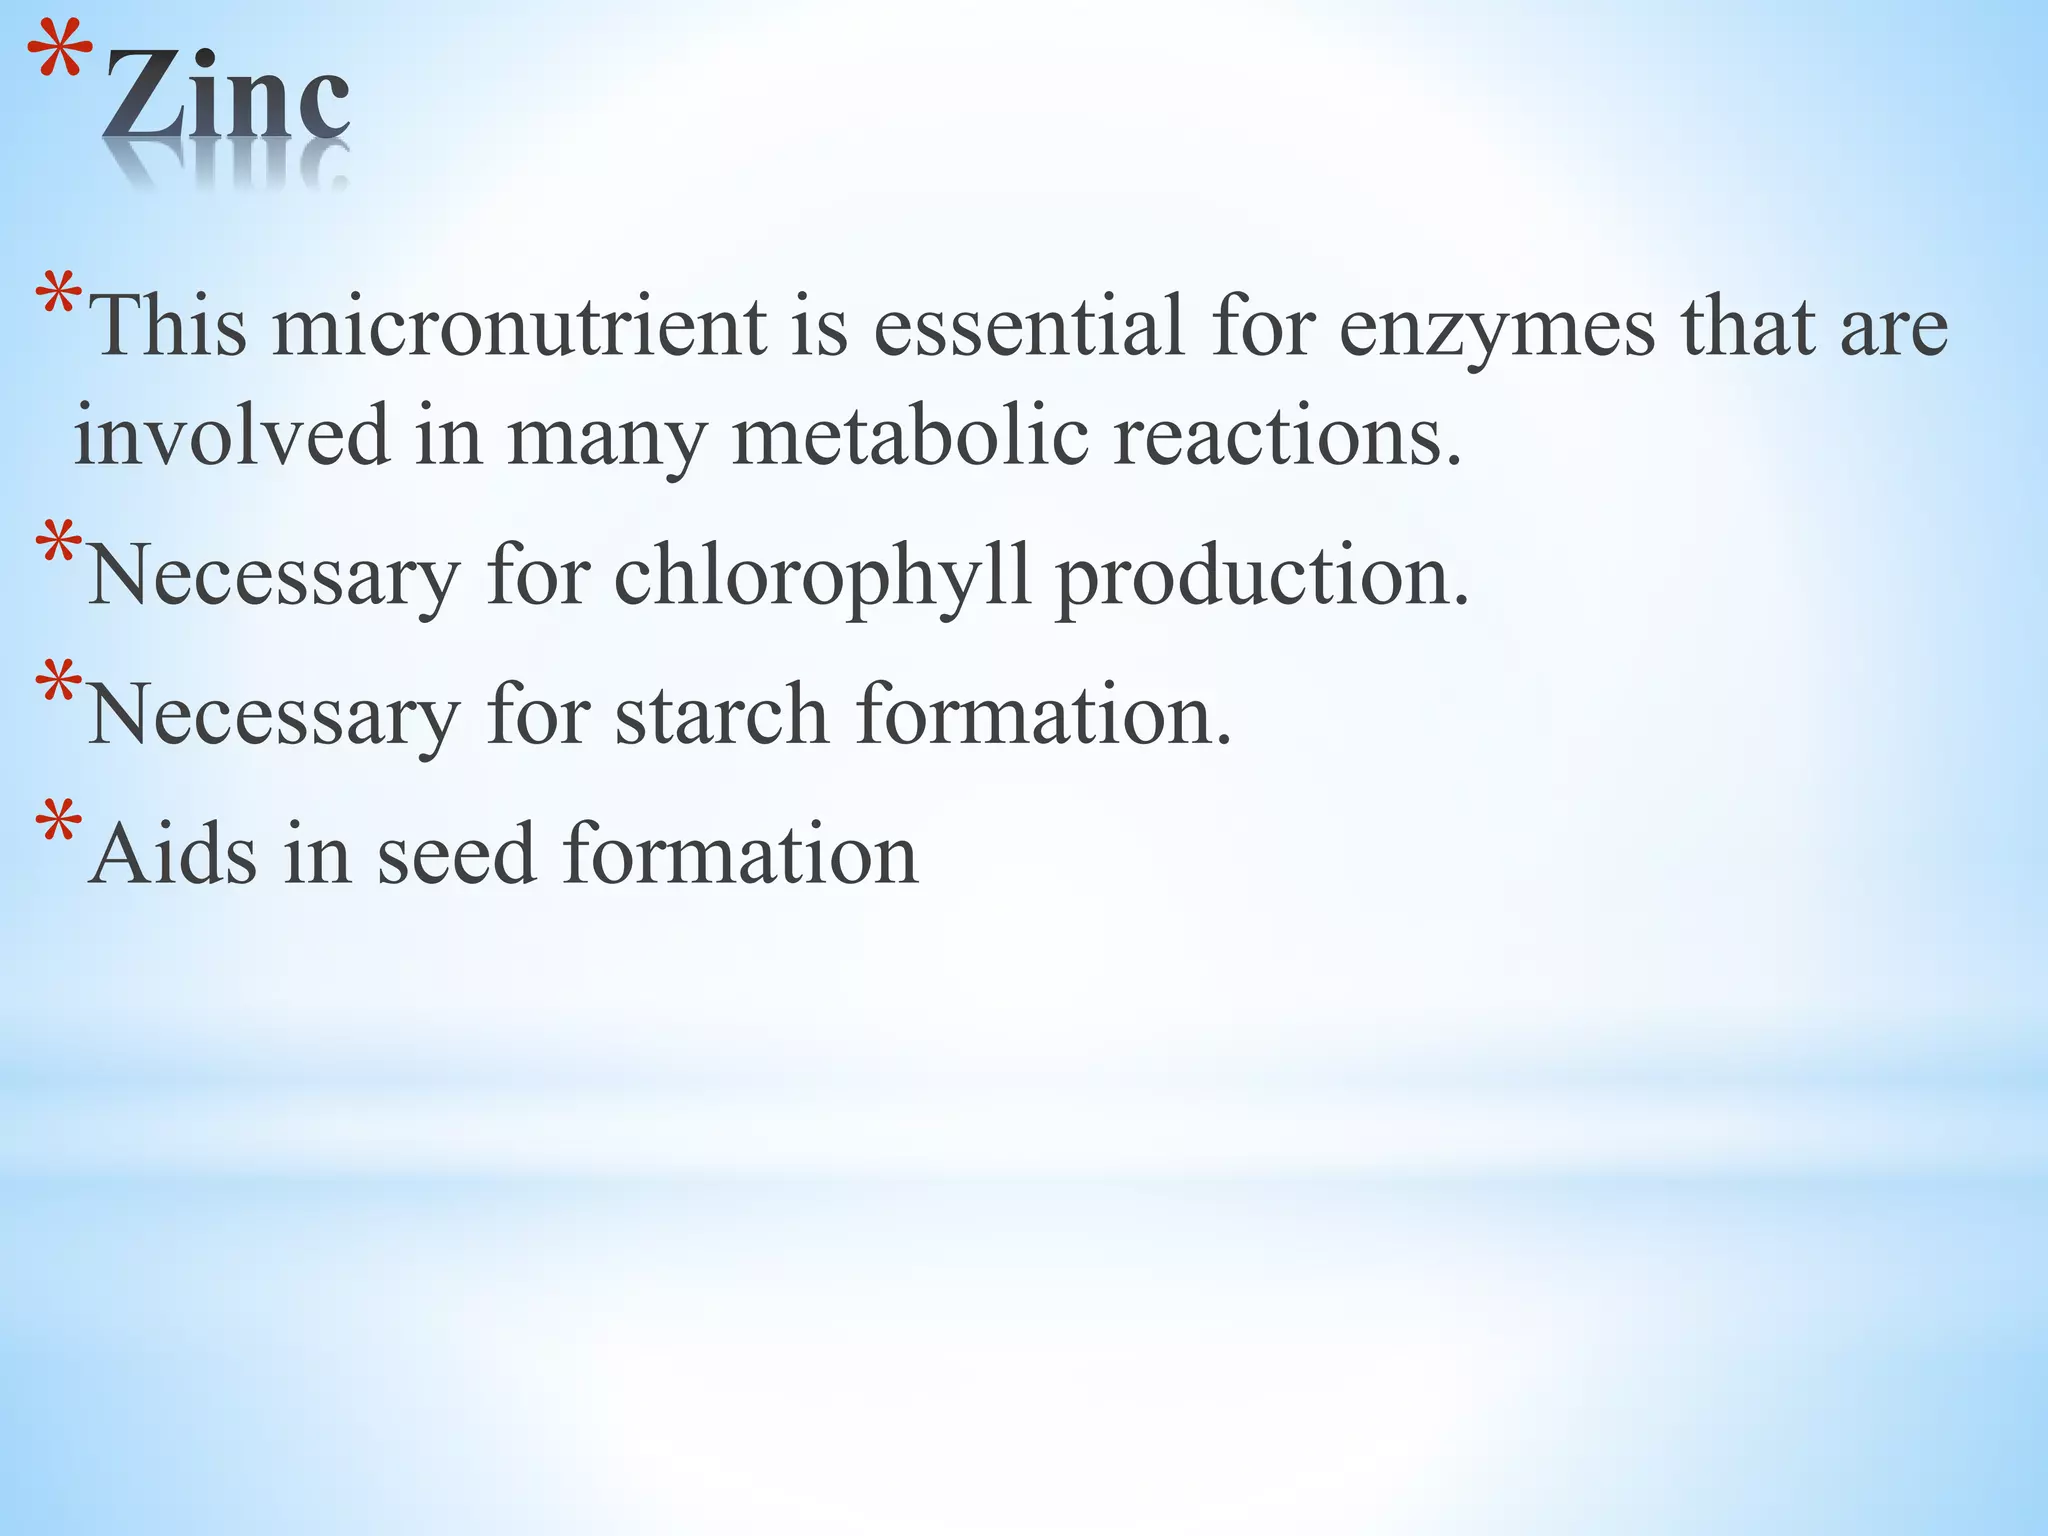

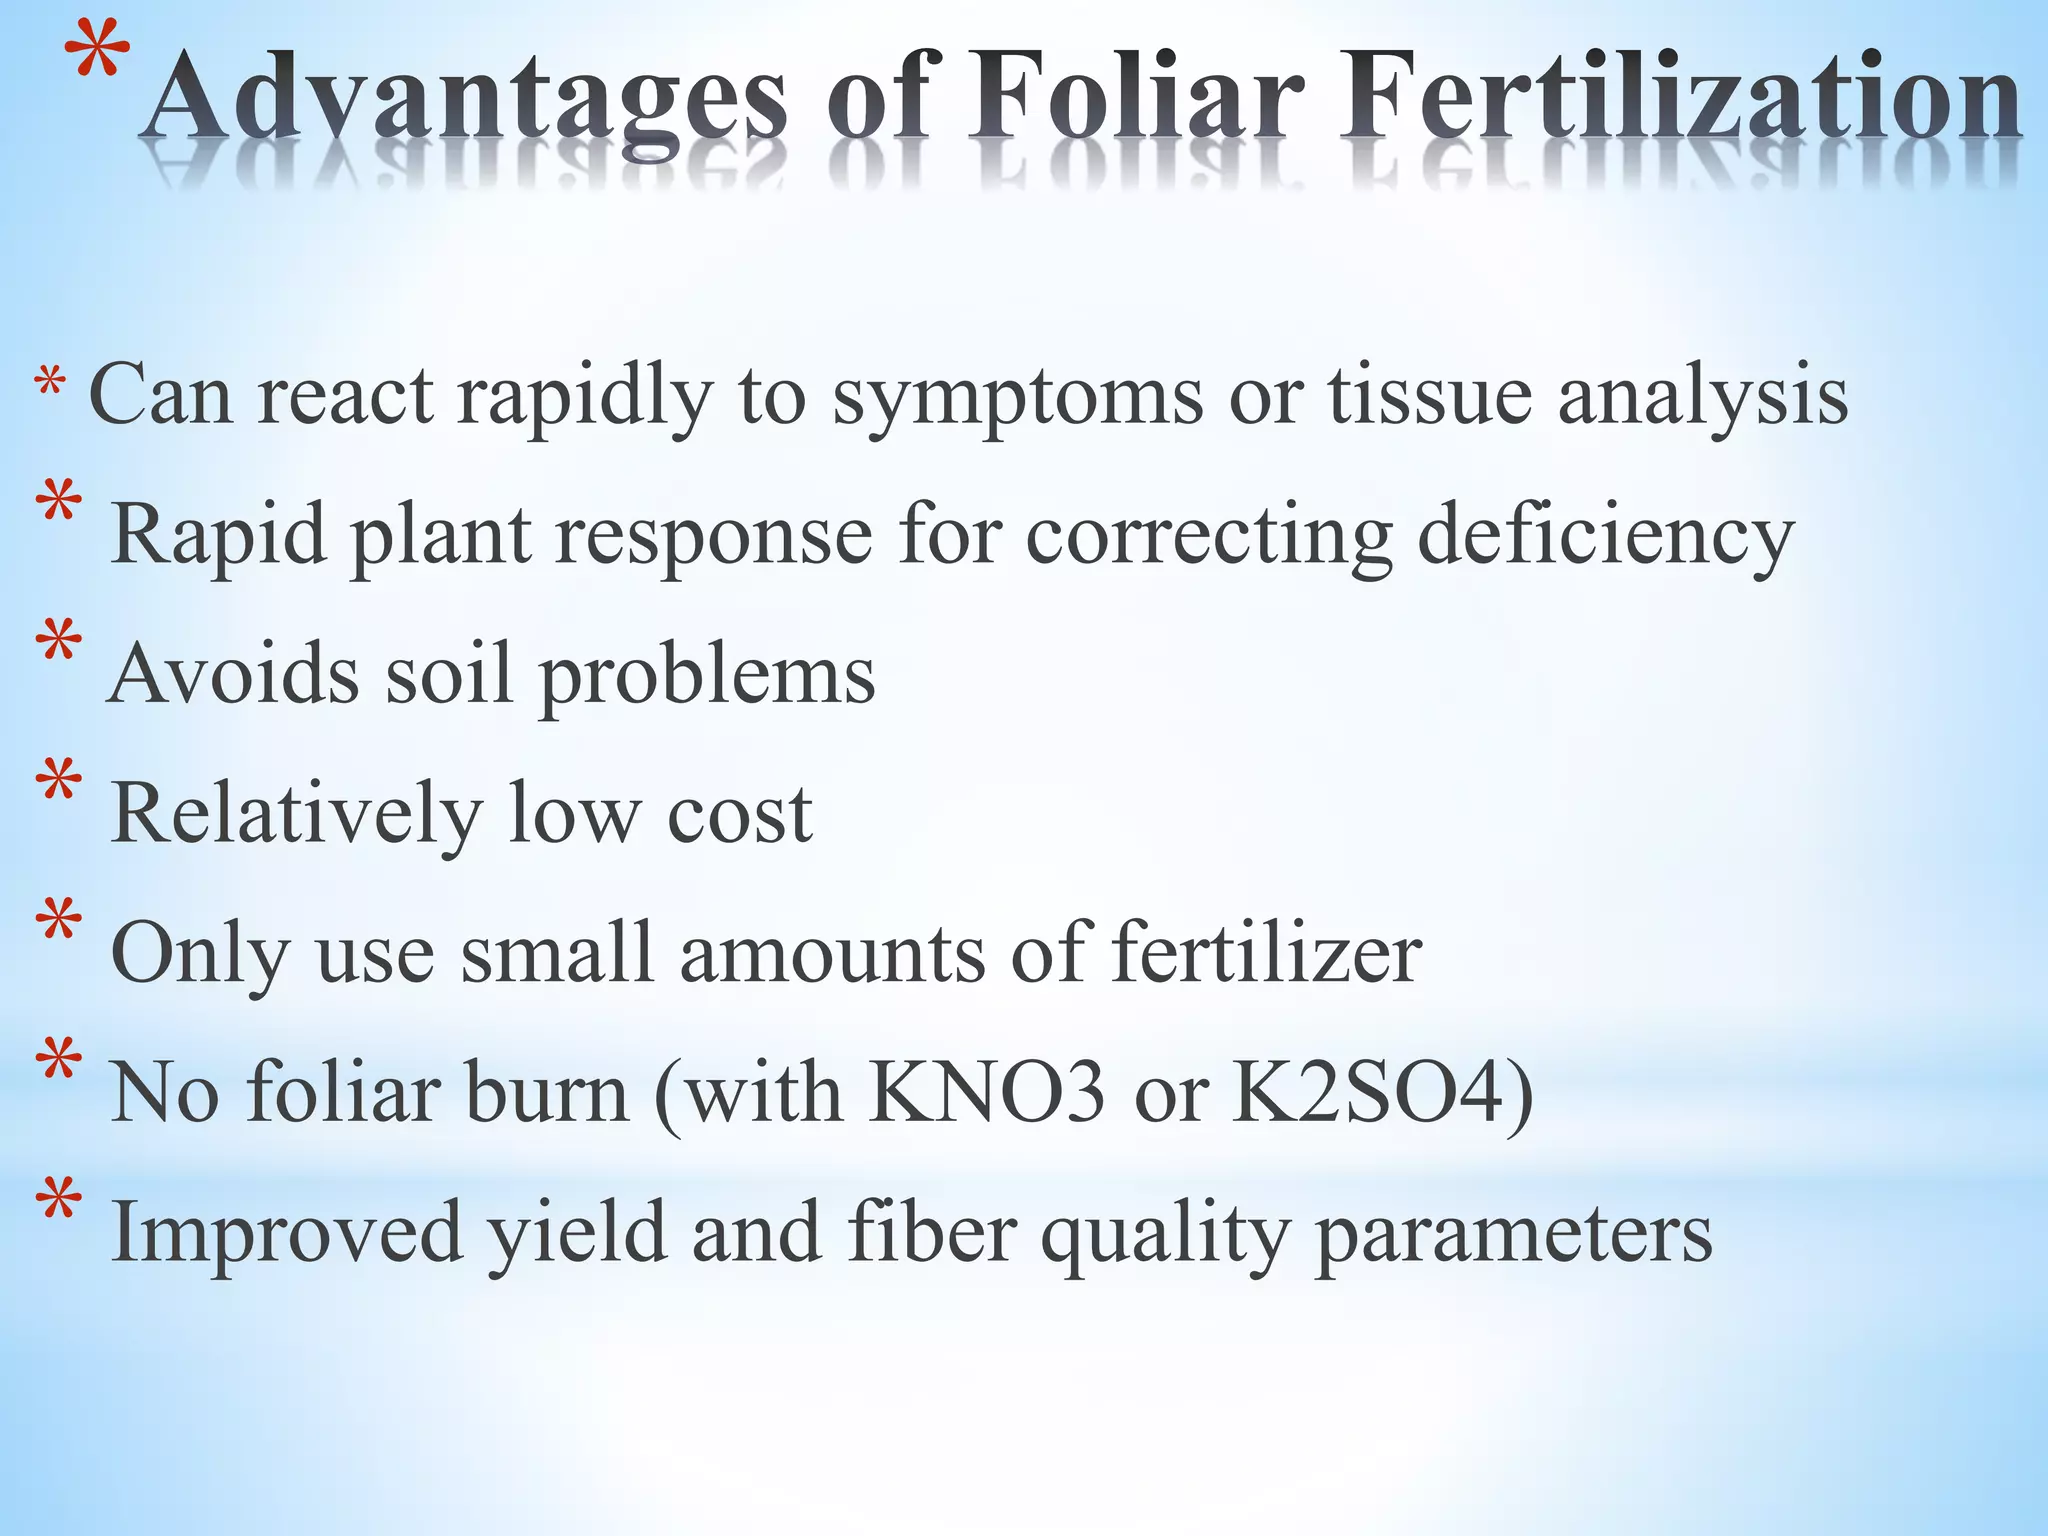
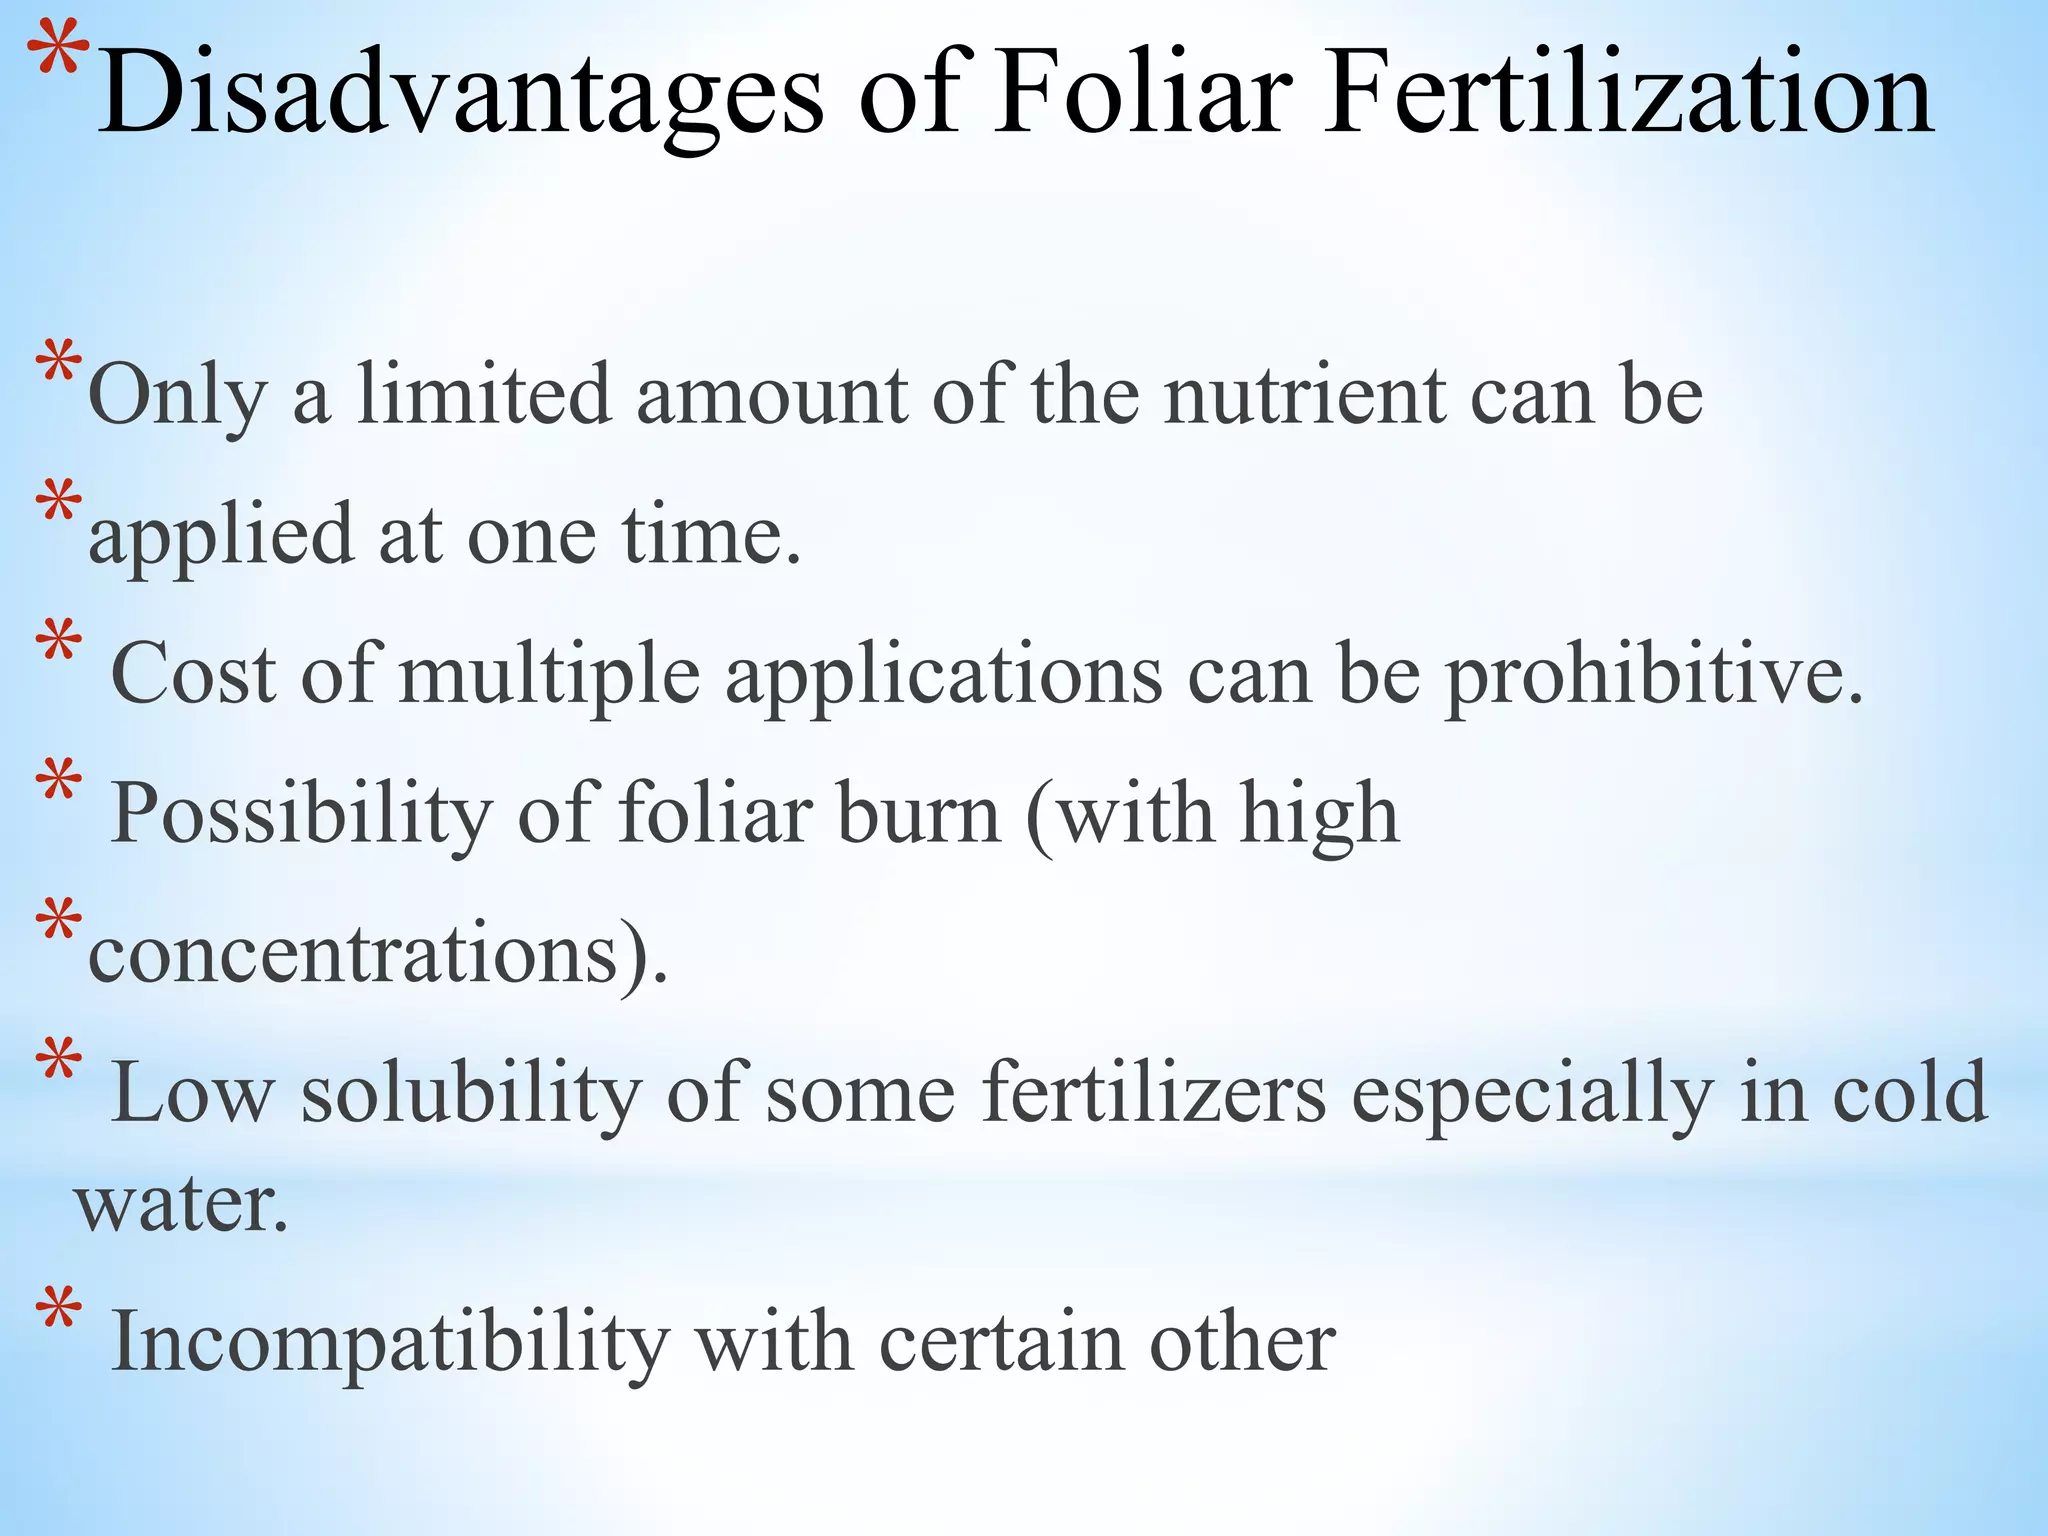
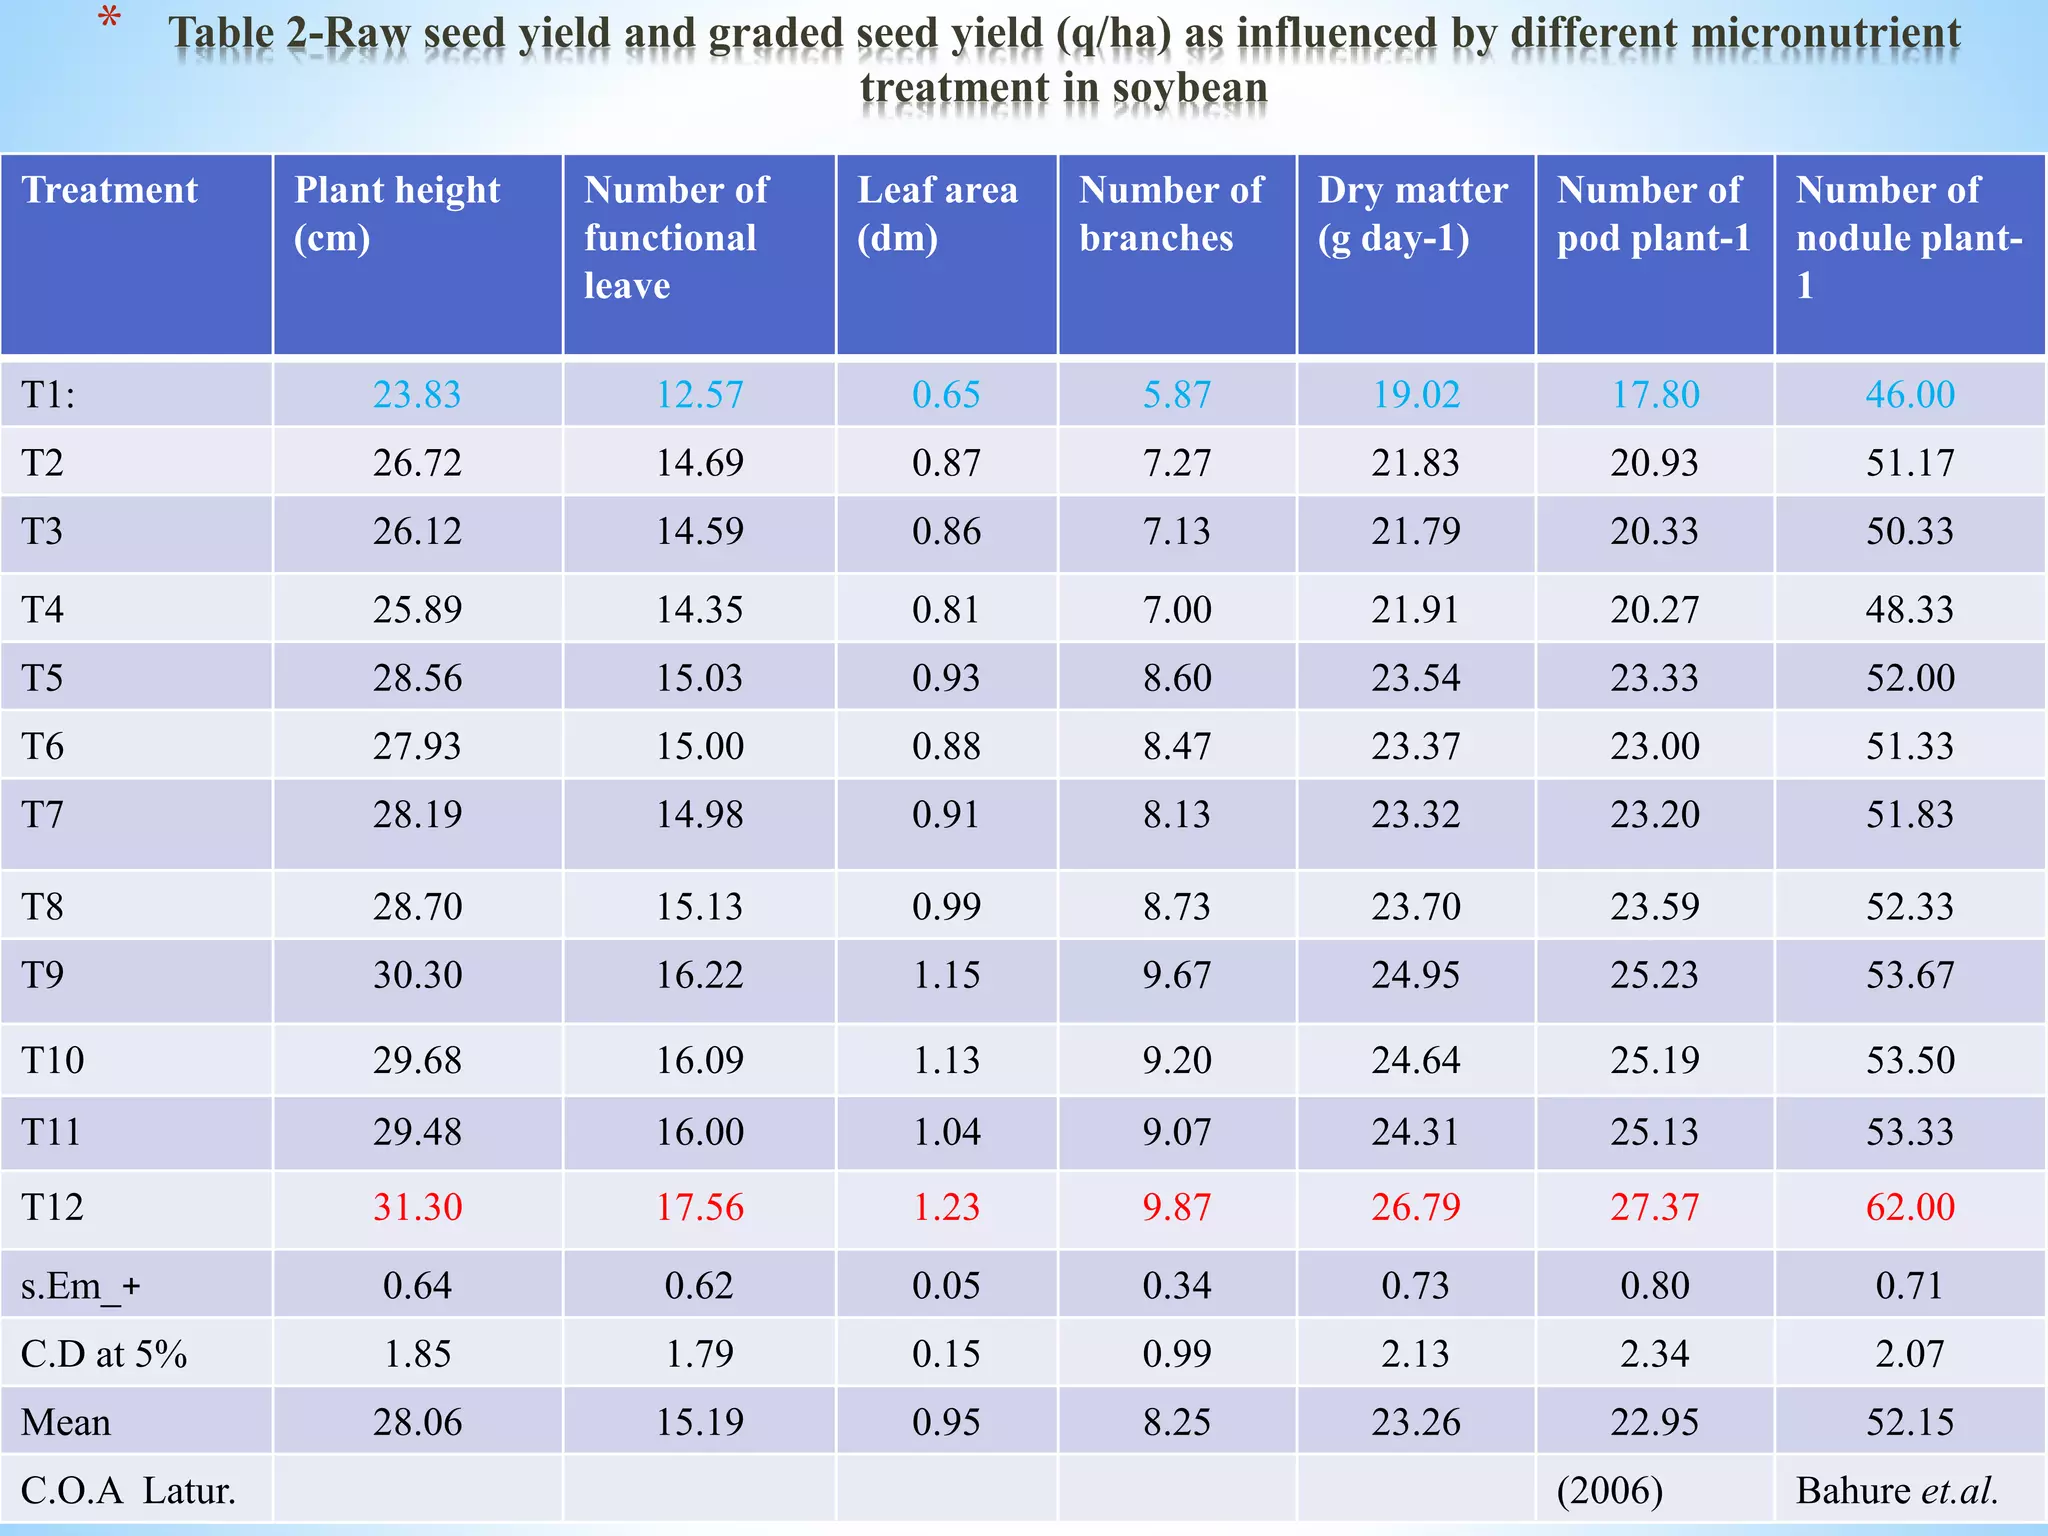
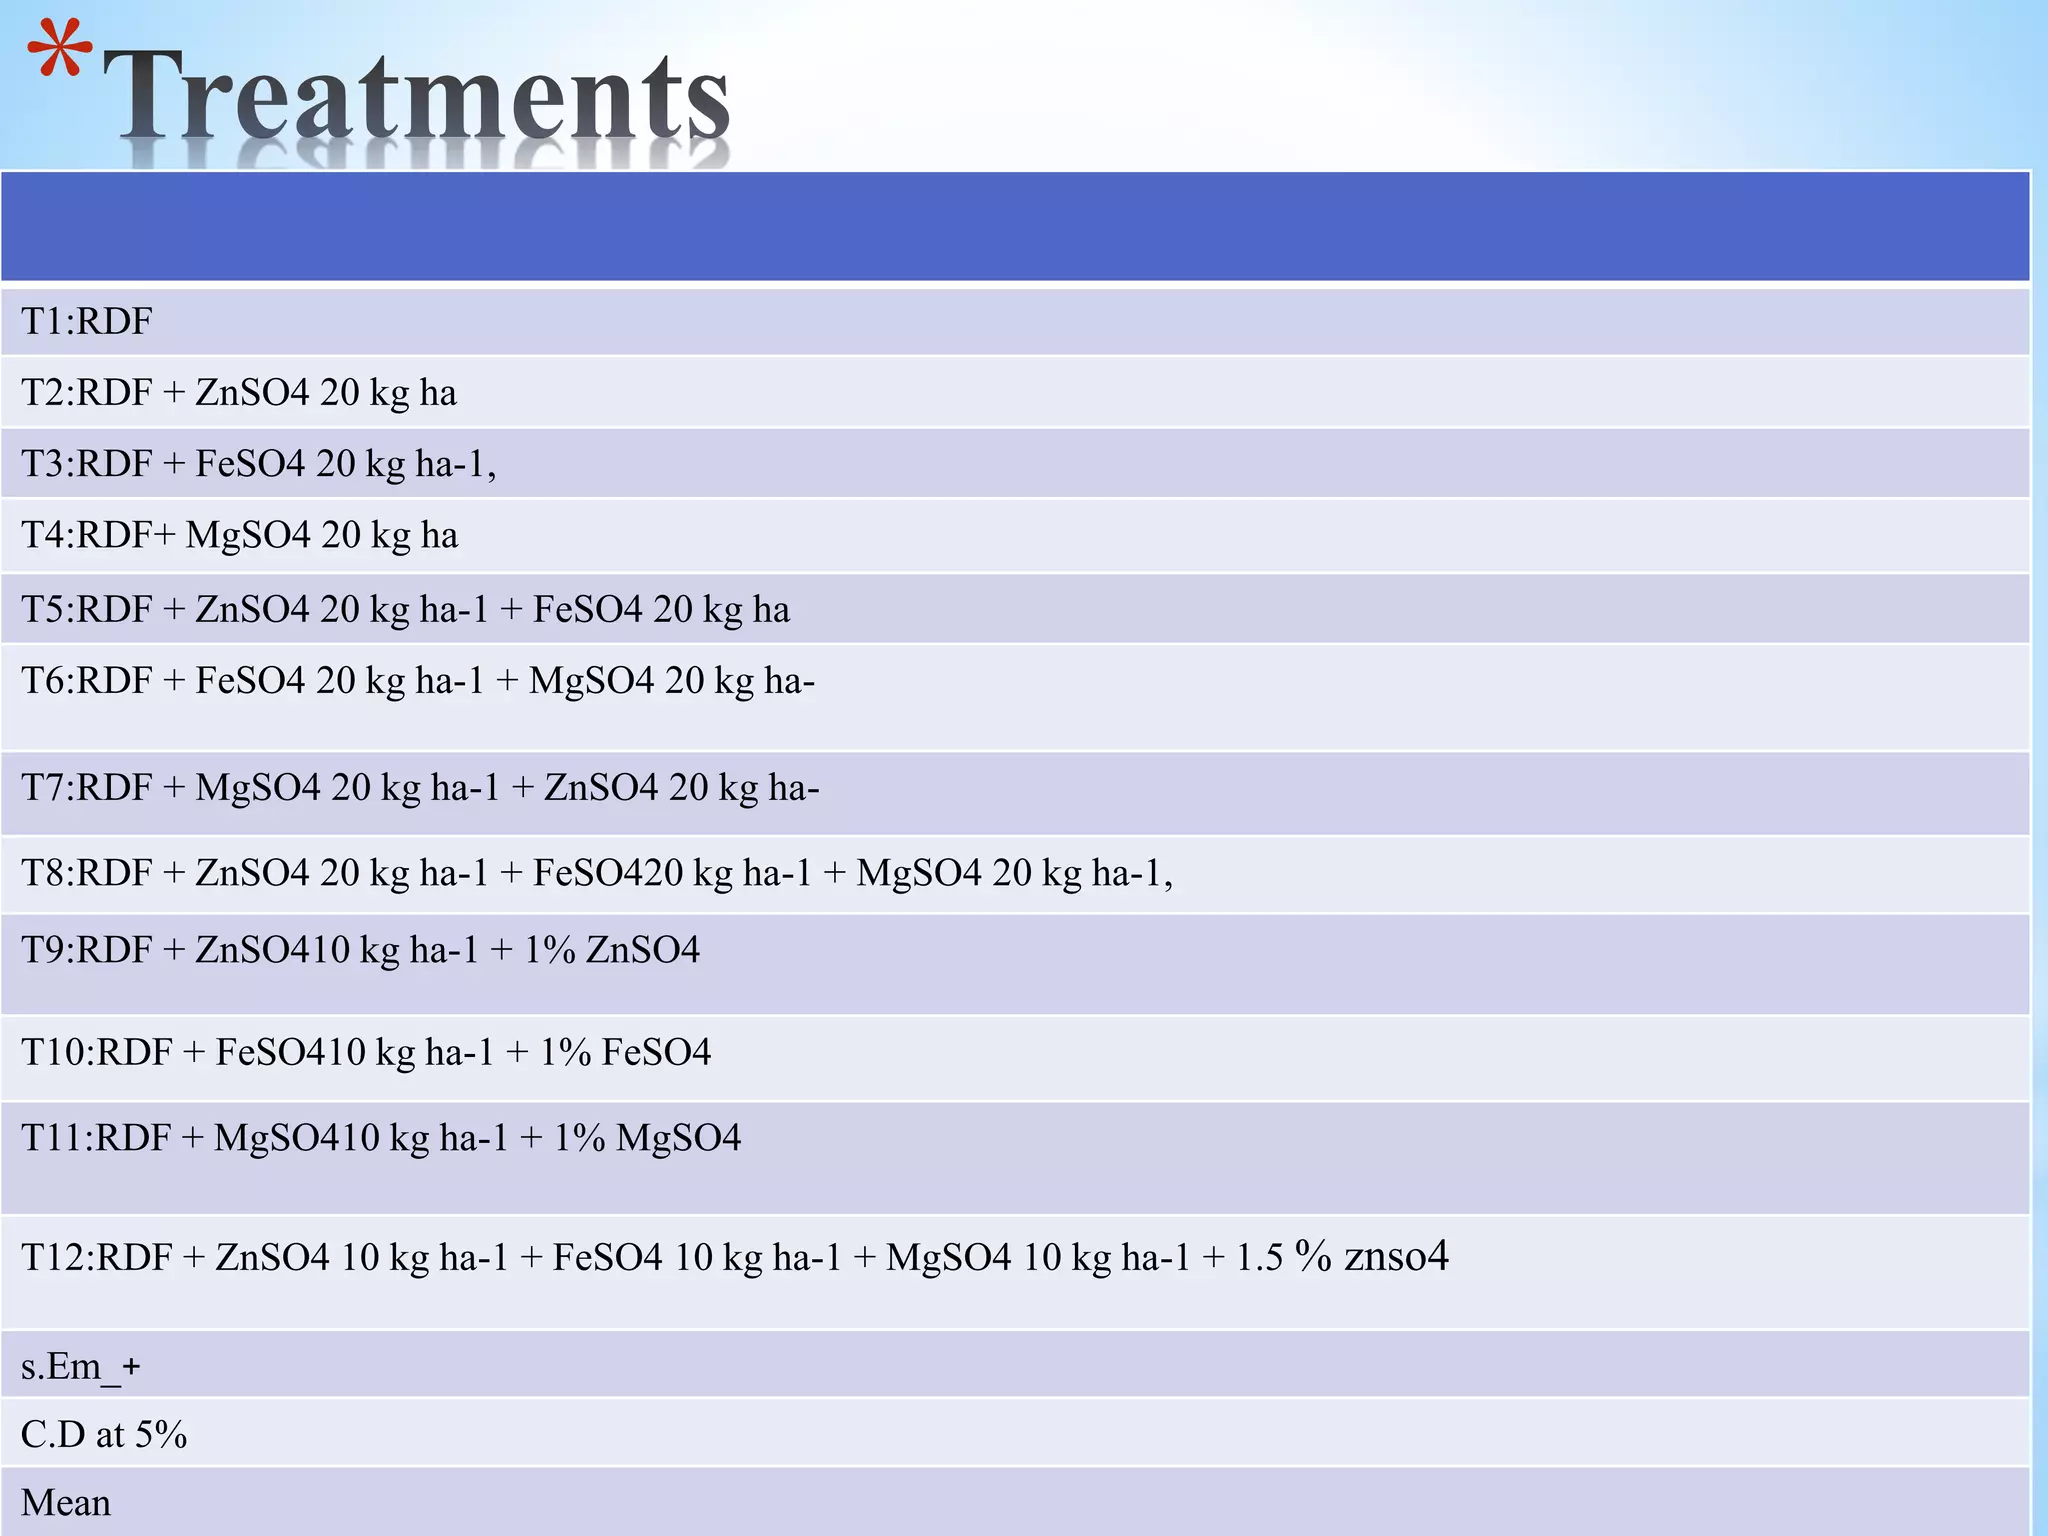
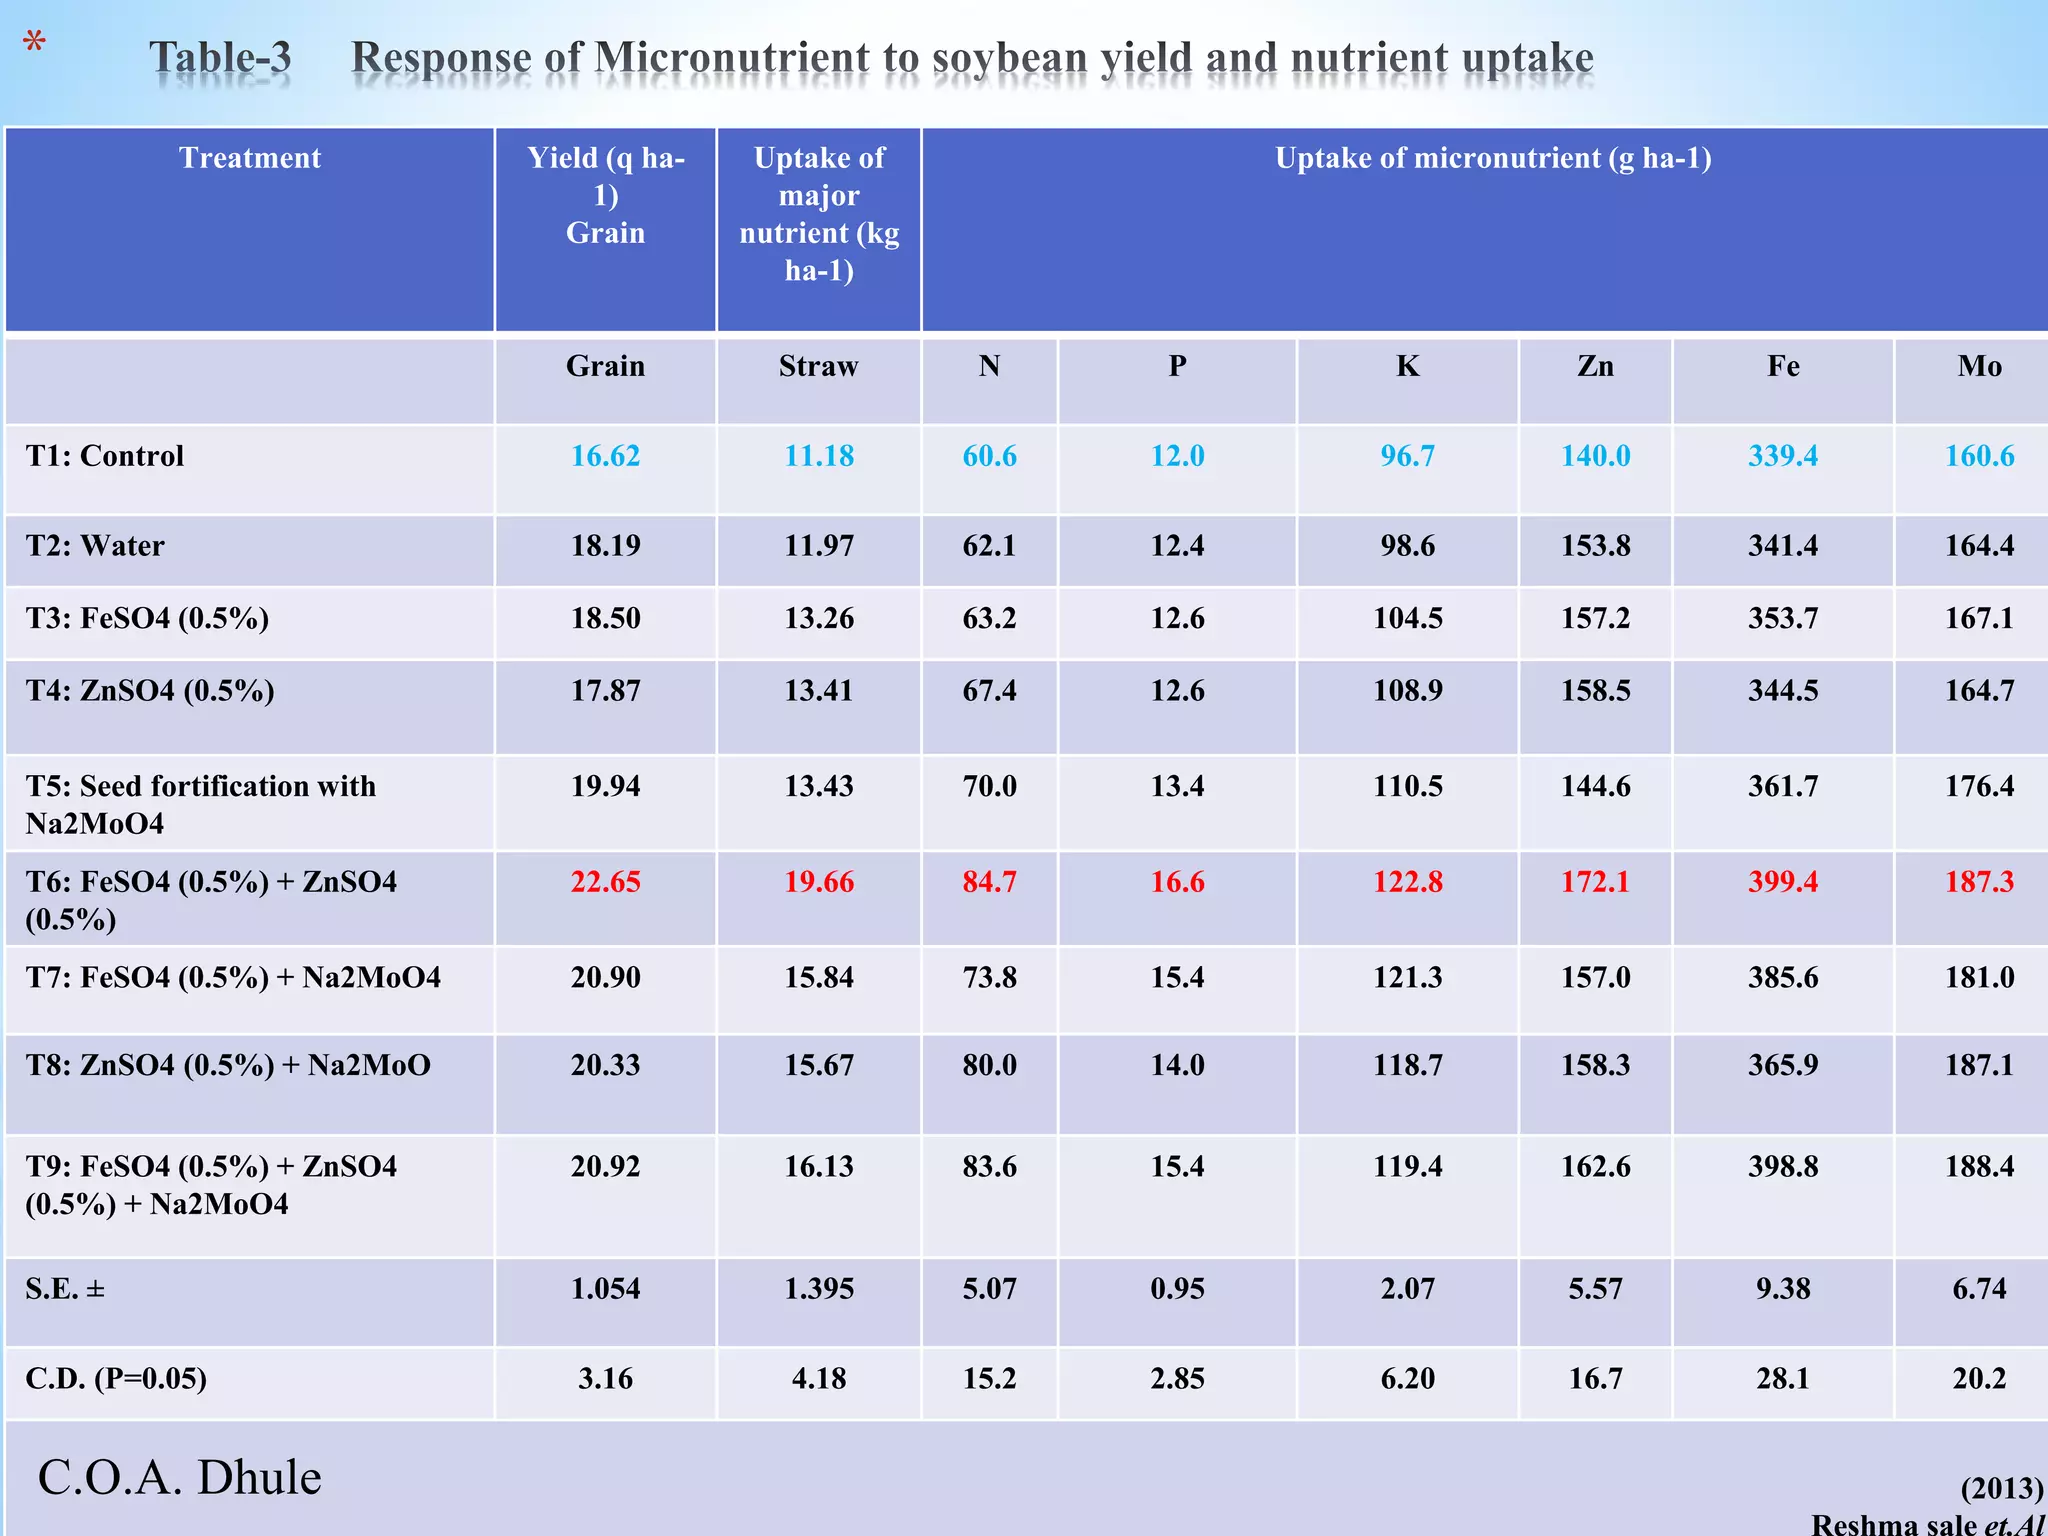
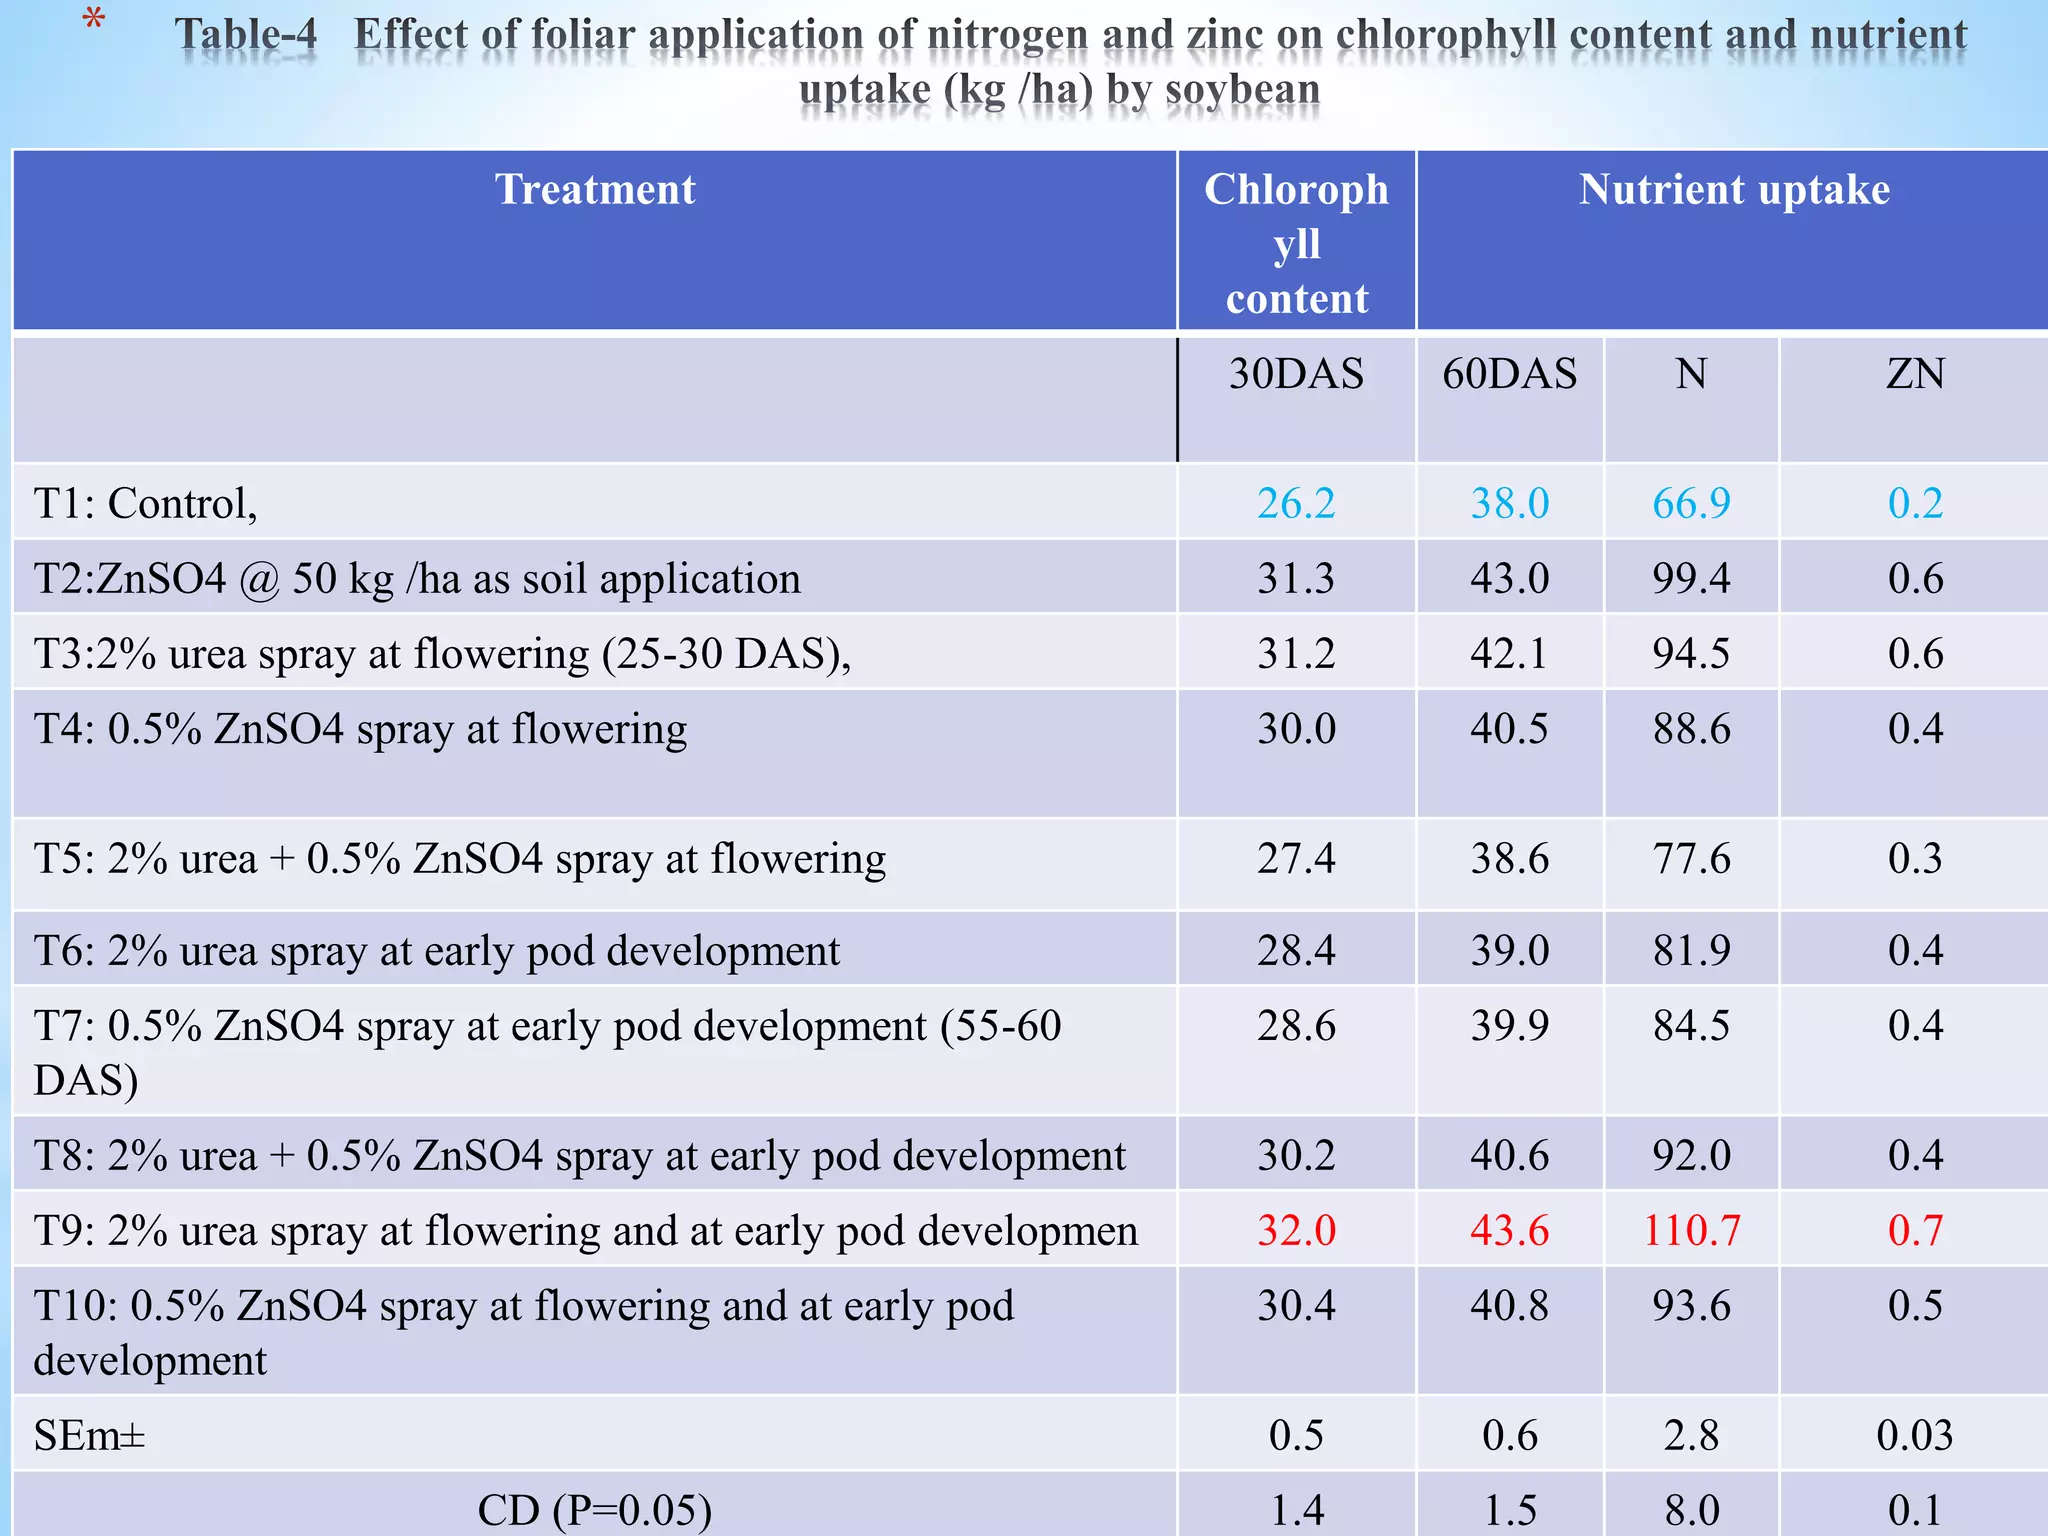
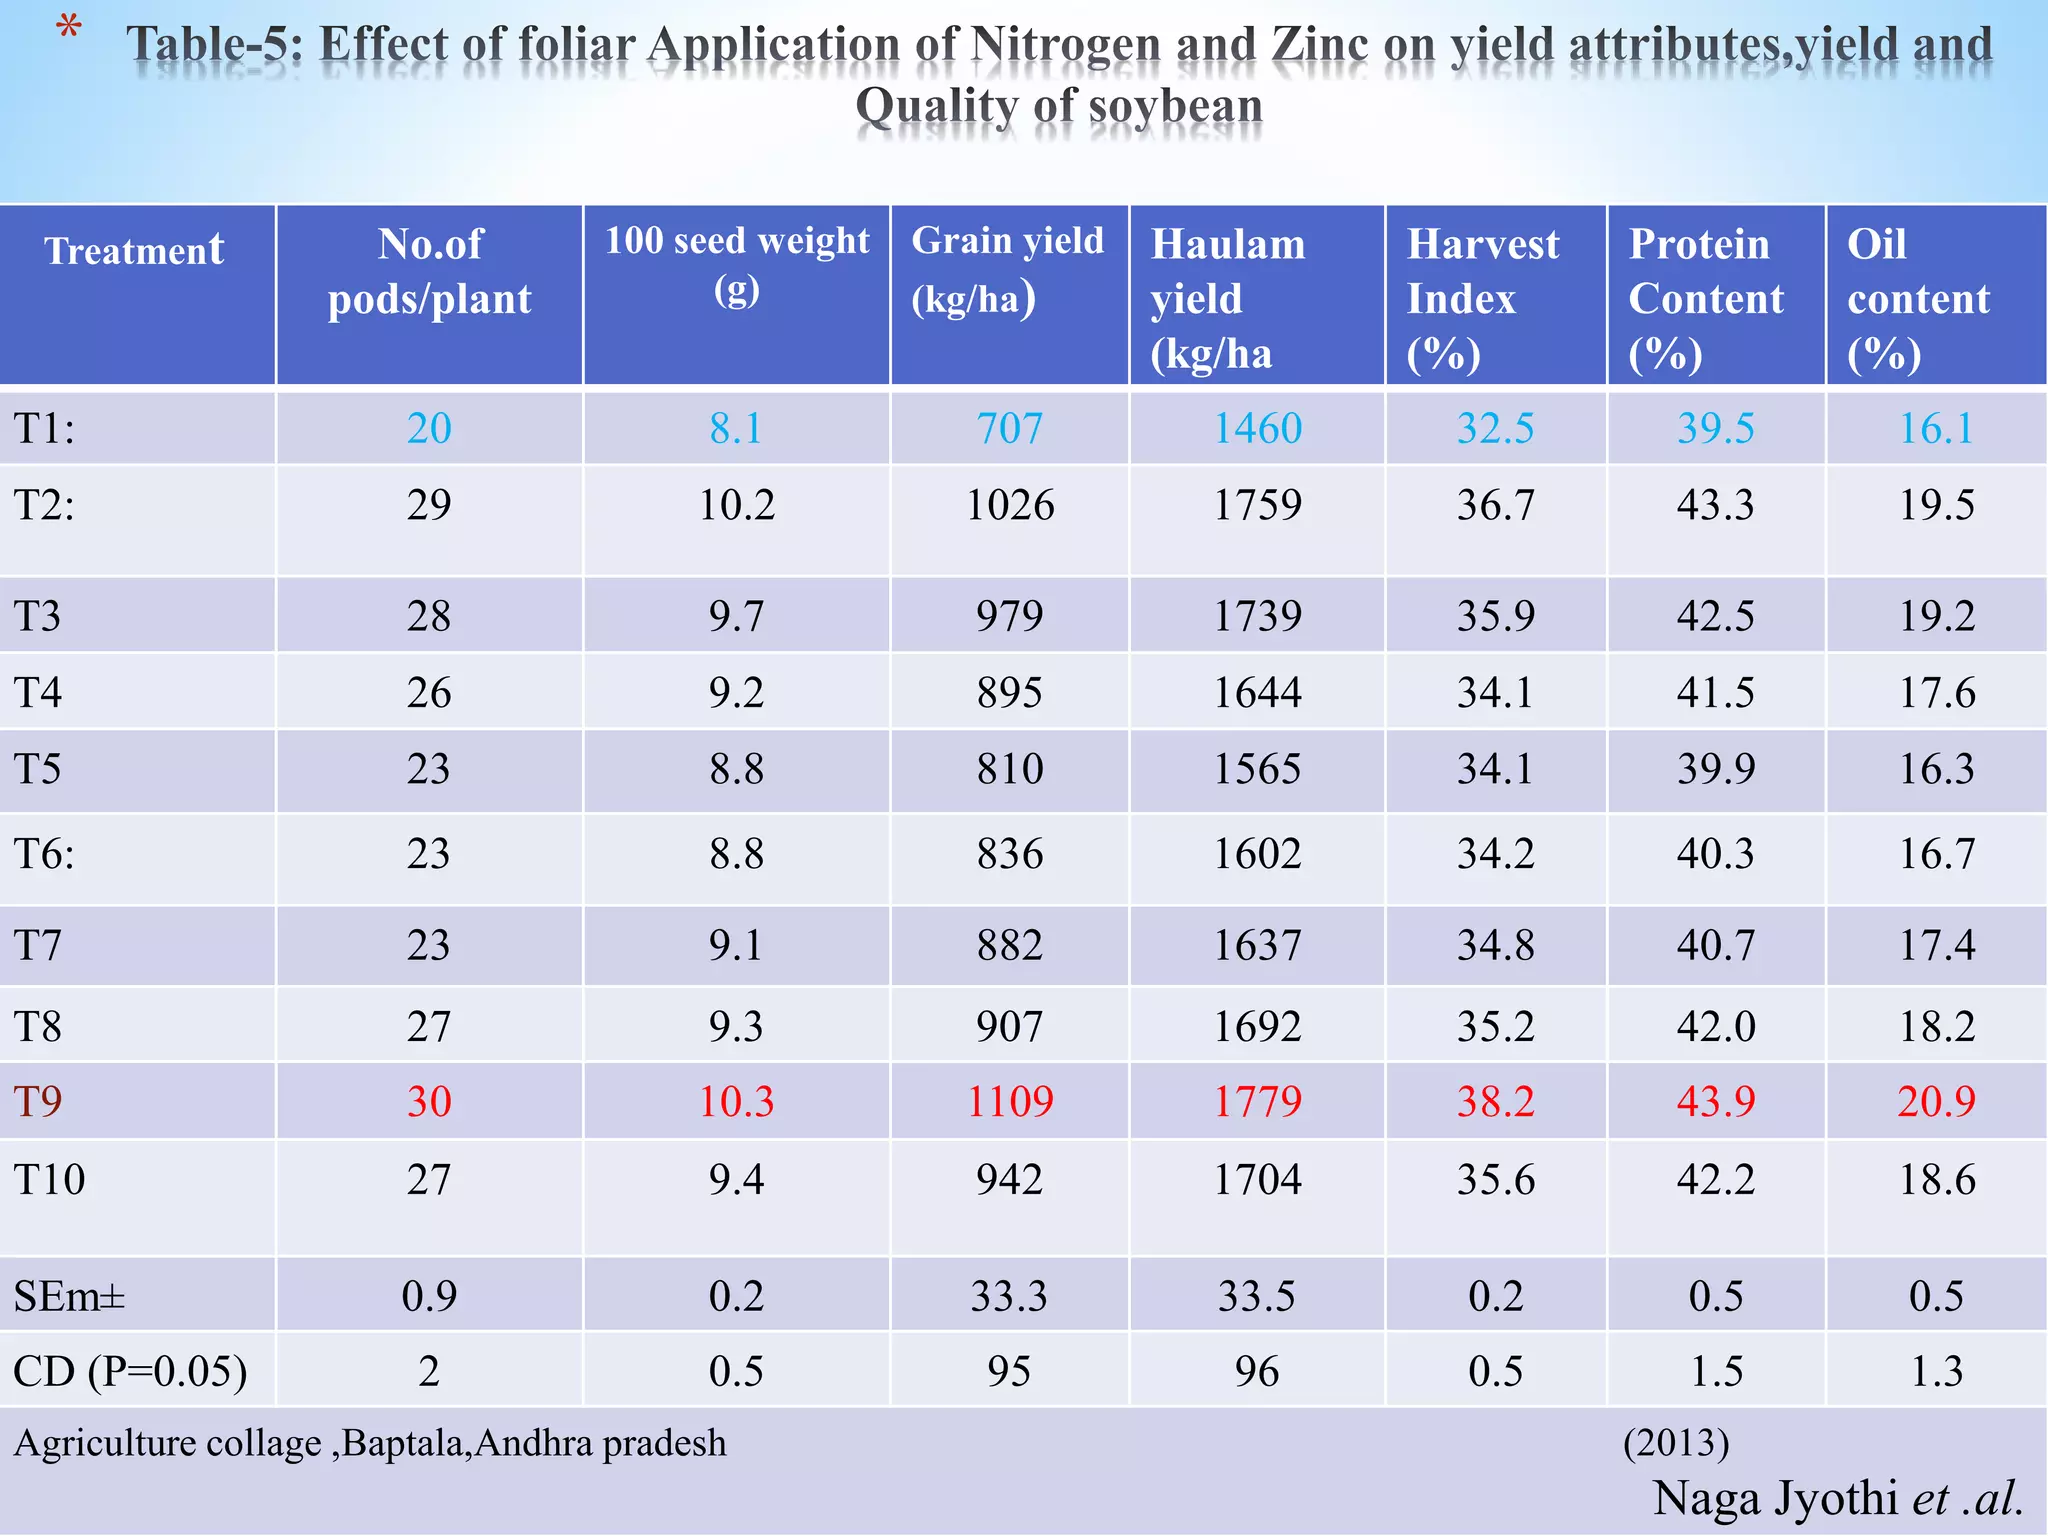
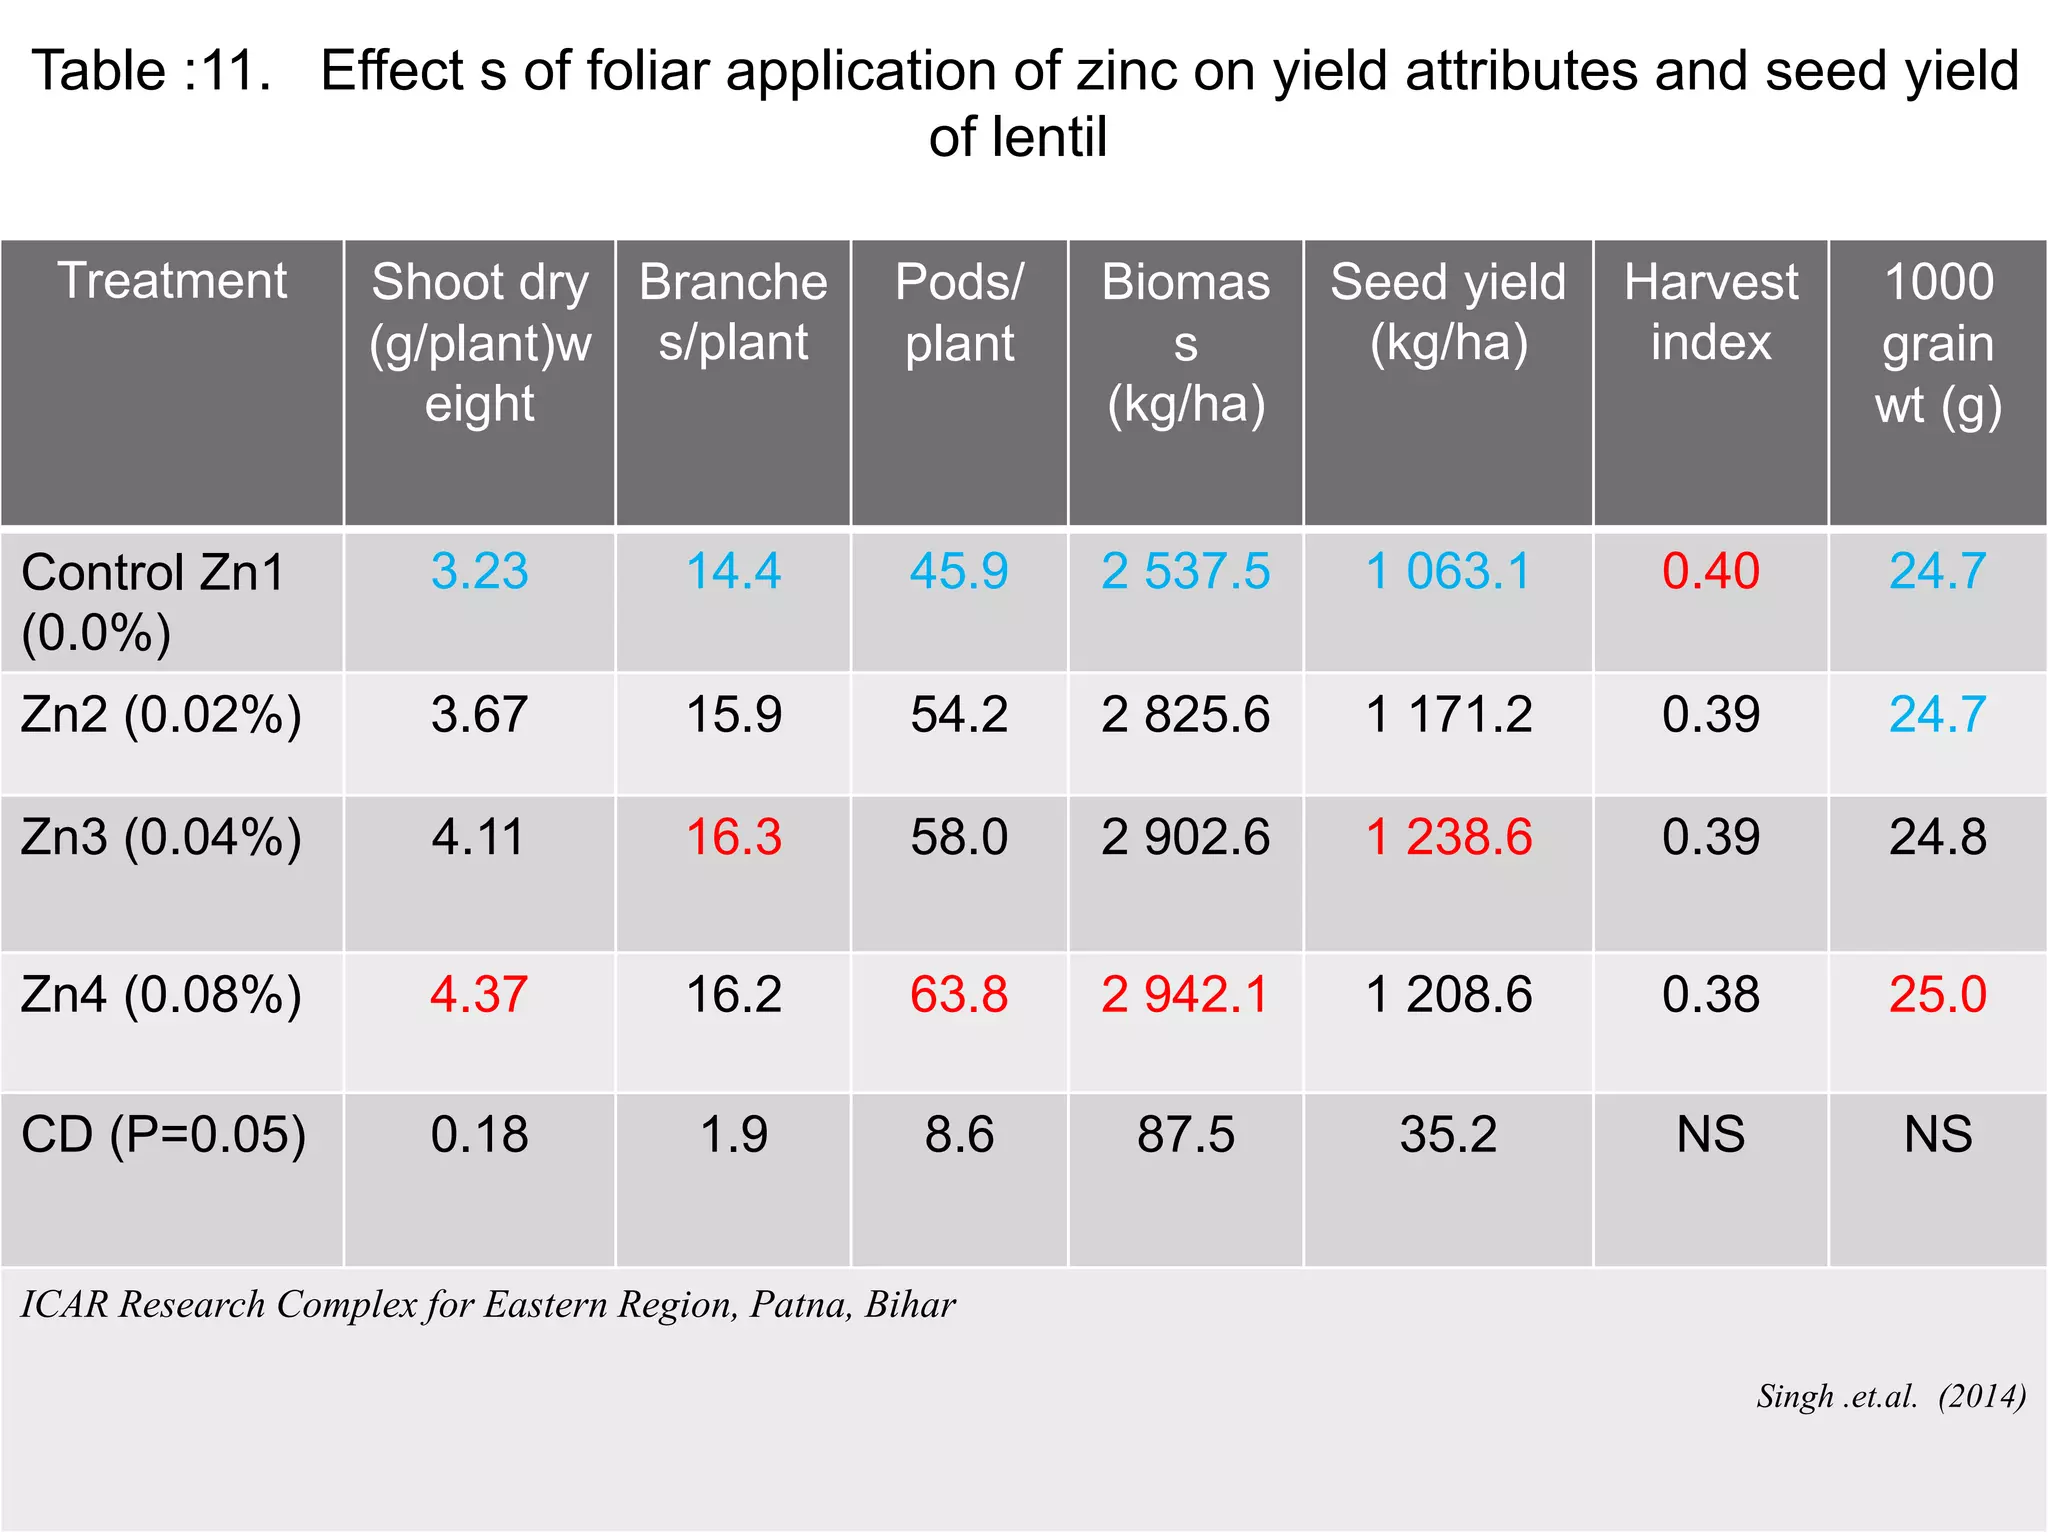
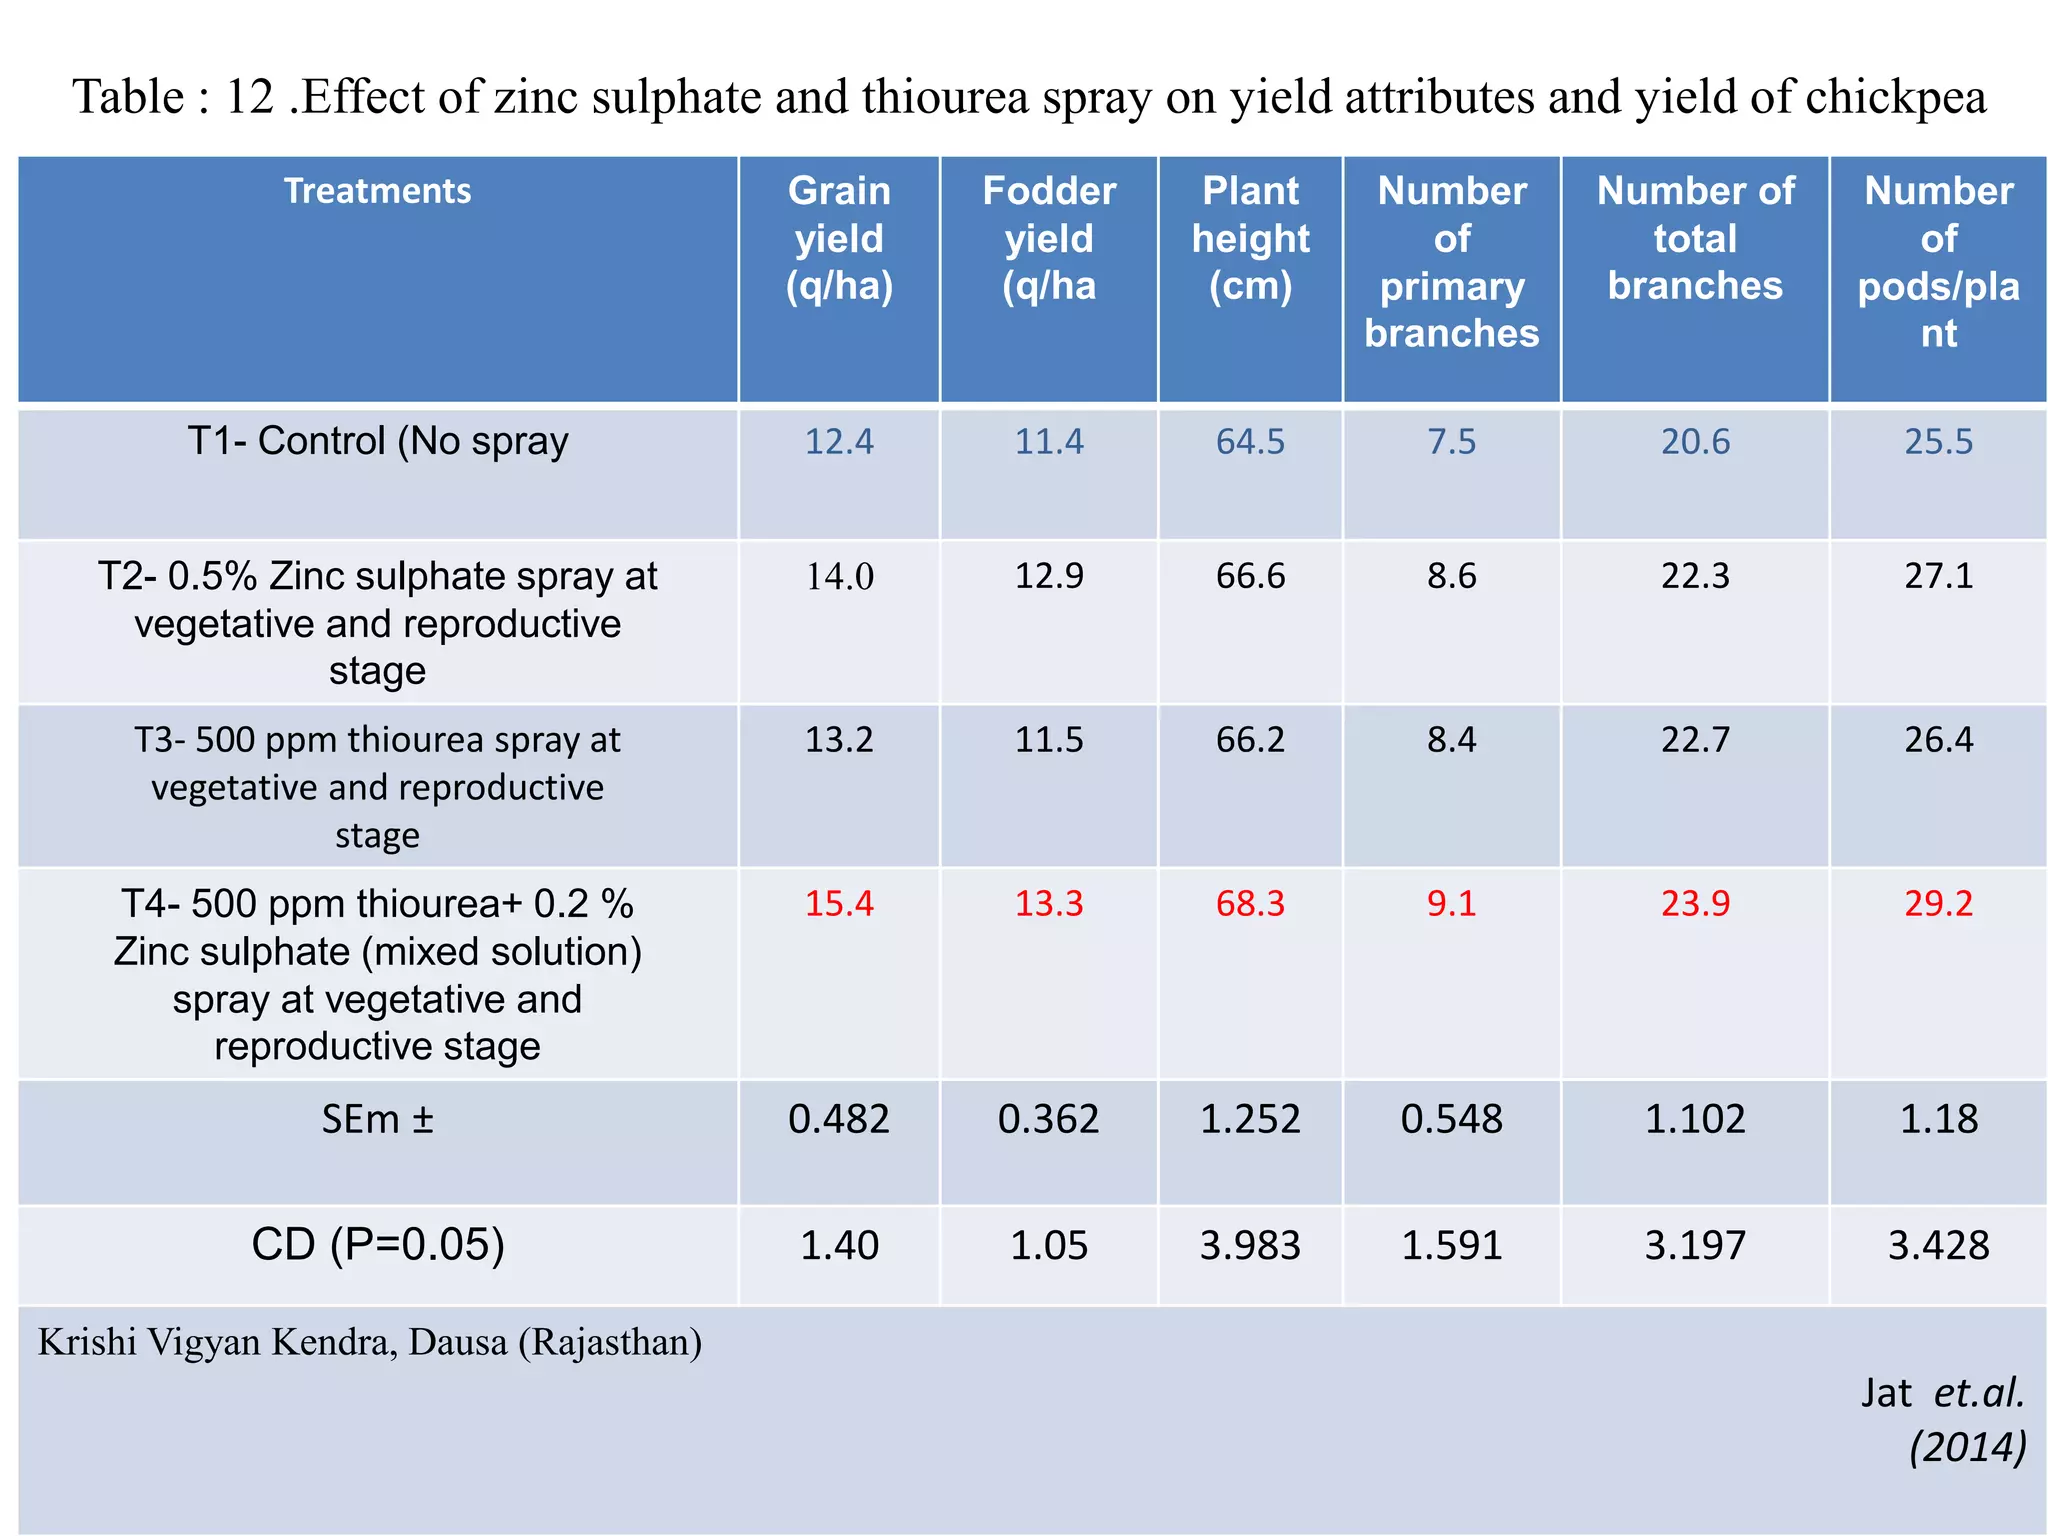
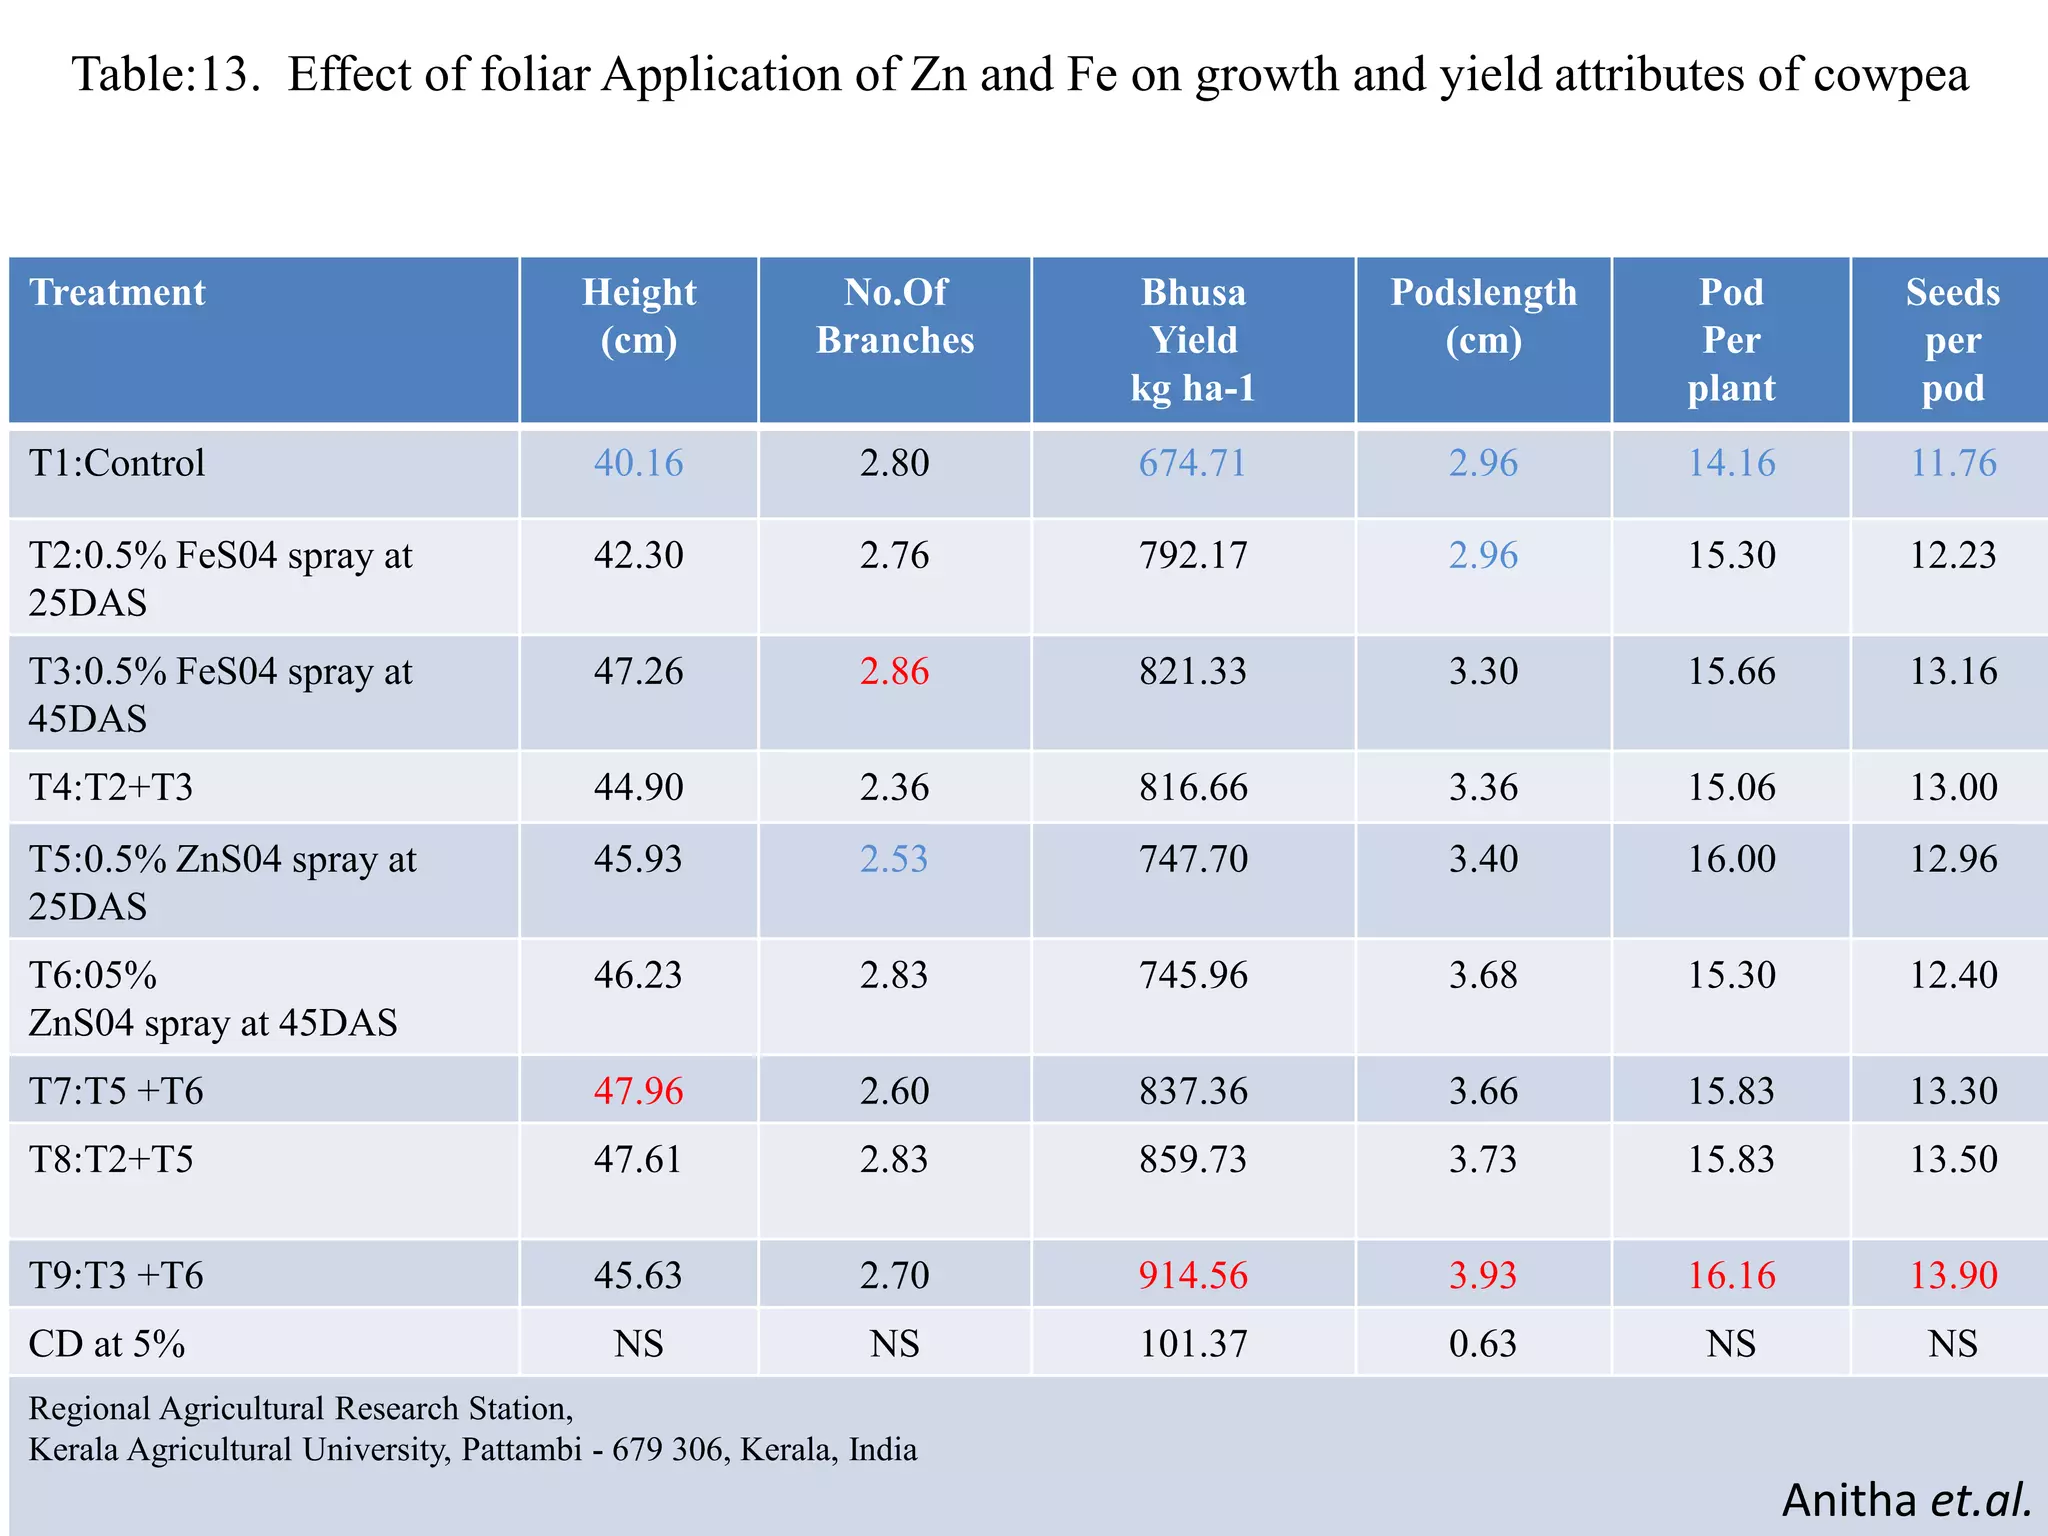
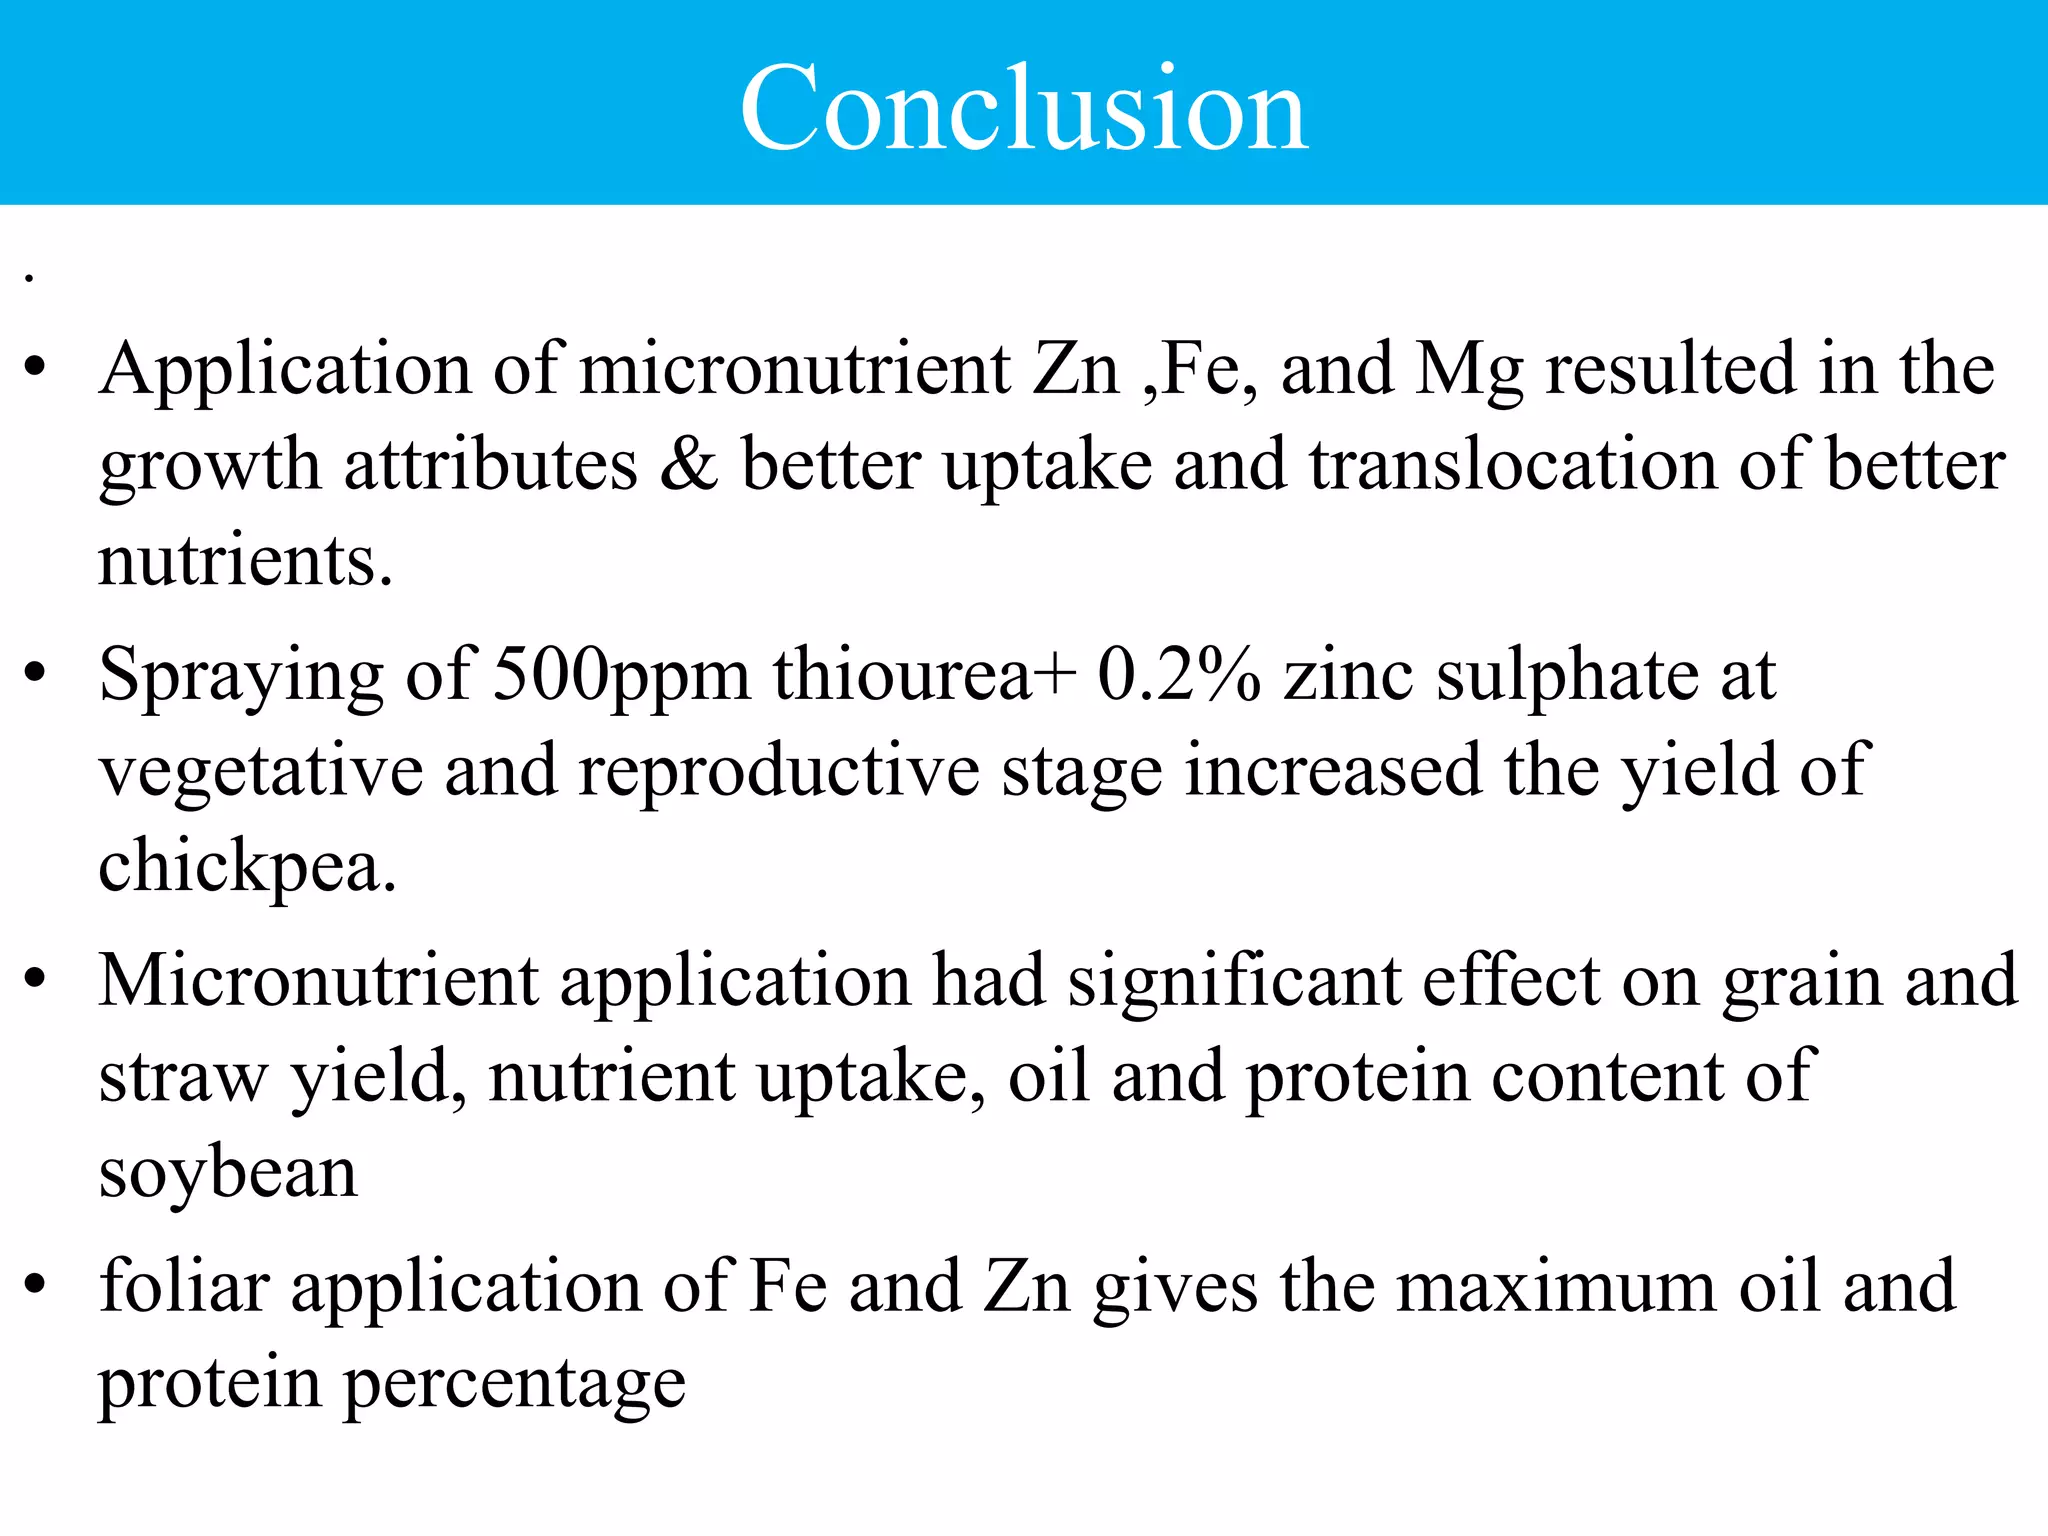

The document presents a seminar on the influence of foliar application of micronutrients on pulse crops, highlighting their role in enhancing soil fertility and crop yield. It discusses various micronutrients such as zinc, boron, and molybdenum, detailing their effects on plant health and productivity. Additionally, the document examines the methods of foliar fertilization, the benefits and drawbacks, and provides experimental results of nutrient treatments on crop yields.


