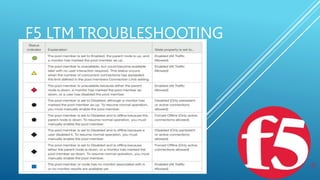
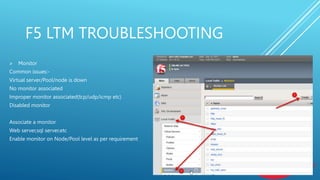
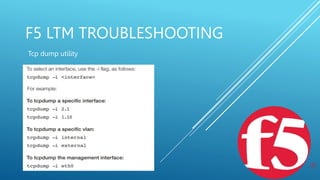
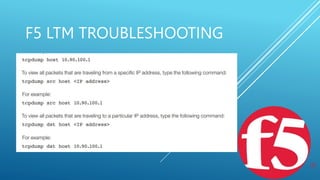
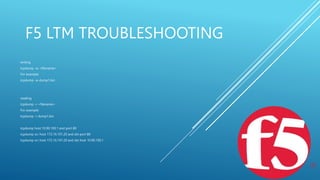
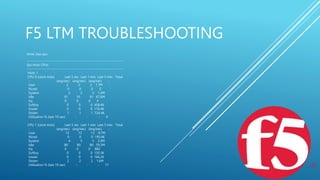
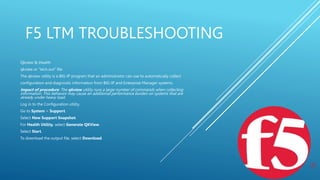
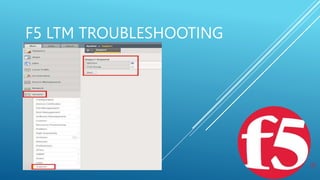
F5 LTM TROUBLESHOOTING
 Virtual Server
 Pools
 Nodes
 Monitors
 Profiles
F5 LTM TROUBLESHOOTING
 Virtual Server
Virtual server issues:-
Unable to reach URL
Getting error in URL eg: Http,SQL
Traffic not reaching F5 device
Ping the virtual server & telnet on the port
Check pool/node/monitor status
Check for SSL profile association
CURL test on CLI I,e:time curl https://192.168.10.20
F5 LTM TROUBLESHOOTING
 Pools
Common issues:-
Node is down
Monitor is down
No association with Virtual server
Incorrect monitor associated
Disabled Node/pool
Ping the Node ip & telnet to respective port I,e :- 80,443
Check monitor status is green
Check for association of Pool members to Virtual server
Associate right monitor for eg: SQL/icmp/https etc
Enable node/pool as required
F5 LTM TROUBLESHOOTING
 NODE(Member)
Common issues:-
Node is down
Node is up but not responding ie Ping/trace
Node is up & responding to ping & trace/telnet
Node is marked down
Node is not functional /server not built
Blocking of IP may be due to firewall/dmz & no associated monitor
Service disabled or need as restart on server side eg:-web server
F5 admin has marked down due to decommissioned or faulty server
F5 LTM TROUBLESHOOTING
 Monitor
Common issues:-
Virtual server/Pool/node is down
No monitor associated
Improper monitor associated(tcp/udp/icmp etc)
Disabled monitor
Associate a monitor
Web server,sql server,etc
Enable monitor on Node/Pool level as per requirement
F5 LTM TROUBLESHOOTING
System events
System event messages are based on Linux events, and are not specific to
the BIG-IP system.
Packet filter events
Packet filter messages are those that result from the implementation of
packet filters and packet-filter rules.
Local traffic events
Local-traffic event messages pertain specifically to the local traffic
management system.
Audit events
Audit event messages are those that the BIG-IP system logs as a result of
changes to the BIG-IP system
configuration. Logging audit events is optional.
F5 LTM TROUBLESHOOTING
Some of the specific types of events that the BIG-IP system displays on the Local Traffic logging screen are:
• Address Resolution Protocol (ARP) packet and ARP cache events
• bigdb database events (such as populating and persisting bigdb variables)
• HTTP protocol events
• HTTP compression events
• IP packet discard events due to exceptional circumstances or invalid parameters (such as a bad
checksum)
• Layer 4 events (events related to TCP, UDP, and Fast L4 processing)
• MCP/TMM configuration
• Monitor configuration events
• Network events (Layers 1 and 2)
• Packet Velocity® ASIC (PVA) configuration events
• iRule events related to run-time iRule processing
• SSL traffic processing events
• General TMM events such as TMM startup and shutdown
F5 LTM TROUBLESHOOTING
Tcp dump utility
F5 LTM TROUBLESHOOTING
writing
tcpdump -w <filename>
For example:
tcpdump -w dump1.bin
reading
tcpdump -r <filename>
For example:
tcpdump -r dump1.bin
tcpdump host 10.90.100.1 and port 80
tcpdump src host 172.16.101.20 and dst port 80
tcpdump src host 172.16.101.20 and dst host 10.90.100.1
F5 LTM TROUBLESHOOTING
show /sys cpu
-------------------------------------------------------------------------
Sys::Host CPUs
-------------------------------------------------------------------------
Host: 1
CPU 0 (clock ticks) Last 5 sec Last 1 min Last 5 min Total
- (avg/sec) (avg/sec) (avg/sec) -
User 2 2 2 1.7M
Niced 0 0 0 0
System 2 2 2 1.2M
Idle 91 91 91 67.6M
Irq 0 0 0 4
Softirq 0 0 0 458.4K
Iowait 0 0 0 116.4K
Stolen 1 1 1 724.4K
Utilization % (last 10 sec) - - - 4
CPU 1 (clock ticks) Last 5 sec Last 1 min Last 5 min Total
- (avg/sec) (avg/sec) (avg/sec) -
User 13 13 13 9.7M
Niced 0 0 0 195.6K
System 4 5 5 3.4M
Idle 80 80 80 59.3M
Irq 0 0 0 882
Softirq 0 0 0 150.3K
Iowait 0 0 0 166.2K
Stolen 2 2 2 1.6M
Utilization % (last 10 sec) - - - 17
F5 LTM TROUBLESHOOTING
Qkview & ihealth
qkview or “tech.out” file
The qkview utility is a BIG-IP program that an administrator can use to automatically collect
configuration and diagnostic information from BIG-IP and Enterprise Manager systems.
Impact of procedure: The qkview utility runs a large number of commands when collecting
information. This behavior may cause an additional performance burden on systems that are
already under heavy load.
Log in to the Configuration utility.
Go to System > Support.
Select New Support Snapshot.
For Health Utility, select Generate QKView.
Select Start.
To download the output file, select Download.
F5 LTM TROUBLESHOOTING
Thank you 

F5 LTM TROUBLESHOOTING Guide latest.pptx

  • 1.
    F5 LTM TROUBLESHOOTING Virtual Server  Pools  Nodes  Monitors  Profiles
  • 2.
    F5 LTM TROUBLESHOOTING Virtual Server Virtual server issues:- Unable to reach URL Getting error in URL eg: Http,SQL Traffic not reaching F5 device Ping the virtual server & telnet on the port Check pool/node/monitor status Check for SSL profile association CURL test on CLI I,e:time curl https://192.168.10.20
  • 3.
  • 4.
    F5 LTM TROUBLESHOOTING Pools Common issues:- Node is down Monitor is down No association with Virtual server Incorrect monitor associated Disabled Node/pool Ping the Node ip & telnet to respective port I,e :- 80,443 Check monitor status is green Check for association of Pool members to Virtual server Associate right monitor for eg: SQL/icmp/https etc Enable node/pool as required
  • 5.
    F5 LTM TROUBLESHOOTING NODE(Member) Common issues:- Node is down Node is up but not responding ie Ping/trace Node is up & responding to ping & trace/telnet Node is marked down Node is not functional /server not built Blocking of IP may be due to firewall/dmz & no associated monitor Service disabled or need as restart on server side eg:-web server F5 admin has marked down due to decommissioned or faulty server
  • 6.
  • 7.
    F5 LTM TROUBLESHOOTING Monitor Common issues:- Virtual server/Pool/node is down No monitor associated Improper monitor associated(tcp/udp/icmp etc) Disabled monitor Associate a monitor Web server,sql server,etc Enable monitor on Node/Pool level as per requirement
  • 8.
    F5 LTM TROUBLESHOOTING Systemevents System event messages are based on Linux events, and are not specific to the BIG-IP system. Packet filter events Packet filter messages are those that result from the implementation of packet filters and packet-filter rules. Local traffic events Local-traffic event messages pertain specifically to the local traffic management system. Audit events Audit event messages are those that the BIG-IP system logs as a result of changes to the BIG-IP system configuration. Logging audit events is optional.
  • 9.
    F5 LTM TROUBLESHOOTING Someof the specific types of events that the BIG-IP system displays on the Local Traffic logging screen are: • Address Resolution Protocol (ARP) packet and ARP cache events • bigdb database events (such as populating and persisting bigdb variables) • HTTP protocol events • HTTP compression events • IP packet discard events due to exceptional circumstances or invalid parameters (such as a bad checksum) • Layer 4 events (events related to TCP, UDP, and Fast L4 processing) • MCP/TMM configuration • Monitor configuration events • Network events (Layers 1 and 2) • Packet Velocity® ASIC (PVA) configuration events • iRule events related to run-time iRule processing • SSL traffic processing events • General TMM events such as TMM startup and shutdown
  • 10.
  • 11.
  • 12.
    F5 LTM TROUBLESHOOTING writing tcpdump-w <filename> For example: tcpdump -w dump1.bin reading tcpdump -r <filename> For example: tcpdump -r dump1.bin tcpdump host 10.90.100.1 and port 80 tcpdump src host 172.16.101.20 and dst port 80 tcpdump src host 172.16.101.20 and dst host 10.90.100.1
  • 13.
    F5 LTM TROUBLESHOOTING show/sys cpu ------------------------------------------------------------------------- Sys::Host CPUs ------------------------------------------------------------------------- Host: 1 CPU 0 (clock ticks) Last 5 sec Last 1 min Last 5 min Total - (avg/sec) (avg/sec) (avg/sec) - User 2 2 2 1.7M Niced 0 0 0 0 System 2 2 2 1.2M Idle 91 91 91 67.6M Irq 0 0 0 4 Softirq 0 0 0 458.4K Iowait 0 0 0 116.4K Stolen 1 1 1 724.4K Utilization % (last 10 sec) - - - 4 CPU 1 (clock ticks) Last 5 sec Last 1 min Last 5 min Total - (avg/sec) (avg/sec) (avg/sec) - User 13 13 13 9.7M Niced 0 0 0 195.6K System 4 5 5 3.4M Idle 80 80 80 59.3M Irq 0 0 0 882 Softirq 0 0 0 150.3K Iowait 0 0 0 166.2K Stolen 2 2 2 1.6M Utilization % (last 10 sec) - - - 17
  • 14.
  • 15.
    F5 LTM TROUBLESHOOTING Qkview& ihealth qkview or “tech.out” file The qkview utility is a BIG-IP program that an administrator can use to automatically collect configuration and diagnostic information from BIG-IP and Enterprise Manager systems. Impact of procedure: The qkview utility runs a large number of commands when collecting information. This behavior may cause an additional performance burden on systems that are already under heavy load. Log in to the Configuration utility. Go to System > Support. Select New Support Snapshot. For Health Utility, select Generate QKView. Select Start. To download the output file, select Download.
  • 16.
  • 17.