Download as ODP, PPTX


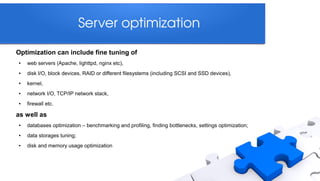


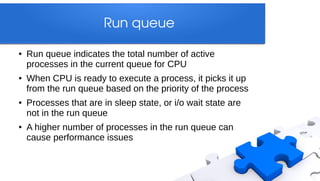


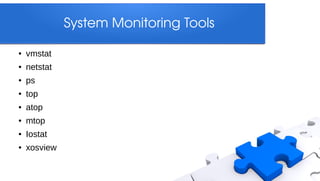


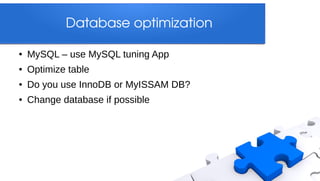
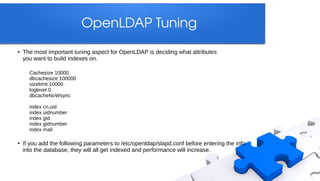

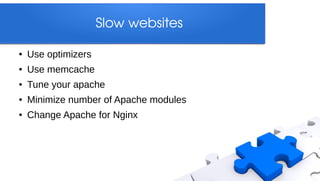

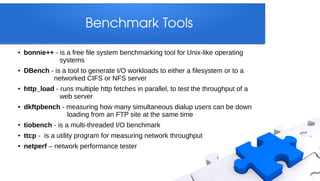
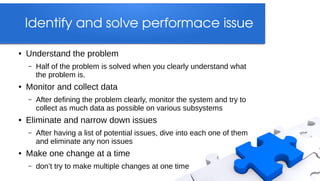


This document discusses optimizing Linux servers. It covers monitoring server performance using tools like top, vmstat and iostat to identify bottlenecks. It also discusses optimizing hardware, software, databases, disk I/O, memory, and network performance. The document provides tips for tuning Linux kernels, Apache, MySQL, OpenLDAP and other software. It emphasizes starting with monitoring to identify issues, making one change at a time, and using benchmark tools to test performance.