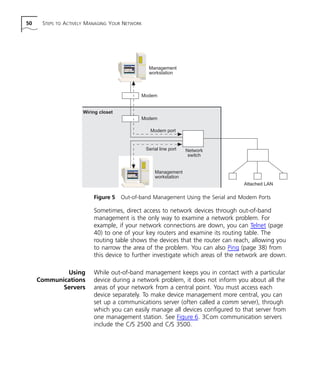
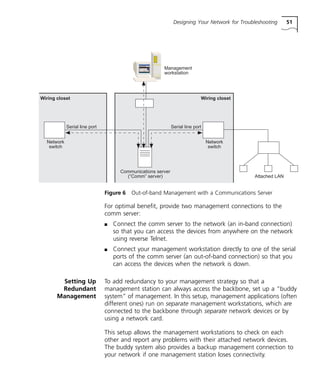
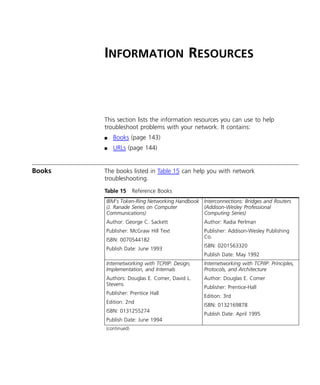
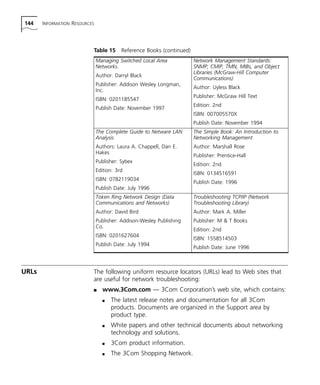
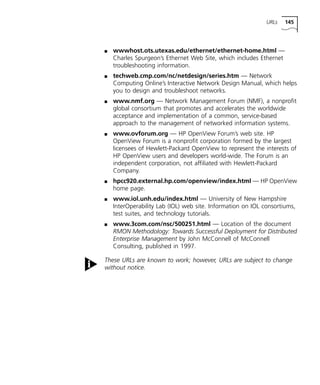
This document provides a network troubleshooting guide for Transcend Management Software version '97 for Windows NT. It begins with an introduction and overview of network troubleshooting. It then describes the various Transcend applications and tools that can be used for troubleshooting, such as Transcend Central, LANsentry Manager, Traffix Manager, and Device View. The guide also discusses other commonly used troubleshooting tools like Ping, Telnet, FTP, analyzers, and probes. It provides steps for actively managing networks, such as designing for troubleshooting, monitoring devices, knowing your network, and preparing devices for management. The main body of the guide discusses specific connectivity and performance problems and solutions. It concludes with a reference section


![14 ABOUT THIS GUIDE
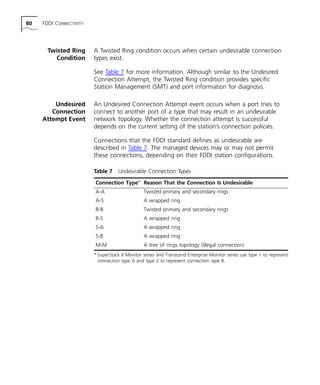
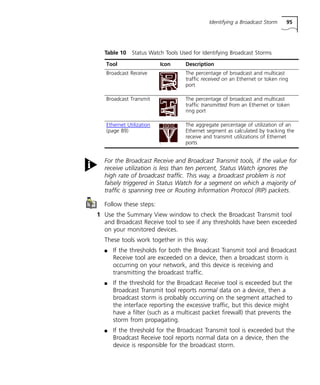
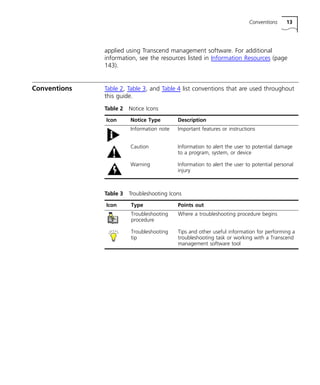
Table 4 Text Conventions
Convention Description
Syntax The word “syntax” means you must evaluate the syntax
provided and supply the appropriate values. Placeholders
for values you must supply appear in angle brackets.
Example:
Enable RIPIP by using the following syntax:
SETDefault !<port> -RIPIP CONTrol = Listen
In this example, you must supply a port number for
<port>.
Commands The word “command” means you must enter the
command exactly as shown in text and press the Return or
Enter key. Example:
To remove the IP address, enter the following
command:
SETDefault !0 -IP NETaddr = 0.0.0.0
Screen displays This typeface represents information as it appears on the
screen.
The words “enter”
and “type”
When you see the word “enter” in this guide, you must
type something, and then press the Return or Enter key.
Do not press the Return or Enter key when an instruction
simply says “type.”
[Key] names Key names appear in text in one of two ways:
n Referred to by their labels, such as “the Return key” or
“the Escape key”
n Written with brackets, such as [Return] or [Esc].
If you must press two or more keys simultaneously, the key
names are linked with a plus sign (+). Example:
Press [Ctrl]+[Alt]+[Del].
Menu commands
and buttons
Menu commands or button names appear in italics.
Example:
From the Help menu, select Contents.
Words in italicized
type
Italics emphasize a point or denote new terms at the place
where they are defined in the text.
Words in boldface
type
Bold text denotes key features.](https://image.slidesharecdn.com/network-troubleshooting-guide1889-140829061043-phpapp01/85/Network-troubleshooting-guide1889-15-320.jpg)