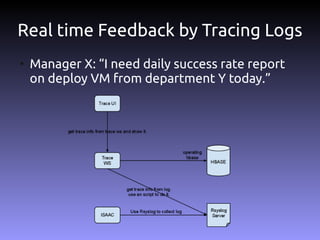
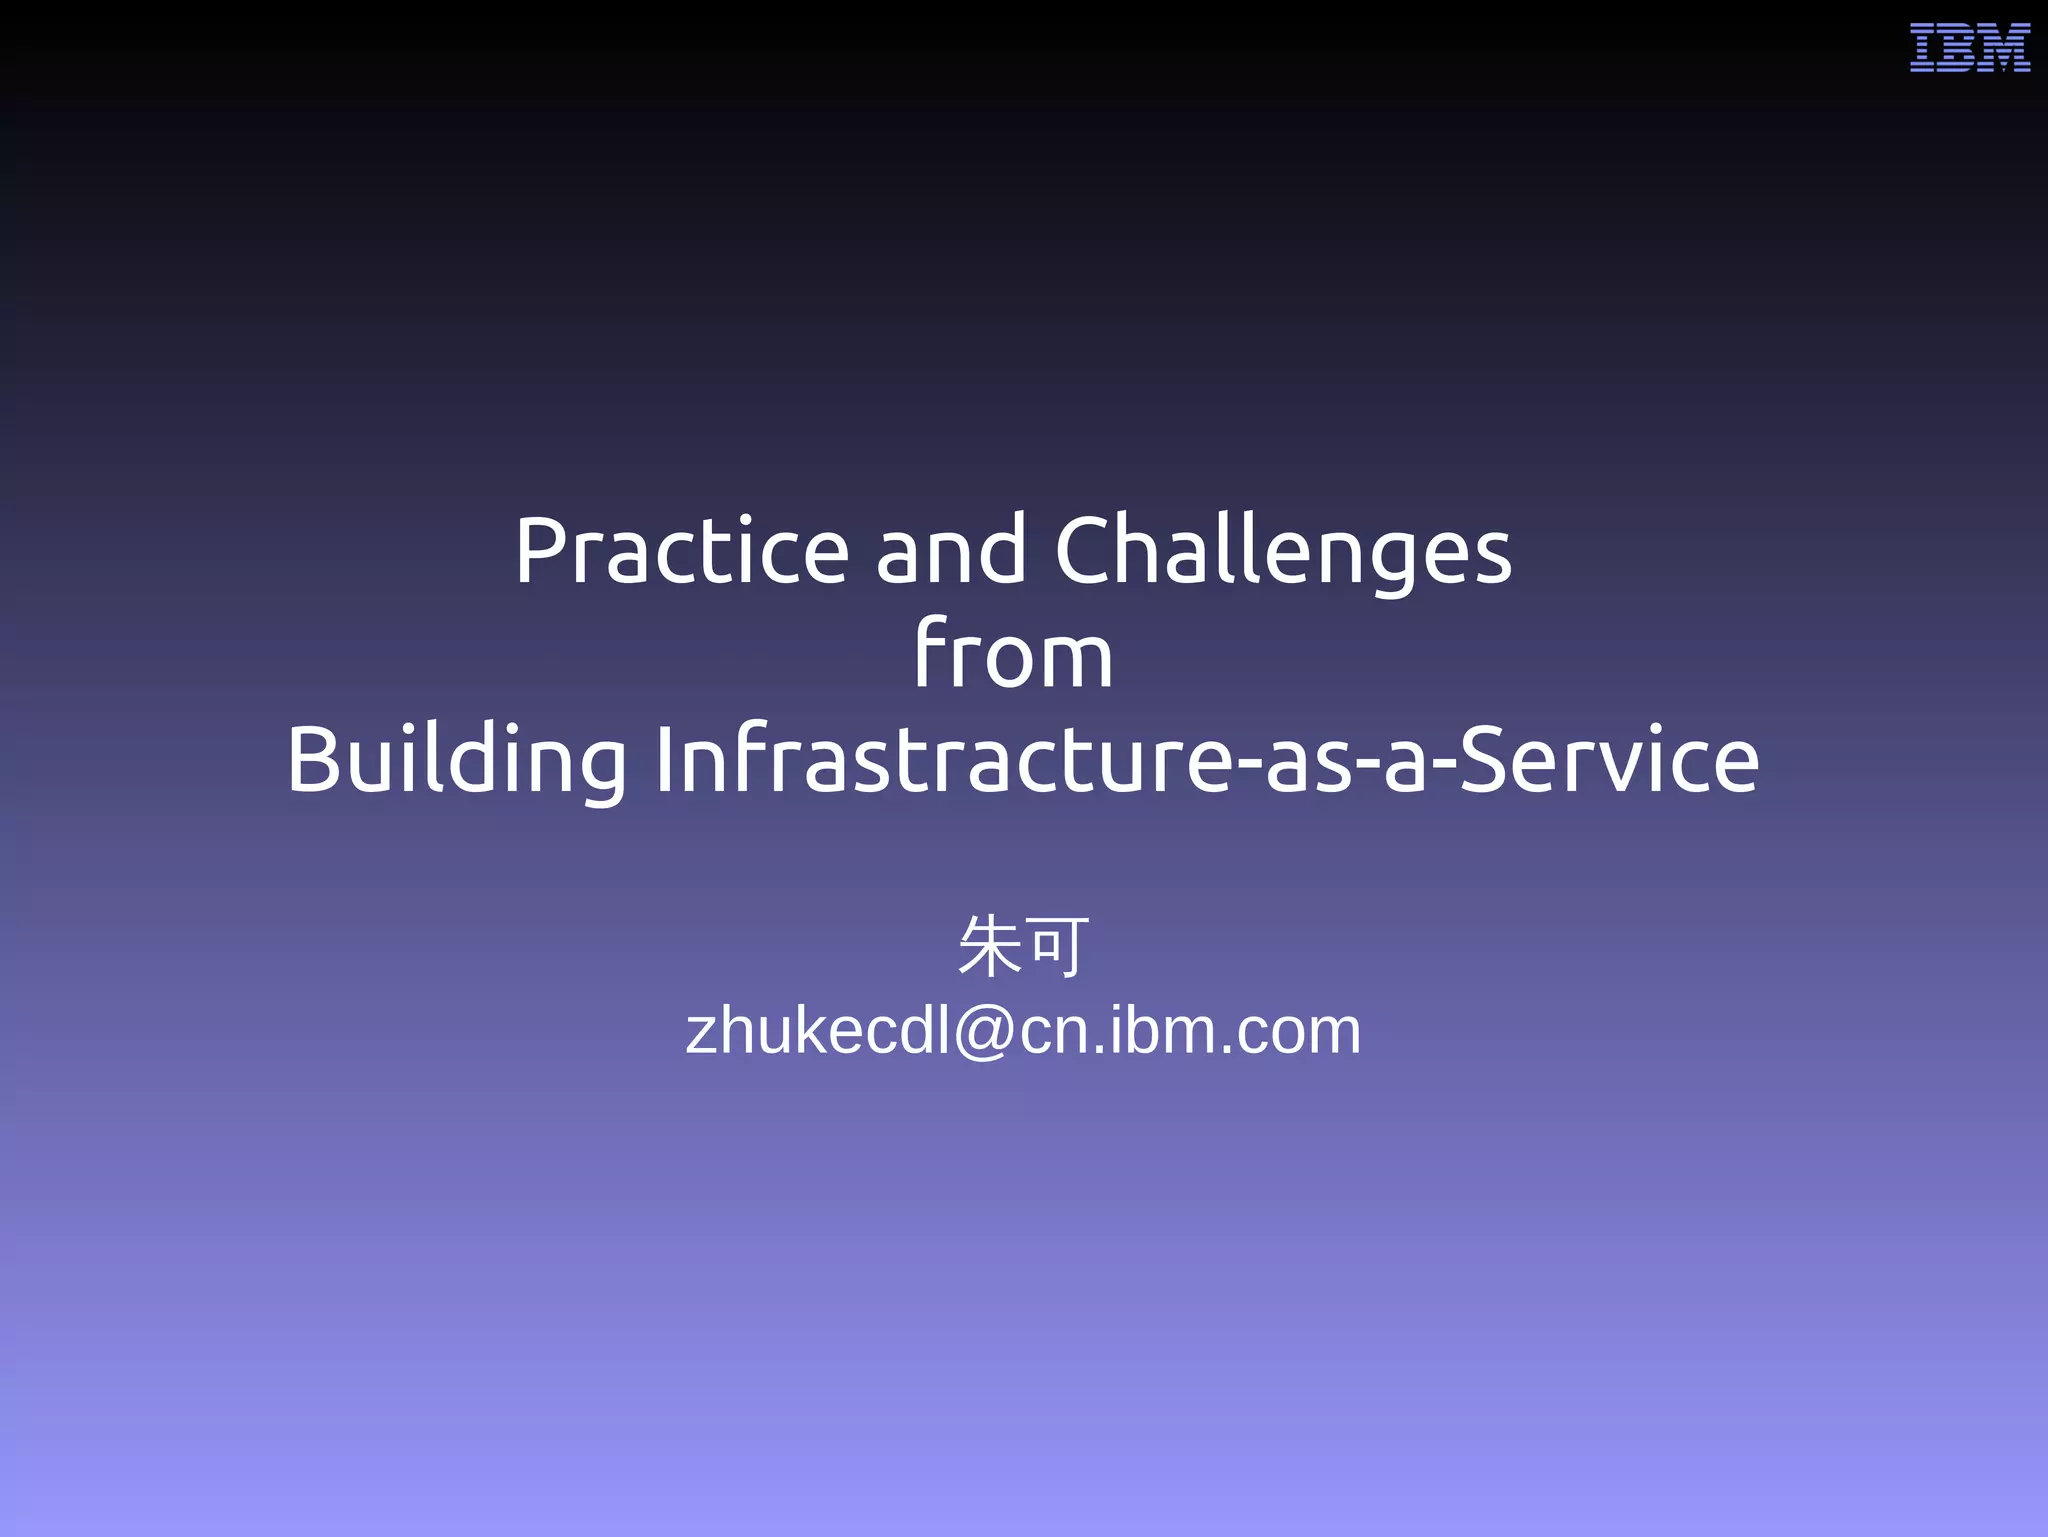
The document discusses the challenges and practices in building Infrastructure-as-a-Service (IaaS) systems, detailing the need for simplicity and robustness amidst hardware failures and network issues. It emphasizes the importance of metrics collection for performance management and encourages automated operations for efficiency. Additionally, it highlights strategies for managing virtual machines and recycling underutilized resources to optimize infrastructure use.
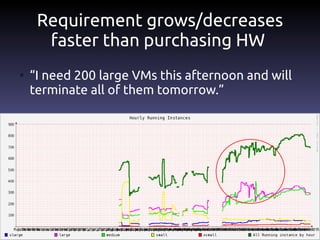
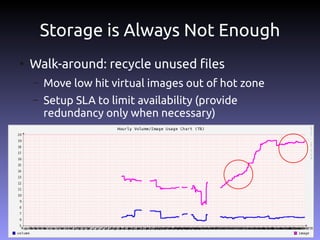
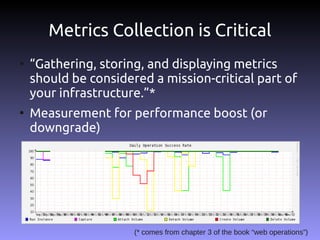
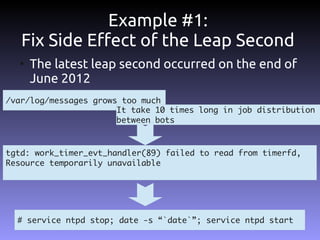
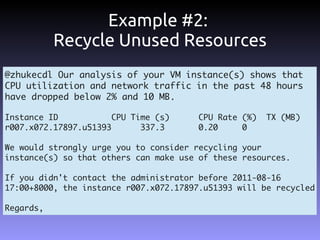
![[root@r007x072 ~]# cat /proc/net/bonding/bond1
Ethernet Channel Bonding Driver: v3.6.0 (September 26, 2009)
Bonding Mode: adaptive load balancing
Primary Slave: None
Currently Active Slave: eth2
MII Status: up
MII Polling Interval (ms): 100
Up Delay (ms): 0
Down Delay (ms): 0
Slave Interface: eth2
MII Status: up
Link Failure Count: 0
Permanent HW addr: 00:1b:21:98:2a:4c
Slave queue ID: 0
Slave Interface: eth3
MII Status: up
Link Failure Count: 1627
Permanent HW addr: 00:1b:21:98:2a:4d
Slave queue ID: 0](https://image.slidesharecdn.com/practicechallengesbuildingiaas-121015203441-phpapp01/85/Practice-and-challenges-from-building-IaaS-9-320.jpg)
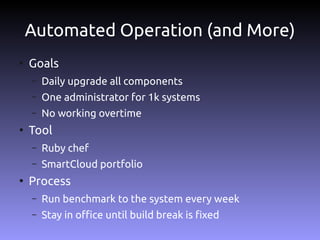
![Example: Stateless OS
●
Mount root partition in RAM
– Think about how you install Ubuntu or Fedora
●
Fix problem by reboot only
[root@r009x090 ~]# df -h
Filesystem Size Used Avail Use% Mounted on
/dev/mapper/live-rw 7,9G 1,5G 6,4G 19% /
tmpfs 71G 4,0K 71G 1% /dev/shm
/dev/sda2 7,9G 1,4G 6,2G 18% /var/log
/dev/sda4 1,6T 183G 1,4T 12% /iaas/local-storage](https://image.slidesharecdn.com/practicechallengesbuildingiaas-121015203441-phpapp01/85/Practice-and-challenges-from-building-IaaS-11-320.jpg)
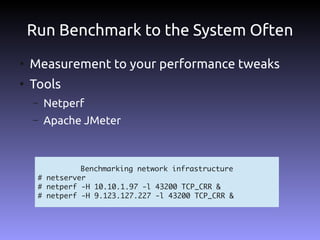
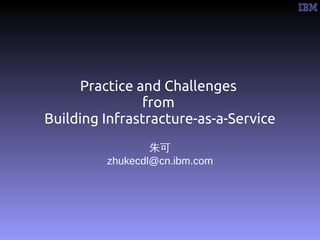
![Infrastructure as Code
●
Building network accessible services
●
Integration these services
[root@beijing-mn03 ~]# virsh list
Id Name State
----------------------------------
1 hbm1 running
2 bj-jenkins running
3 hjt running
4 webservice-1 running
5 hnn2 running
6 bugzilla running
8 hslave07 running
9 hslave08 running
10 hslave09 running
11 hslave10 running
12 hslave11 running
13 ScannerSlackware running](https://image.slidesharecdn.com/practicechallengesbuildingiaas-121015203441-phpapp01/85/Practice-and-challenges-from-building-IaaS-23-320.jpg)