Exploring plant indicators for soil quality assessment in Laos: improving the roles of communities in land management

According to the World Bank, in 2009 about 40% of the population in Laos were living below the poverty line, and as forests are cleared for agriculture, land use planning is now a national policy to reduce shifting cultivation and fight poverty. Using communities in the Viengkham District of Laos as a case study, the work presented here explores whether locally recognised plant indicators of soil productivity could improve land use planning by involving local communities in land management. CIFOR researcher Imam Basuki gave this presentation at the 18th International Symposium on Society & Resource Management (ISSRM) held on 17–21 June 2012 at the University of Alberta, Canada. The main theme of the conference was ‘Linking North and South: Responding to Environmental Change’, and 350 participants from 50 countries came together to discuss the intersection of social issues and natural resource management.

Recommended
Recommended
More Related Content
What's hot
What's hot (20)
Viewers also liked
Viewers also liked (20)
Similar to Exploring plant indicators for soil quality assessment in Laos: improving the roles of communities in land management
Similar to Exploring plant indicators for soil quality assessment in Laos: improving the roles of communities in land management (20)
More from CIFOR-ICRAF
More from CIFOR-ICRAF (20)
Recently uploaded
Recently uploaded (20)
Exploring plant indicators for soil quality assessment in Laos: improving the roles of communities in land management
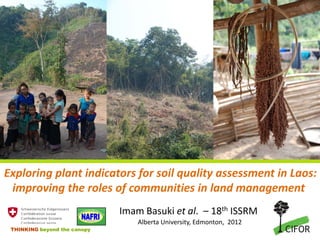
- 1. Exploring plant indicators for soil quality assessment in Laos: improving the roles of communities in land management Imam Basuki et al. – 18th ISSRM Alberta University, Edmonton, 2012 THINKING beyond the canopy
- 2. Context Laos • Laos covers 236,800 km2 –68% (1986) forest reduced to 47% (2010) –43% (2010) agricultural lands • Of 5.23 M people in Laos 39% are poor (WB 2009)
- 4. Context • Land use planning as a national policy to reduce shifting cultivation and poverty in Laos: lack of capacity and information (Saito et al. 2006) • Would land use planning be more effective with participatory and multidisciplinary approaches?
- 5. Objectives • To examine and demonstrate the need for local land assessment for effective land use planning in Laos, and • To clarify whether locally recognised plant indicators of soil productivity can play a useful role.
- 6. Study sites
- 7. Approach • Community meetings – Soil types and plant indicators – Scoring exercise • Participatory mapping and group discussions
- 8. Approach • Field tests for plant indicators (14 sites) • Soil sampling (25 sites)
- 9. Results in two parts 1. Soil 2. Plant indicators • Local soil map • Identification of • Local soil types plant indicators • Soil fertility • Index of soil • Land suitability productivity for rice • Local & scientific approaches
- 10. Result 1/1 – Local soil map The grey and reddish areas are the better soils; Potential for land zoning in land use planning.
- 11. Result 1/2 – Local soil types Productive soils are more extensive than non productive, but… productivity for rice cultivation is decreasing. Table of importance and productivity by soil types, as perceived by communities Mean Mean productivity Trend in Area Soil type Importance (%) (kg/ha) productivity (hectare) Dark soil 32 1785 -7 7716 Sandy soil 20 1245 -2 1293 Reddish soil 16 600 -5 4279 Dark red soil 14 1465 -3 1343 Rocky soil 13 630 -1 1988 Soil with roots 5 665 -1 1984
- 12. Result 1/3 – Land evaluation: soil fertility Evaluation of five chemical indicators of soil fertility; phosphorus, potassium, cation exchange capacity (CEC), base saturation and carbon content Table of fertility status and limiting factors of the soils in villages Village Fertility Status Limiting Factors Boummi Low Phosphorus, CEC, Base sat. Don Keo Low Phosphorus, CEC, Base sat. Houaykhon Low Phosphorus, CEC Muangmuay Low Phosphorus, CEC, Base sat. Paklao Low Phosphorus, CEC Padheng Low Phosphorus, CEC, Base sat. Vangkham Low CEC
- 13. Result 1/4 – Land suitability for rice Table of soil suitability class for rice Suitability class Oryza sativa L. S1 0 S2 3 S3 6 N (Not suitable) 16 Main limiting factors are: – water shortage, erosion and soil fertility.
- 14. Result 1/5 – Local & scientific approaches Local classes of soil productivity are significantly correlated with soil pH and nutrients (p-value < 0.1). 5.0 120 5 Potential potassium (ppm) 4.5 80 pH (KCl) 4.0 40 3.5 3.0 0 N= 7 7 N= 7 7 non-productive productive non-productive productive
- 15. Implications 1 • Current land use zoning has shortened the fallow period and eroded soils decreased productivity + land degradation • Local land assessment can improve current land zoning
- 16. Result 2/1 - Identification of plant indicators •52 plant indicators were identified •29 plants indicate productive soils Table of plant indicators and index-score of productivity by village (example) Example of identified plant indicators Plant scores in villages Local name Scientific name DK MM HK VK VM BM PL yak kee lor Eupatorium odoratum L. 10 10 10 10 10 10 10 thong koop Macaranga denticulata (Blume) Müll. Arg. 5 - - - - 6 - ------- ------- may muem Aporosa villosa (Lindl.) Baillon 6 4 - - - 2 3 may tiou Cratoxylum formosum (Jack) Dyer subsp. 1 1 1 2 2 1 1 ------- -------
- 17. Result 2/2 - Index of soil productivity Local index range: Productive (>5) and Non-productive (<5) Table of Local index of soil productivity (example) MM VK HK VM BM DK PL Indicator plants Eupatorium odoratum L. 1 0 1 0 1 1 1 0 1 1 - - 0 0 Imperata cylindrica (L.) 0 1 1 0 1 0 1 0 0 0 0 0 0 0 Beauvois --- --- Soil Productivity Index 7.0 2.0 6.6 4.6 6.4 4.4 5.3 4.0 7.4 4.1 6.7 4.3 6.6 4.1
- 18. Implications 2 A plant-index is a quick and simple approach: • Complements the current approaches • Appropriate land allocation • Can detect change in soil productivity better land management
- 19. Conclusion • Local land assessment and the local plant-index could inform a better land use planning. • We advocate wider use of the local index with follow up trials in other areas.
- 20. Acknowledgement • SDC • CIFOR/ICRAF • NAFRI/NAFREC • Communities in Viengkham District • 18th ISSRM 2012 Organizers Cifor website: http://www.cifor.org THINKING beyond the canopy