Downloaded 24 times
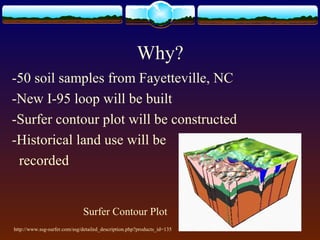
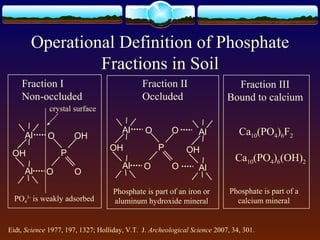
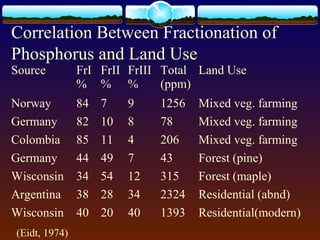
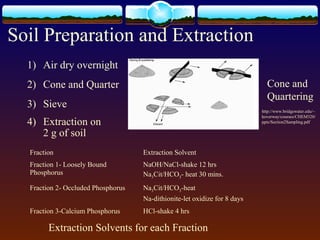
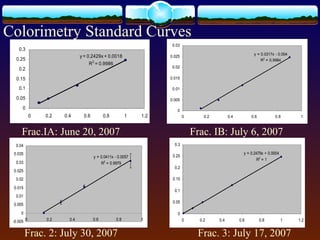
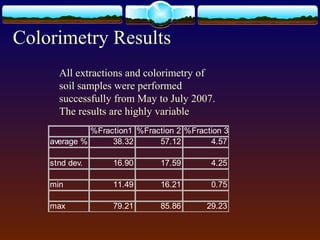

1) Fifty soil samples from Fayetteville, NC were sequentially extracted to quantify phosphorus fractions that can reveal historical land use. 2) Phosphorus was extracted into three fractions and analyzed using both Murphy-Riley colorimetry and ICP-OES. 3) Quality control measures showed inconsistencies between duplicate extractions for colorimetry and differences from standard reference values, indicating issues with the extraction or analysis methods. Further work is needed to determine the best method for analyzing phosphorus fractions in soil.


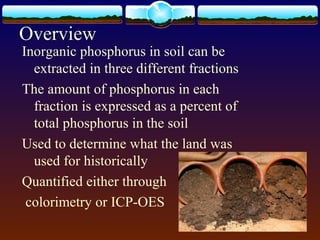
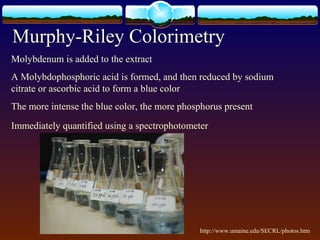
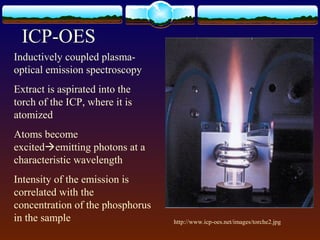
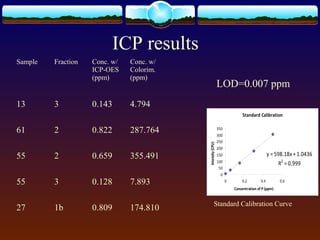
![谷歌留痕技术 [ 𝙩𝙤𝙥 𝟮𝟯𝟯. 𝙘 𝙤𝙢 ]](https://cdn.slidesharecdn.com/ss_thumbnails/top233-260130174328-3833018c-thumbnail.jpg?width=640&height=640&fit=bounds)


