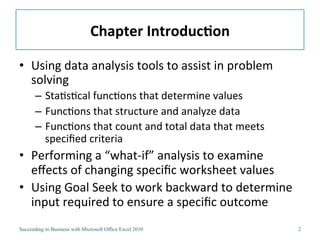
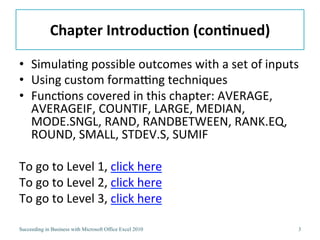
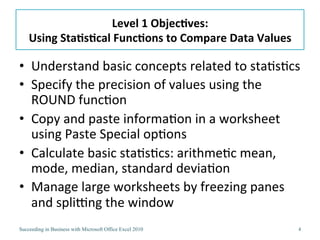
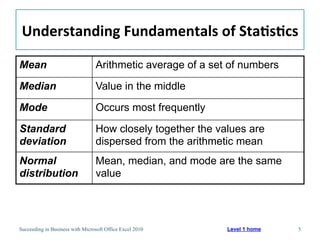
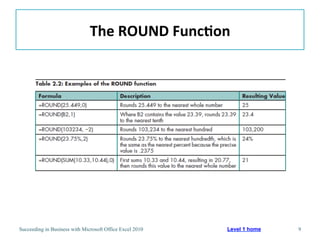
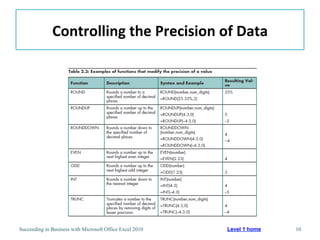
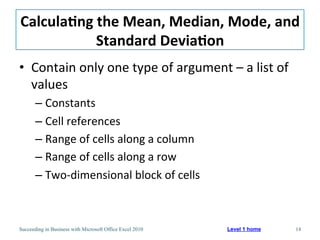
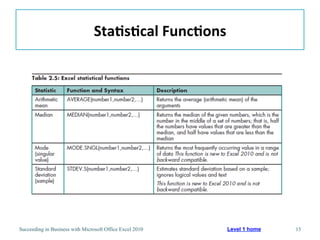
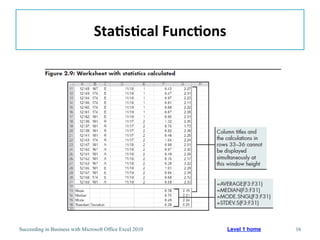
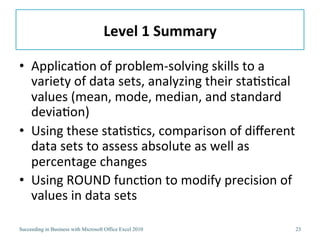
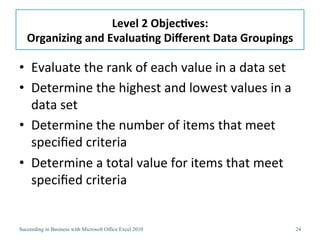
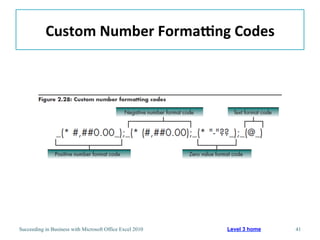
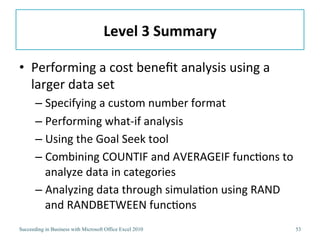
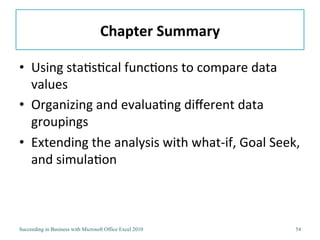
2. Chapter
Introduc/on
• Using
data
analysis
tools
to
assist
in
problem
solving
– Sta3s3cal
func3ons
that
determine
values
– Func3ons
that
structure
and
analyze
data
– Func3ons
that
count
and
total
data
that
meets
specified
criteria
• Performing
a
“what-‐if”
analysis
to
examine
effects
of
changing
specific
worksheet
values
• Using
Goal
Seek
to
work
backward
to
determine
input
required
to
ensure
a
specific
outcome
Succeeding in Business with Microsoft Office Excel 2010 2
3. Chapter
Introduc/on
(con/nued)
• Simula3ng
possible
outcomes
with
a
set
of
inputs
• Using
custom
formaJng
techniques
• Func3ons
covered
in
this
chapter:
AVERAGE,
AVERAGEIF,
COUNTIF,
LARGE,
MEDIAN,
MODE.SNGL,
RAND,
RANDBETWEEN,
RANK.EQ,
ROUND,
SMALL,
STDEV.S,
SUMIF
To
go
to
Level
1,
click
here
To
go
to
Level
2,
click
here
To
go
to
Level
3,
click
here
Succeeding in Business with Microsoft Office Excel 2010 3
4. Level
1
Objec/ves:
Using
Sta/s/cal
Func/ons
to
Compare
Data
Values
• Understand
basic
concepts
related
to
sta3s3cs
• Specify
the
precision
of
values
using
the
ROUND
func3on
• Copy
and
paste
informa3on
in
a
worksheet
using
Paste
Special
op3ons
• Calculate
basic
sta3s3cs:
arithme3c
mean,
mode,
median,
standard
devia3on
• Manage
large
worksheets
by
freezing
panes
and
spliJng
the
window
Succeeding in Business with Microsoft Office Excel 2010 4
5. Understanding
Fundamentals
of
Sta/s/cs
Mean Arithmetic average of a set of numbers
Median Value in the middle
Mode Occurs most frequently
Standard How closely together the values are
deviation dispersed from the arithmetic mean
Normal Mean, median, and mode are the same
distribution value
Succeeding in Business with Microsoft Office Excel 2010 Level 1 home 5
8. Controlling
the
Precision
of
Data
Using
the
ROUND
Func/on
• Changes
precision
of
data
values
stored
• =ROUND
(number,num_digits)
• Two
different
types
of
arguments
• Importance
of
adhering
to
func3on
syntax
when
working
with
mul3ple
arguments
• “Set
precision
as
displayed”
op3on
Succeeding in Business with Microsoft Office Excel 2010 Level 1 home 8
9. The
ROUND
Func/on
Succeeding in Business with Microsoft Office Excel 2010 Level 1 home 9
10. Controlling
the
Precision
of
Data
Succeeding in Business with Microsoft Office Excel 2010 Level 1 home 10
11. Using
Paste
Special
to
Copy
and
Paste
Data
• Simplest
method:
Copy
buaon
and
Paste
buaon
in
the
Clipboard
group
on
the
Home
tab
Succeeding in Business with Microsoft Office Excel 2010 Level 1 home 11
12. Using
Paste
Special
Succeeding in Business with Microsoft Office Excel 2010 Level 1 home 12
13. Using
Paste
Special
Succeeding in Business with Microsoft Office Excel 2010 13
14. Calcula/ng
the
Mean,
Median,
Mode,
and
Standard
Devia/on
• Contain
only
one
type
of
argument
–
a
list
of
values
– Constants
– Cell
references
– Range
of
cells
along
a
column
– Range
of
cells
along
a
row
– Two-‐dimensional
block
of
cells
Succeeding in Business with Microsoft Office Excel 2010 Level 1 home 14
17. Managing
Large
Worksheets
by
Freezing
Panes
and
SpliNng
the
Window
• Freezing
panes
– Keeps
3tles
displayed
in
top
pane;
allows
boaom
pane
to
be
scrolled
– Both
3tles
and
values
further
down
are
displayed
simultaneously
• SpliJng
the
window
– Allows
you
to
scroll
each
por3on
individually,
top/
boaom
and
lef/right,
with
separate
scroll
bars
Succeeding in Business with Microsoft Office Excel 2010 Level 1 home 17
19. Comparing
Current
Values
with
Historical
Values
• Use
a
Comparison
worksheet
– Places
current
values
and
historical
values
on
a
separate
worksheet
in
the
workbook,
side
by
side
Succeeding in Business with Microsoft Office Excel 2010 Level 1 home 19
21. Calcula/ng
the
Difference
Between
Two
Sets
of
Data
Succeeding in Business with Microsoft Office Excel 2010 Level 1 home 21
22. Calcula/ng
the
Percent
Difference
Between
Two
Sets
of
Data
Succeeding in Business with Microsoft Office Excel 2010 Level 1 home 22
23. Level
1
Summary
• Applica3on
of
problem-‐solving
skills
to
a
variety
of
data
sets,
analyzing
their
sta3s3cal
values
(mean,
mode,
median,
and
standard
devia3on)
• Using
these
sta3s3cs,
comparison
of
different
data
sets
to
assess
absolute
as
well
as
percentage
changes
• Using
ROUND
func3on
to
modify
precision
of
values
in
data
sets
Succeeding in Business with Microsoft Office Excel 2010 23
24. Level
2
Objec/ves:
Organizing
and
Evalua/ng
Different
Data
Groupings
• Evaluate
the
rank
of
each
value
in
a
data
set
• Determine
the
highest
and
lowest
values
in
a
data
set
• Determine
the
number
of
items
that
meet
specified
criteria
• Determine
a
total
value
for
items
that
meet
specified
criteria
Succeeding in Business with Microsoft Office Excel 2010 24
25. Determining
a
Rank
for
Each
Value
in
a
Data
Set
• RANK.EQ
func3on
– Allows
a
list
to
be
sorted,
then
counts
number
of
entries
either
above
or
below
the
value
in
ques3on
• RANK.EQ
(number,ref,order)
– If
“order”
argument
is
0
or
lef
blank,
values
are
ranked
in
descending
order
– If
“order”
argument
is
a
posi3ve
number,
values
are
ranked
in
ascending
order
Succeeding in Business with Microsoft Office Excel 2010 Level 2 home 25
27. Determining
the
Highest
and
Lowest
Values
in
a
Data
Set
• LARGE
func3on
– Determines
the
nth
largest
value
in
a
range
– LARGE
(array,k)
• SMALL
func3on
– Determines
the
nth
smallest
value
in
a
range
– SMALL
(array,k)
Succeeding in Business with Microsoft Office Excel 2010 Level 2 home 27
29. Determining
the
Number
of
Items
that
Meet
Specified
Criteria
• COUNTIF
func3on
– Counts
the
number
of
items
in
a
range
that
meet
specified
criteria
– =COUNTIF
(range,criteria)
– Range
argument
must
be
a
con3guous
set
of
cells
– Criteria
argument
is
a
“test”
that
data
must
meet
in
order
to
be
counted
in
the
grouping
Succeeding in Business with Microsoft Office Excel 2010 Level 2 home 29
30. Types
of
Criteria
Specified
for
the
COUNTIF
Func/on
Succeeding in Business with Microsoft Office Excel 2010 Level 2 home 30
33. Sample
Result
of
COUNTIF
Func/on
Succeeding in Business with Microsoft Office Excel 2010 Level 2 home 33
34. Determining
a
Total
Value
for
Items
that
Meet
Specified
Criteria
• Use
SUMIF
func3on
to
add
all
values
in
a
range
that
meet
specified
criteria
– =SUMIF
(range,criteria,sum_range)
– Sum_range
argument
iden3fies
corresponding
cell
range
to
sum
if
specified
criteria
have
been
met
in
the
range
established
by
the
“range”
argument
Succeeding in Business with Microsoft Office Excel 2010 Level 2 home 34
35. Examples
of
SUMIF
Func/on
Succeeding in Business with Microsoft Office Excel 2010 Level 2 home 35
36. Level
2
Summary
• Tail
values
–
highest
and
lowest
five
elements
of
each
data
set
–
and
their
rela3ve
rankings
• Summarizing
analyses
by
coun3ng
the
number
of
items
that
meet
specific
criteria
and
summing
items
that
meet
specific
criteria
• Including
rela3onal
operators
and
wildcards
in
func3ons
and
formulas
Succeeding in Business with Microsoft Office Excel 2010 36
37. Level
3
Objec/ves:
Extending
the
Analysis
with
What-‐If,
Goal
Seek,
and
Simula/on
• Evaluate
a
large
data
set
• Apply
custom
number
formats
to
data
• Perform
what-‐if
analyses
• Perform
reverse
what-‐if
analyses
using
Goal
Seek
• Analyze
data
by
category
by
combining
func3ons
• Simulate
data
to
evaluate
different
outcomes
Succeeding in Business with Microsoft Office Excel 2010 37
38. Evalua/ng
a
Larger
Data
Set
• Separately
list
inputs,
especially
those
likely
to
change
or
that
you
might
want
to
explore
with
“what-‐if”
scenarios
• If
a
large
number
of
data
inputs,
place
them
on
a
separate
worksheet
or
in
a
separate
area
on
the
same
worksheet
Succeeding in Business with Microsoft Office Excel 2010 Level 3 home 38
39. Specifying
a
Custom
Number
Format
• Use
to
alter
format
of
a
cell
without
altering
the
value
• Format
codes
– Can
include
up
to
four
parts,
each
separated
by
a
semicolon:
one
for
posi3ve
numbers,
one
for
nega3ve
numbers,
one
for
zero
values,
one
for
text
– Consist
of
combina3ons
of
symbols,
each
with
a
separate
meaning
Succeeding in Business with Microsoft Office Excel 2010 Level 3 home 39
40. Custom
Number
FormaNng
Code
Succeeding in Business with Microsoft Office Excel 2010 Level 3 home 40
41. Custom
Number
FormaNng
Codes
Succeeding in Business with Microsoft Office Excel 2010 Level 3 home 41
42. Considering
Alterna/ves:
What-‐if
Analysis
and
Goal
Seek
• What-‐if
analysis
– Determines
the
outcome
of
changing
one
or
more
input
values
and
evaluates
the
recalculated
results
• Goal
Seek
tool
– Specifies
the
outcome
you
want
and
which
input
value
you
want
to
vary
– Excel
automa3cally
calculates
the
solu3on
Succeeding in Business with Microsoft Office Excel 2010 Level 3 home 42
43. Using
Goal
Seek
Succeeding in Business with Microsoft Office Excel 2010 Level 3 home 43
44. Using
Goal
Seek
Succeeding in Business with Microsoft Office Excel 2010 Level 3 home 44
45. Using
Goal
Seek
Succeeding in Business with Microsoft Office Excel 2010 Level 3 home 45
46. Using
Goal
Seek
Succeeding in Business with Microsoft Office Excel 2010 Level 3 home 46
47. Limita/ons
of
Goal
Seek
• Allows
you
to
vary
only
a
single
output
• Input
must
be
a
constant
value,
not
a
value
derived
from
a
formula
Succeeding in Business with Microsoft Office Excel 2010 Level 3 home 47
48. Combining
COUNTIF
and
AVERAGEIF
to
Analyze
Data
in
Specific
Categories
Succeeding in Business with Microsoft Office Excel 2010 Level 3 home 48
49. Analyzing
Data
Through
Simula/on
• Analy3cal
method
that
creates
ar3ficially
generated
data
to
imitate
real
data
• Easily
calculated
and
recalculated
to
show
different
possible
outcomes
(as
opposed
to
most
probable
outcome
or
even
extreme
limits)
Succeeding in Business with Microsoft Office Excel 2010 Level 3 home 49
51. Func/ons
Used
in
Simula/on
• Use
RANDBETWEEN
func3on
to
randomly
assign
a
number
between
two
values
– RANDBETWEEN
(boaom,top)
• Use
RAND
func3on
to
assign
a
random
value
– Has
no
arguments,
but
must
include
parentheses
• Use
ROUND
func3on
to
calculate
probable
costs
Succeeding in Business with Microsoft Office Excel 2010 Level 3 home 51
53. Level
3
Summary
• Performing
a
cost
benefit
analysis
using
a
larger
data
set
– Specifying
a
custom
number
format
– Performing
what-‐if
analysis
– Using
the
Goal
Seek
tool
– Combining
COUNTIF
and
AVERAGEIF
func3ons
to
analyze
data
in
categories
– Analyzing
data
through
simula3on
using
RAND
and
RANDBETWEEN
func3ons
Succeeding in Business with Microsoft Office Excel 2010 53
54. Chapter
Summary
• Using
sta3s3cal
func3ons
to
compare
data
values
• Organizing
and
evalua3ng
different
data
groupings
• Extending
the
analysis
with
what-‐if,
Goal
Seek,
and
simula3on
Succeeding in Business with Microsoft Office Excel 2010 54
Editor's Notes
Set up the scenario.
Introduce the terms data sets, mean, median, mode, and standard deviation.
Use Figures 2.1 and 2.2 to illustrate a normal distribution.
Use Figure 2.3 to illustrate a data set that is not normally distributed.Note the same mean, but different standard deviation
Introduce the class to the ROUND function, see Table 2.2.
Introduce the functions ROUNDUP and ROUNDDOWN.See Table 2.3 for a summary of some of the functions that can be used to change the precision value.
Use Table 2.4 to discuss the technique used by Excel to paste copied data.
Use Table 2.5 to illustrate the Paste Options button.
Use Table 2.6 to discuss the use of the AVERAGE, MEDIAN, MODE, AND STDEV functions.
Figure 2.9 shows the worksheet with the statistics calculated.
Introduce the class to the concept of freezing panes, see Figure 2.10.
Discuss the technique of splitting the window, see Figure 2.11.
Note that Figure 2.12 shows the values in this new Comparison worksheet at the top and the corresponding formulas at the bottom.
Students should understand how to calculate the difference between two sets of data, see Figures 2.13 and 2.14.
Introduce the RANK function.
Use Figure 2.16 to illustrate the rankings for Friction Coefficient and Torsion Strength.
Use Figure 2.17 to illustrate the new HighLow worksheet.
Introduce the LARGE function.Use Figure 2.18 to illustrate the calculation of the five highest values for Friction Coefficient and Torsion Strength.Introduce the SMALL function. Use Figure 2.19 to illustrate the calculation of the five lowest values for both Friction Coefficient and Torsion Strength.