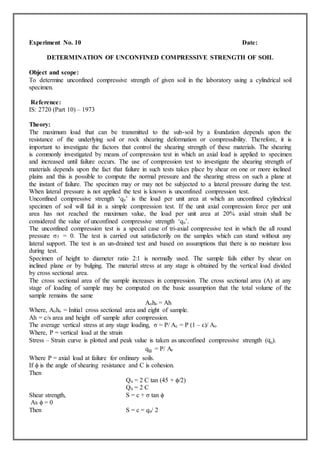
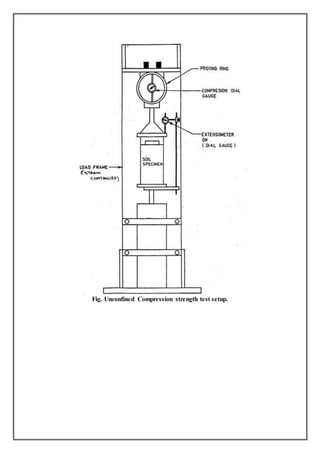
1) The experiment determines the unconfined compressive strength (qu) of soil, which is the maximum load per unit area at which an unconfined cylindrical soil specimen fails during compression testing.
2) A cylindrical soil specimen is prepared at optimum moisture content and maximum dry density, and compressed axially between loading plates at a controlled strain rate while measuring load and deformation.
3) The stress-strain curve is plotted, and qu is taken as either the peak stress or stress at 20% axial strain. Shear strength S of the soil is then calculated as qu/2, assuming the soil's angle of shearing resistance φ is 0.
DETERMINATION OF UNCONFINED COMPRESSIVE STRENGTH OF SOILJaptyesh Singh
DETERMINATION OF UNCONFINED COMPRESSIVE STRENGTH OF SOIL in Foundation Engineering
INTRODUCTION
TERMINOLOGY
APPARATUS
SOIL SPECIMEN & ITS TYPES
THEORY
RELEVANCE OF THE EXPERIMENT
PROCEDURE
VIDEO
OBSERVATION
DISCUSSION
REMARKS
Geotechnical Engineering-II [Lec #3: Direct Shear Test)Muhammad Irfan
Class notes of Geotechnical Engineering course I used to teach at UET Lahore. Feel free to download the slide show.
Anyone looking to modify these files and use them for their own teaching purposes can contact me directly to get hold of editable version.
Class notes of Geotechnical Engineering course I used to teach at UET Lahore. Feel free to download the slide show.
Anyone looking to modify these files and use them for their own teaching purposes can contact me directly to get hold of editable version.
Geotechnical Engineering-I [Lec #14: Lab Compaction of Soil]Muhammad Irfan
Class notes of Geotechnical Engineering course I used to teach at UET Lahore. Feel free to download the slide show.
Anyone looking to modify these files and use them for their own teaching purposes can contact me directly to get hold of editable version.
Class notes of Geotechnical Engineering course I used to teach at UET Lahore. Feel free to download the slide show.
Anyone looking to modify these files and use them for their own teaching purposes can contact me directly to get hold of editable version.
Detailed content on shear strength of soils, principles of effective stresses, tests conducted to determine the shear strength of soils and its applications, dilatancy, thixotropy and sensitivity.
Lecture 11 Shear Strength of Soil CE240Wajahat Ullah
Shear Strength of Soil
Shear strength in soils
Introduction
Definitions
Mohr-Coulomb criterion
Introduction
Lab tests for getting the shear strength
Direct shear test
Introduction
Procedure & calculation
Critical void ratio
Sheet1Moisture content analysis final resultsGroupValue of m3 (g)A.docxbjohn46
Sheet1Moisture content analysis final resultsGroupValue of m3 (g)A21.459B25 kPa34.35950 kPa18.771C19.282D17.816E23.651F26.148GTBCH28.664
LEEDS BECKETT UNIVERSITY
CIVIL ENGINEERING
GEOTECHNICAL ENGINEERING: APPLICATION & THEORY (BEng)
Laboratory Experiment:
Undrained triaxial compression test (without pore water pressure measurement) BS
1377: Part 7: 1990.
Object of Experiment:
To determine the undrained shear strength of a soil using the triaxial compression test.
Theory/Apparatus:
The apparatus consists of a cell, which is filled with water under pressure; the
specimen is loaded vertically, via a proving ring to measure load.
Triaxial Cell
The vertical load on the specimen is increased until failure occurs, the vertical strain
being recorded at the same time using a dial gauge. The test is repeated on different
specimens from the same soil, using different values of cell pressure.
254
Stresses on specimen in Triaxial Cell
Cell Pressure Deviator Stress =P/A 1=3+P/A
1 = major principal stress
3 = minor principal stress
Therefore, P/A = (1-3) =Deviator stress
The deviator stress is the load on the specimen, P, divided by the cross sectional area
of the specimen. However, as the sample is compressed during the test, the cross
sectional area will increase. Therefore, in calculating the deviator stress an allowance
for the change in area must be considered.
For the calculation of deviator stress, it is assumed that the volume of the specimen
remains constant and that the sample will deform as a cylinder, e.g.
100%
o
X
Strain
L
1 3
P
Deviator stress
A
where P = vertical load, which is measured by a proving ring (kN)
A = Area calculated using the following method;
( ) )o o o oVolume V A L AL A L X
255
1
o o
o
V A
or A or A
L X
Method:
1. Extrude the sample from the tube and trim to size - soil sample of 38mm
diameter and 76mm long.
2. Sleeve the sample with the rubber membrane.
3. Put the sample on the pedestal at the bottom of the cell and seal with the
rubber ring. Place the loading cap on top of the sample and seal with rubber
ring, before securing top drainage tube.
4. Mount the cell over the sample and fill as per the
Flooding Triaxial Cell checklist.
5. Set-up the test with the Clisp Studio assistant, and complete the
Pressurising Triaxial Cell checklist before running the test stages.
6. When test stages are complete, end the test via Clip Studio and complete the
Draining Triaxial Cell checklist.
Results and Calculations:
• Sketch the failure mode of each sample.
• Calculate the moisture content of the soil as per Appendix A.
• Calculate the results as follows:
(i) For each sample tested:
• Find the failure strain (either the final value or.
Geotechnical Engineering A (BSc)Coursework No 2 - Shear bo.docxhanneloremccaffery
Geotechnical Engineering A (BSc)
Coursework No 2 - Shear box test
Level 5
Group: B
Submitted to: Dr. Martin Pritchard
Submission Deadline: 7th of April 2016
Name: Rui Dorey
Student ID: 77149818
Contents
Abstract 3
Introduction 3
Experimental procedure 4
Calculations and results 4
Discussion 11
Conclusion 11
References 11
Appendix I 11
Appendix II 11
Appendix III 11
Abstract
On the shear box experiment for geotechnical module, the goal was to determine the displacement of sample of sand and also to calculated the angle of shear resistance . According to The direct shear box test BS 1377; Part 7 1990: 4 and 5 the group B has performed the experiment. In addition, the shear box test was performed on typical standard test conditions. However, the hanger on this test has suffered from four different vertical loads which were: 15, 25, 35 and 45 kg of mass. As result, on this experiment the shear stress of the four tests has increased simultaneously as the load of the test has increased, so the higher the load means the higher the shear stress and the effective normal stress. On the other hand by using the best line in order to determine the apparent cohesion on this test it was possible to see that the result of cohesion was 0 and the angle derived was: =48.76.
Introduction
On the direct shear box test BS 1377; Part 7 1990: 4 and 5, the aim is to calculate and determine the volumetric displacement of a sand and the shear resistance angle. Moreover on this experiment , the shear strength of the soil in this case the sand can be defined by being the maximum shear stress that is applied at any direction. However, when the soil tested reaches the point failure means that the soil reached the maximum yield stress. Moreover, the soil shear strength is given by the frictional resistance (F) which is derived from “inter-particle forces, (N)” and in this case the pore water has no shear strength. Besides, the formula that is used to calculated the shear strength in shear box test which involves the total normal stress, apparent cohesion (C) and shear resistance angle(φ) is: tf = σntanφ BS 1377; Part 7 1990: 4 and 5. The sample used in the direct shear box is resulted by shear during the plane and it is divided by upward and downward pieces when it is applied a horizontal load on the upper piece when the downward piece is positioned. The proving ring usually helps to apply the load and consequently the shear created by the sample normally is readable straight away and also the shear stress (t) is a result of a division of a shear by the plan area of the box, BS 1377; Part 7 1990: 4 and 5.
In order to get accurate results, this test has to be repeated many times with different normal loads by using the sample with different specimens. After plotting ...
Soil Mechanics
This is a process to calculate for the cohesion of soil. It is used in designing structures directly contact with the ground specifically the footing and foundations. Geotechnical engineering topics
BIOEN 4250 BIOMECHANICS I Laboratory 4 – Principle Stres.docxtarifarmarie
BIOEN 4250: BIOMECHANICS I
Laboratory 4 – Principle Stress and Strain
November 13– 16, 2018
TAs: Allen Lin ([email protected]), Kelly Smith ([email protected])
Lab Quiz: A 10-point lab quiz, accounting for 10% of the lap report grade, will be given at the beginning of
class. Be familiar with the entire protocol.
Objective: The objective of this experiment is to measure the strains along three different axes surrounding
a point on a cantilever beam, calculate the principal strains and stresses, and compare the result
with the stress calculated from the flexure formula for such a beam.
Background: The ability to measure strain is critical to materials testing as well as many other applications in
engineering. However, strain gages that adhere to a surface can alter the local strain environment
if the material (or tissue) of interest is less stiff than the gage itself. For this reason, contact strain
gages (or strain gages that attach directly to a surface) are not typically used for the testing of soft
tissues such as ligament, arteries, or skin. However, when the material is on the stiffer side, or
when the absolute value of the strain is less important than the detection of the mere presence of
strain itself, contact strain gages are very useful. An example of a stiffer biological material would
be bone. However, due to the porous nature of bone, one needs to be extremely careful that the
strain gage is properly adhered to the material’s surface. Other applications range from real world
stress analysis of a structure (e.g., a wing of an aircraft during flight) to strain gages incorporated
into medical equipment to ensure proper function (e.g., gages wrapped around the tubing in a
hospital infusion pump to detect blockages in the line – since the tube swells more than it should
when the fluid path is occluded).
One common engineering loading case that involves a planar stress field (i.e., the only non-zero
stresses are in the same plane), is that of beam bending. Beam bending will be covered in greater
detail during lecture. However, in order to ensure you know the basics of what is going on in this
lab, we will cover some fundamental topics. The simplest case of beam loading is that of a
cantilever beam that is completely anchored at one end and loaded at a point along its length
(Fig. 1). In Figure 1, 𝑃 is the applied load, ℎ is the thickness of the beam (with 𝑐 as the half-
thickness), 𝑥 is the distance from the fixed wall to the location where we want to measure stress
and strain (point 𝑎), and 𝐿 is the length of the beam. There are a couple key points to know about
this loading scenario:
1. As the beam bends downward, the material above the midline (the dashed line) is in
tension and the material below that line is in compression.
2. At the top and bottom free surfaces, there is only axial stress, and zero shear stress.
3. At the midline (dashed line, also referred to as neutral axis)
Determination of strength and stress-strain relationships of a cylindrical specimen of reconstituted specimen using Consolidated Drained (CD) Triaxial Test.
1. A series of drained triaxial tests under four different initial states were conducted on Yamuna River sand. The results consist of simple stress-strain relation, change in volume behaviour were plotted.
2. Basic stress-strain relation with volume behaviour was presented in plot. The results for densely prepared sand samples show an expected behaviour. There is a significant difference in peak and residual deviatoric stress (q) as can be depicted form the plot.
3. With increase in confining stress, load carrying capacity of specimen increases.
4. Saturation value ‘B’ must be acquired to be more than 0.95 before starting the isotropic consolidation phase in CD test.
5. CD tests are performed at much slower strain rate as compared to CU tests for the same soil. The strain rate for CD test can be chosen approx. 8-10 times lower than the CU test.
6. It is important to have no pore water pressure generation throughout the shearing phase of CD test or in other words strain rate must be so small that pore water pressure must get dissipated quickly when specimen is subjected to compression loading in CD test.
7. In CD test, volumetric strain versus axial strain relationship shows contractive response for NC soils and dilative response for OC soils. (NC = Normally consolidated, OC = Over consolidated)
References:
1. IS: 2720 (Part 11):1993- Determination of the shear strength parameters of a specimen tested in unconsolidated undrained triaxial compression without the measurement of pore water pressure (first revision). Reaffirmed- Dec 2016.
2. IS: 2720 (Part 12):1981- Determination of Shear Strength parameters of Soil from consolidated undrained triaxial compression test with measurement of pore water pressure (first revision). Reaffirmed- Dec 2016.
3. ASTM D7181-11. Method for Consolidated Drained Triaxial Compression Test for Soils; ASTM: West Conshohocken, PA, USA, 2011.
Democratizing Fuzzing at Scale by Abhishek Aryaabh.arya
Presented at NUS: Fuzzing and Software Security Summer School 2024
This keynote talks about the democratization of fuzzing at scale, highlighting the collaboration between open source communities, academia, and industry to advance the field of fuzzing. It delves into the history of fuzzing, the development of scalable fuzzing platforms, and the empowerment of community-driven research. The talk will further discuss recent advancements leveraging AI/ML and offer insights into the future evolution of the fuzzing landscape.
TECHNICAL TRAINING MANUAL GENERAL FAMILIARIZATION COURSEDuvanRamosGarzon1
AIRCRAFT GENERAL
The Single Aisle is the most advanced family aircraft in service today, with fly-by-wire flight controls.
The A318, A319, A320 and A321 are twin-engine subsonic medium range aircraft.
The family offers a choice of engines
Automobile Management System Project Report.pdfKamal Acharya
The proposed project is developed to manage the automobile in the automobile dealer company. The main module in this project is login, automobile management, customer management, sales, complaints and reports. The first module is the login. The automobile showroom owner should login to the project for usage. The username and password are verified and if it is correct, next form opens. If the username and password are not correct, it shows the error message.
When a customer search for a automobile, if the automobile is available, they will be taken to a page that shows the details of the automobile including automobile name, automobile ID, quantity, price etc. “Automobile Management System” is useful for maintaining automobiles, customers effectively and hence helps for establishing good relation between customer and automobile organization. It contains various customized modules for effectively maintaining automobiles and stock information accurately and safely.
When the automobile is sold to the customer, stock will be reduced automatically. When a new purchase is made, stock will be increased automatically. While selecting automobiles for sale, the proposed software will automatically check for total number of available stock of that particular item, if the total stock of that particular item is less than 5, software will notify the user to purchase the particular item.
Also when the user tries to sale items which are not in stock, the system will prompt the user that the stock is not enough. Customers of this system can search for a automobile; can purchase a automobile easily by selecting fast. On the other hand the stock of automobiles can be maintained perfectly by the automobile shop manager overcoming the drawbacks of existing system.
Hybrid optimization of pumped hydro system and solar- Engr. Abdul-Azeez.pdffxintegritypublishin
Advancements in technology unveil a myriad of electrical and electronic breakthroughs geared towards efficiently harnessing limited resources to meet human energy demands. The optimization of hybrid solar PV panels and pumped hydro energy supply systems plays a pivotal role in utilizing natural resources effectively. This initiative not only benefits humanity but also fosters environmental sustainability. The study investigated the design optimization of these hybrid systems, focusing on understanding solar radiation patterns, identifying geographical influences on solar radiation, formulating a mathematical model for system optimization, and determining the optimal configuration of PV panels and pumped hydro storage. Through a comparative analysis approach and eight weeks of data collection, the study addressed key research questions related to solar radiation patterns and optimal system design. The findings highlighted regions with heightened solar radiation levels, showcasing substantial potential for power generation and emphasizing the system's efficiency. Optimizing system design significantly boosted power generation, promoted renewable energy utilization, and enhanced energy storage capacity. The study underscored the benefits of optimizing hybrid solar PV panels and pumped hydro energy supply systems for sustainable energy usage. Optimizing the design of solar PV panels and pumped hydro energy supply systems as examined across diverse climatic conditions in a developing country, not only enhances power generation but also improves the integration of renewable energy sources and boosts energy storage capacities, particularly beneficial for less economically prosperous regions. Additionally, the study provides valuable insights for advancing energy research in economically viable areas. Recommendations included conducting site-specific assessments, utilizing advanced modeling tools, implementing regular maintenance protocols, and enhancing communication among system components.
Water scarcity is the lack of fresh water resources to meet the standard water demand. There are two type of water scarcity. One is physical. The other is economic water scarcity.
Vaccine management system project report documentation..pdfKamal Acharya
The Division of Vaccine and Immunization is facing increasing difficulty monitoring vaccines and other commodities distribution once they have been distributed from the national stores. With the introduction of new vaccines, more challenges have been anticipated with this additions posing serious threat to the already over strained vaccine supply chain system in Kenya.
COLLEGE BUS MANAGEMENT SYSTEM PROJECT REPORT.pdfKamal Acharya
The College Bus Management system is completely developed by Visual Basic .NET Version. The application is connect with most secured database language MS SQL Server. The application is develop by using best combination of front-end and back-end languages. The application is totally design like flat user interface. This flat user interface is more attractive user interface in 2017. The application is gives more important to the system functionality. The application is to manage the student’s details, driver’s details, bus details, bus route details, bus fees details and more. The application has only one unit for admin. The admin can manage the entire application. The admin can login into the application by using username and password of the admin. The application is develop for big and small colleges. It is more user friendly for non-computer person. Even they can easily learn how to manage the application within hours. The application is more secure by the admin. The system will give an effective output for the VB.Net and SQL Server given as input to the system. The compiled java program given as input to the system, after scanning the program will generate different reports. The application generates the report for users. The admin can view and download the report of the data. The application deliver the excel format reports. Because, excel formatted reports is very easy to understand the income and expense of the college bus. This application is mainly develop for windows operating system users. In 2017, 73% of people enterprises are using windows operating system. So the application will easily install for all the windows operating system users. The application-developed size is very low. The application consumes very low space in disk. Therefore, the user can allocate very minimum local disk space for this application.
Cosmetic shop management system project report.pdfKamal Acharya
Buying new cosmetic products is difficult. It can even be scary for those who have sensitive skin and are prone to skin trouble. The information needed to alleviate this problem is on the back of each product, but it's thought to interpret those ingredient lists unless you have a background in chemistry.
Instead of buying and hoping for the best, we can use data science to help us predict which products may be good fits for us. It includes various function programs to do the above mentioned tasks.
Data file handling has been effectively used in the program.
The automated cosmetic shop management system should deal with the automation of general workflow and administration process of the shop. The main processes of the system focus on customer's request where the system is able to search the most appropriate products and deliver it to the customers. It should help the employees to quickly identify the list of cosmetic product that have reached the minimum quantity and also keep a track of expired date for each cosmetic product. It should help the employees to find the rack number in which the product is placed.It is also Faster and more efficient way.
1. Experiment No. 10 Date:
DETERMINATION OF UNCONFINED COMPRESSIVE STRENGTH OF SOIL
Object and scope:
To determine unconfined compressive strength of given soil in the laboratory using a cylindrical soil
specimen.
Reference:
IS: 2720 (Part 10) – 1973
Theory:
The maximum load that can be transmitted to the sub-soil by a foundation depends upon the
resistance of the underlying soil or rock shearing deformation or compressibility. Therefore, it is
important to investigate the factors that control the shearing strength of these materials. The shearing
is commonly investigated by means of compression test in which an axial load is applied to specimen
and increased until failure occurs. The use of compression test to investigate the shearing strength of
materials depends upon the fact that failure in such tests takes place by shear on one or more inclined
plains and this is possible to compute the normal pressure and the shearing stress on such a plane at
the instant of failure. The specimen may or may not be subjected to a lateral pressure during the test.
When lateral pressure is not applied the test is known is unconfined compression test.
Unconfined compressive strength ‘qu’ is the load per unit area at which an unconfined cylindrical
specimen of soil will fail in a simple compression test. If the unit axial compression force per unit
area has not reached the maximum value, the load per unit area at 20% axial strain shall be
considered the value of unconfined compressive strength ‘qu’.
The unconfined compression test is a special case of tri-axial compressive test in which the all round
pressure σ3 = 0. The test is carried out satisfactorily on the samples which can stand without any
lateral support. The test is an un-drained test and based on assumptions that there is no moisture loss
during test.
Specimen of height to diameter ratio 2:1 is normally used. The sample fails either by shear on
inclined plane or by bulging. The material stress at any stage is obtained by the vertical load divided
by cross sectional area.
The cross sectional area of the sample increases in compression. The cross sectional area (A) at any
stage of loading of sample may be computed on the basic assumption that the total volume of the
sample remains the same
Aoho = Ah
Where, Aoho = Initial cross sectional area and eight of sample.
Ah = c/s area and height off sample after compression.
The average vertical stress at any stage loading, σ = P/ Ac = P (1 – ε)/ Ao
Where, P = vertical load at the strain
Stress – Strain curve is plotted and peak value is taken as unconfined compressive strength (qu).
qu = P/ Ac
Where P = axial load at failure for ordinary soils.
If ϕ is the angle of shearing resistance and C is cohesion.
Then
Qu = 2 C tan (45 + ϕ/2)
Qu = 2 C
Shear strength, S = c + σ tan ϕ
As ϕ = 0
Then S = c = qu/ 2
2. Equipment:
1) Loading machine with facility to adjust rate of strain to desired value.
2) Sample ejector
3) Deformation dial gauge with 0.01 mm least count.
4) Vernier callipers suitable to measure dimensions of test specimen to the nearest 0.1 mm
5) Oven thermo-statically controlled, maintaining the temp at 110 °C ± 5 °C.
6) Proving ring to measure axial load applied.
Preparation of test specimen
1) Compacted specimen is prepared at optimum water content and maximum dry density. Tube
sampler is pushed into this compacted soil and then removed by removing the surrounding soil.
Then circular sample is ejected out using sample ejector.
2) After the specimen is formed the ends shall be trimmed perpendicular to the long axis.
3) The specimen has minimum diameter of 38 mm and the largest particle contained within the test
specimen shall be smaller than 1/8 of the specimen diameter. The height to diameter ratio shall
be 2.
Procedure:
1) The initial length, diameter and weight of the specimen shall be measure and the specimen place
on the bottom plate of the loading device. The upper plate shall be adjusted to make contact with
the specimen.
2) The deformation dial gauge shall be adjusted to zero. Force shall be applied so as to produce
axial strain at a rate of 0.5 to 2 percent per minute. Force and deformation reading shall be
recorded at a suitable interval.
3) The specimen shall be compressed until failure surface have definitely developed or the stress
stain curve is well past its peak or 20 percent of axial strain is reached.
4) The failure pattern shall be sketched carefully and shown on stress-strain curve. The angle
between failure surface and the horizontal is measured.
Observations:
Length of soil specimen, L =
Diameter of soil specimen, d =
Cross sectional area of soil specimen, Ao =
Volume of Soil Specimen =
L. C. of Dial gauge =
L. C. of Proving Ring =
Constant of Proving Ring =
3. Observation Table:
Sr.
No.
Dial gauge Proving ring Strain
(Ɛ)
Corrected
cross
sectional area
Ac = Ao/(1-Ɛ)
in mm2
Stress
σ = P/ Ac
in N/ mm2
reading
in
division
Deformation
(∆L) in
mm
reading
in
division
Load
in N
(P)
1 50
2 100
3 150
4 200
5 250
6 300
7 350
8 400
9 450
10 500
11 550
12 600
13 650
14 700
15 750
16 800
17 850
Calculations:
Axial strain, Ɛ = ∆L/ L0
Average cross sectional area, Ac = Ao/ (1- Ɛ)
Compressive stress, σ = P/A
In case of soils which behaves as if the angle of shearing the resistance ø = 0 the shear strength or
cohesion of the soil may be taken to be equal to half of unconfined compressive strength.
i.e. Shear Strength (S) = Cohesion (c) = qu/2
Graph Plotting:
A graph is plotted between stress (σ) and strain (Ɛ). The maximum stress from this plot gives the
value of the unconfined compressive strength. In case no maximum occurs within 20 percent axial
strength the unconfined compressive strength shall be taken as the stress at 20 percent axial strain.
Result:
Unconfined Compressive strength of Soil, qu =
Cohesion, C =
Angle of shearing resistance, ø =