Download to read offline
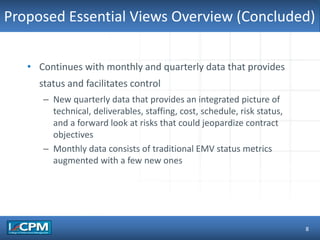
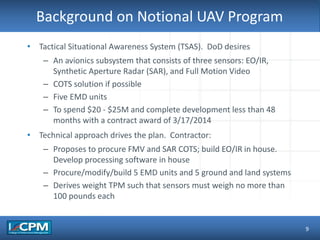
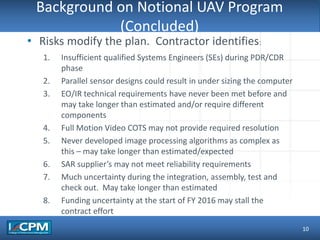
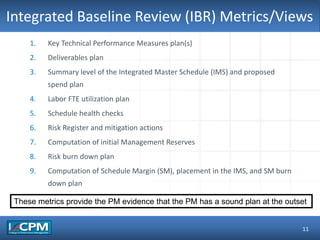
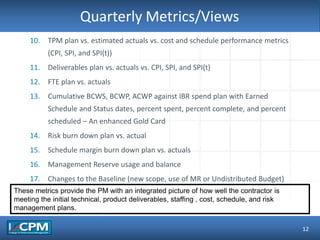
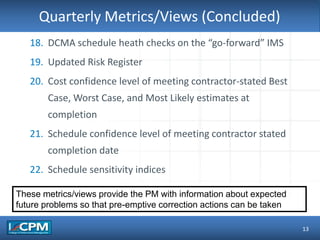
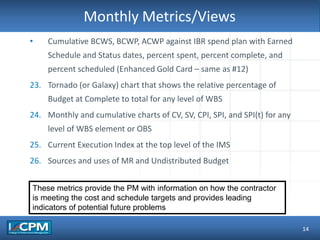
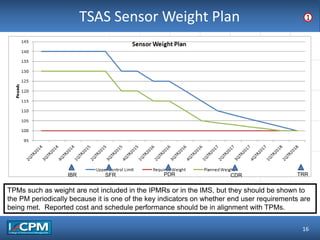
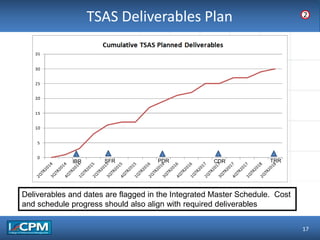
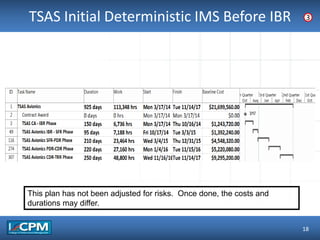
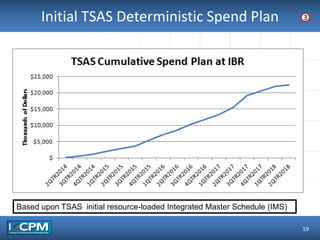
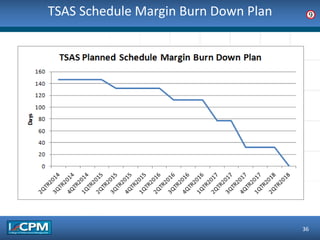
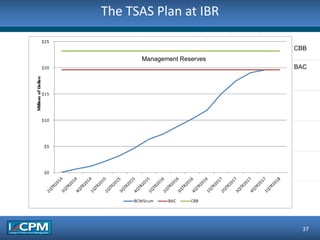
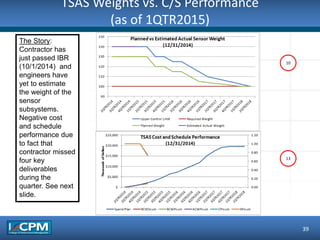


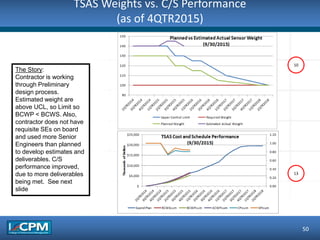
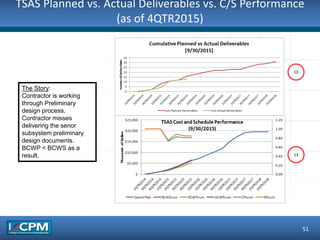
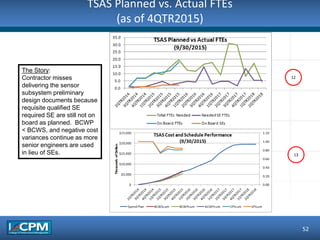
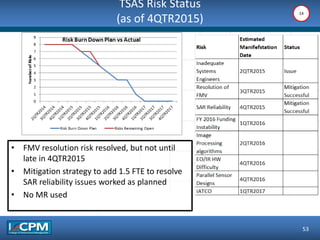


The document discusses proposed integrated program management metrics and views that would be valuable for government program managers. It outlines 26 proposed metrics across 3 categories: 1) Metrics for the Integrated Baseline Review that establish the initial plan and baseline. 2) Quarterly metrics that provide an integrated view of technical, schedule, cost, risk, and forecasted issues. 3) Monthly metrics that track ongoing cost and schedule performance. Examples are shown for a notional UAV program to demonstrate how the metrics could be applied in practice to provide visibility and facilitate control of a contracted project.


![Getting Started with Apache Spark: Big Data Made Simple [Free Meetup]](https://cdn.slidesharecdn.com/ss_thumbnails/apachesparkgettingstarted-260203175547-8361bcc3-thumbnail.jpg?width=640&height=640&fit=bounds)


