Download as PDF, PPTX


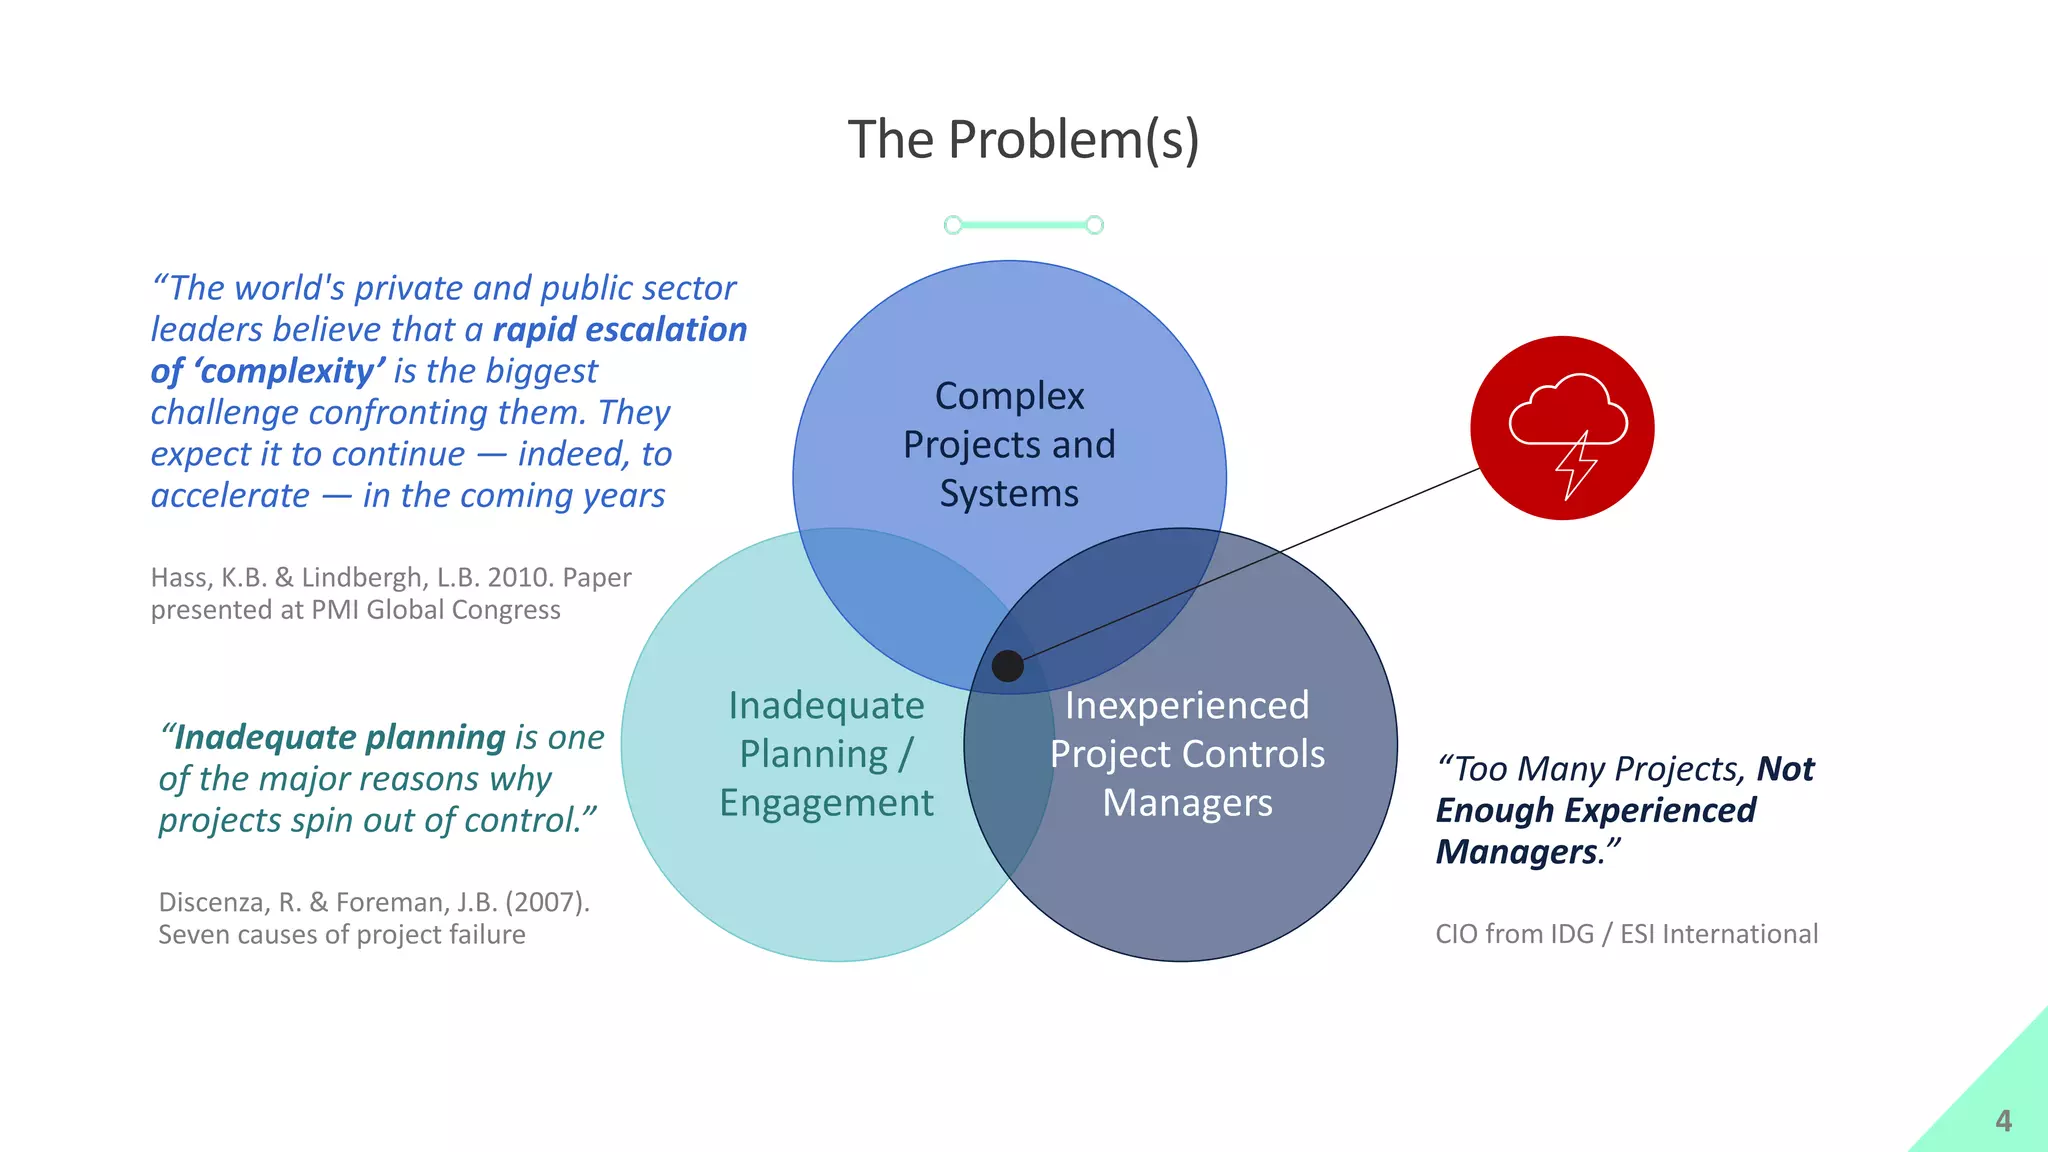
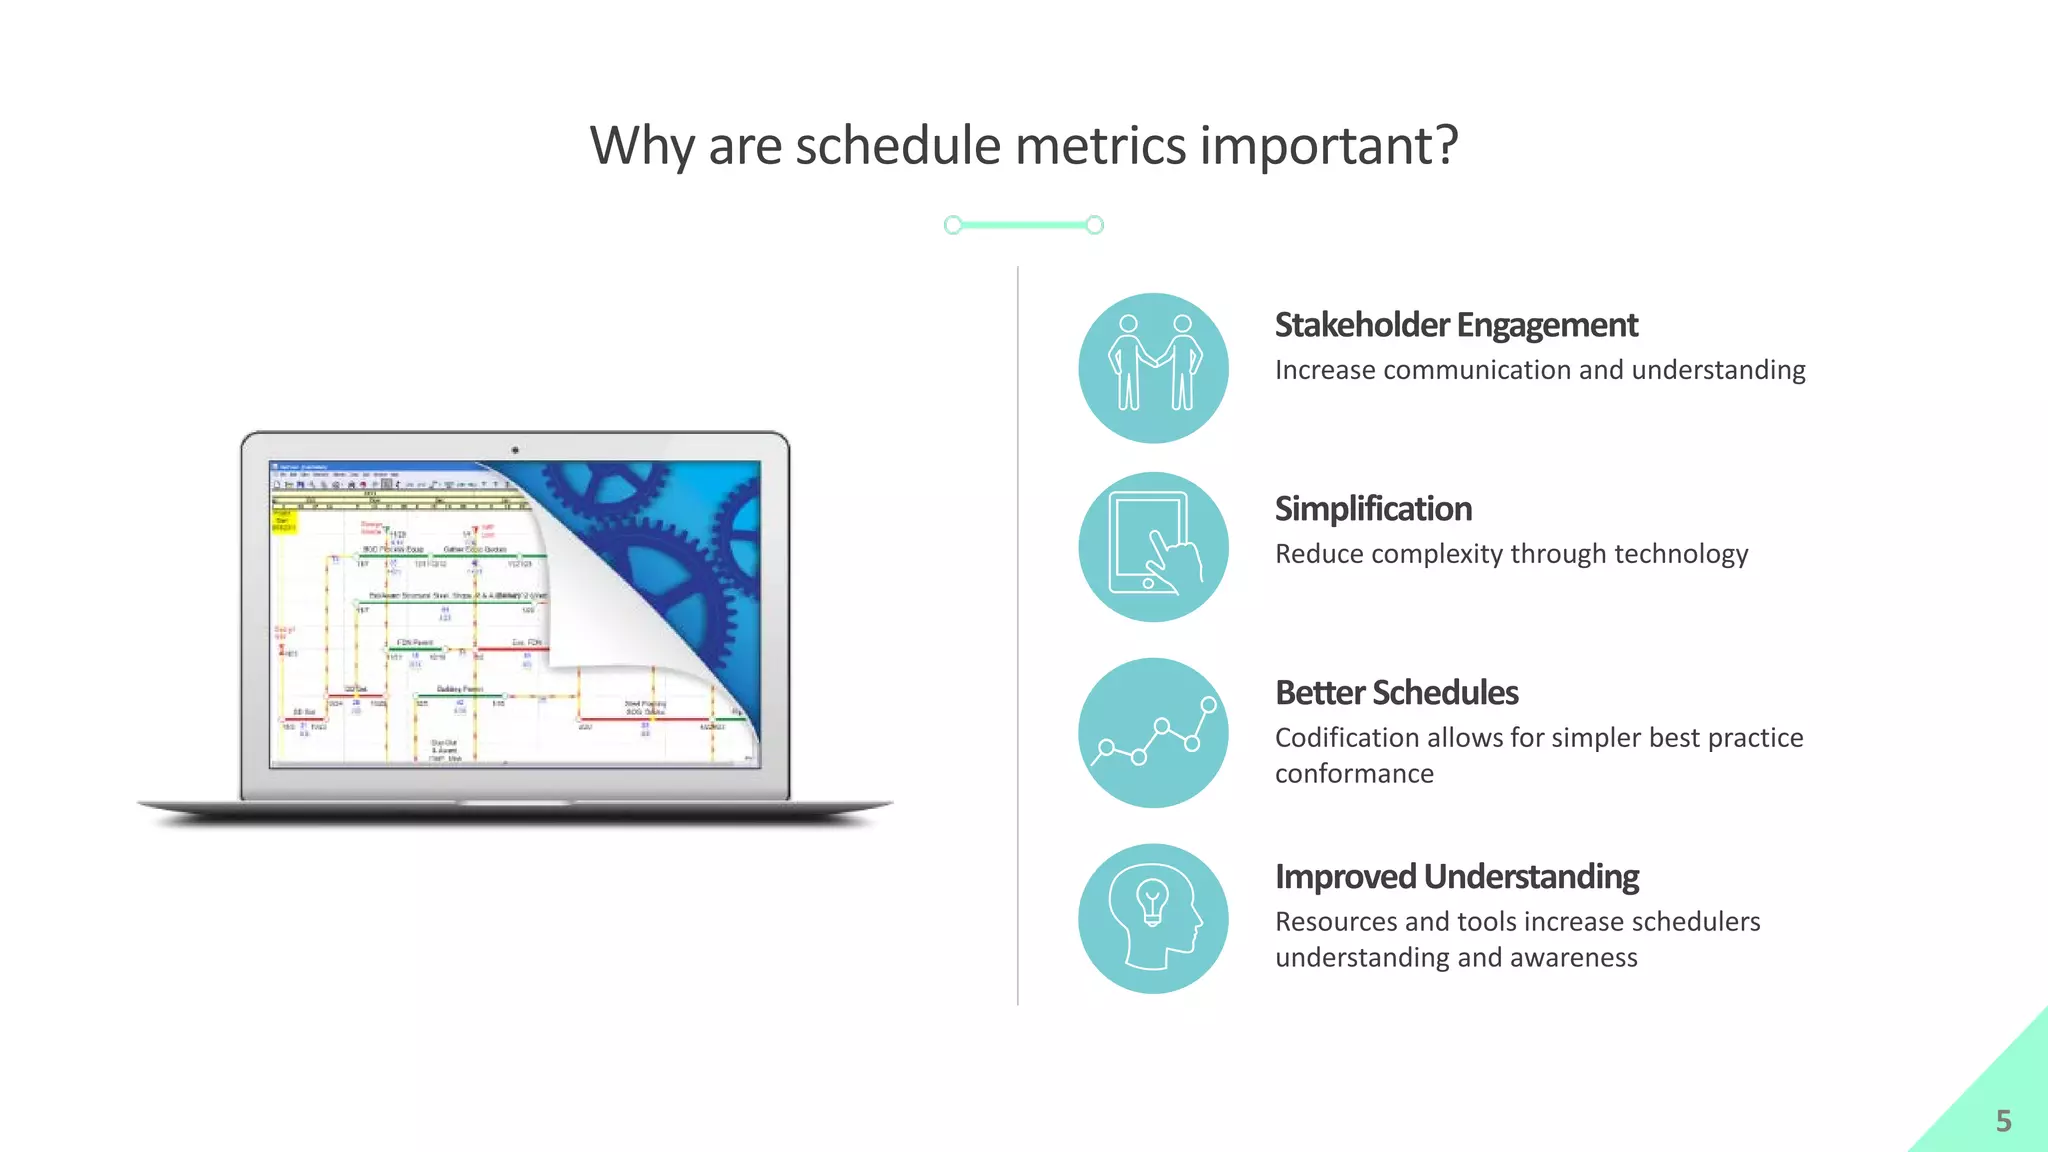
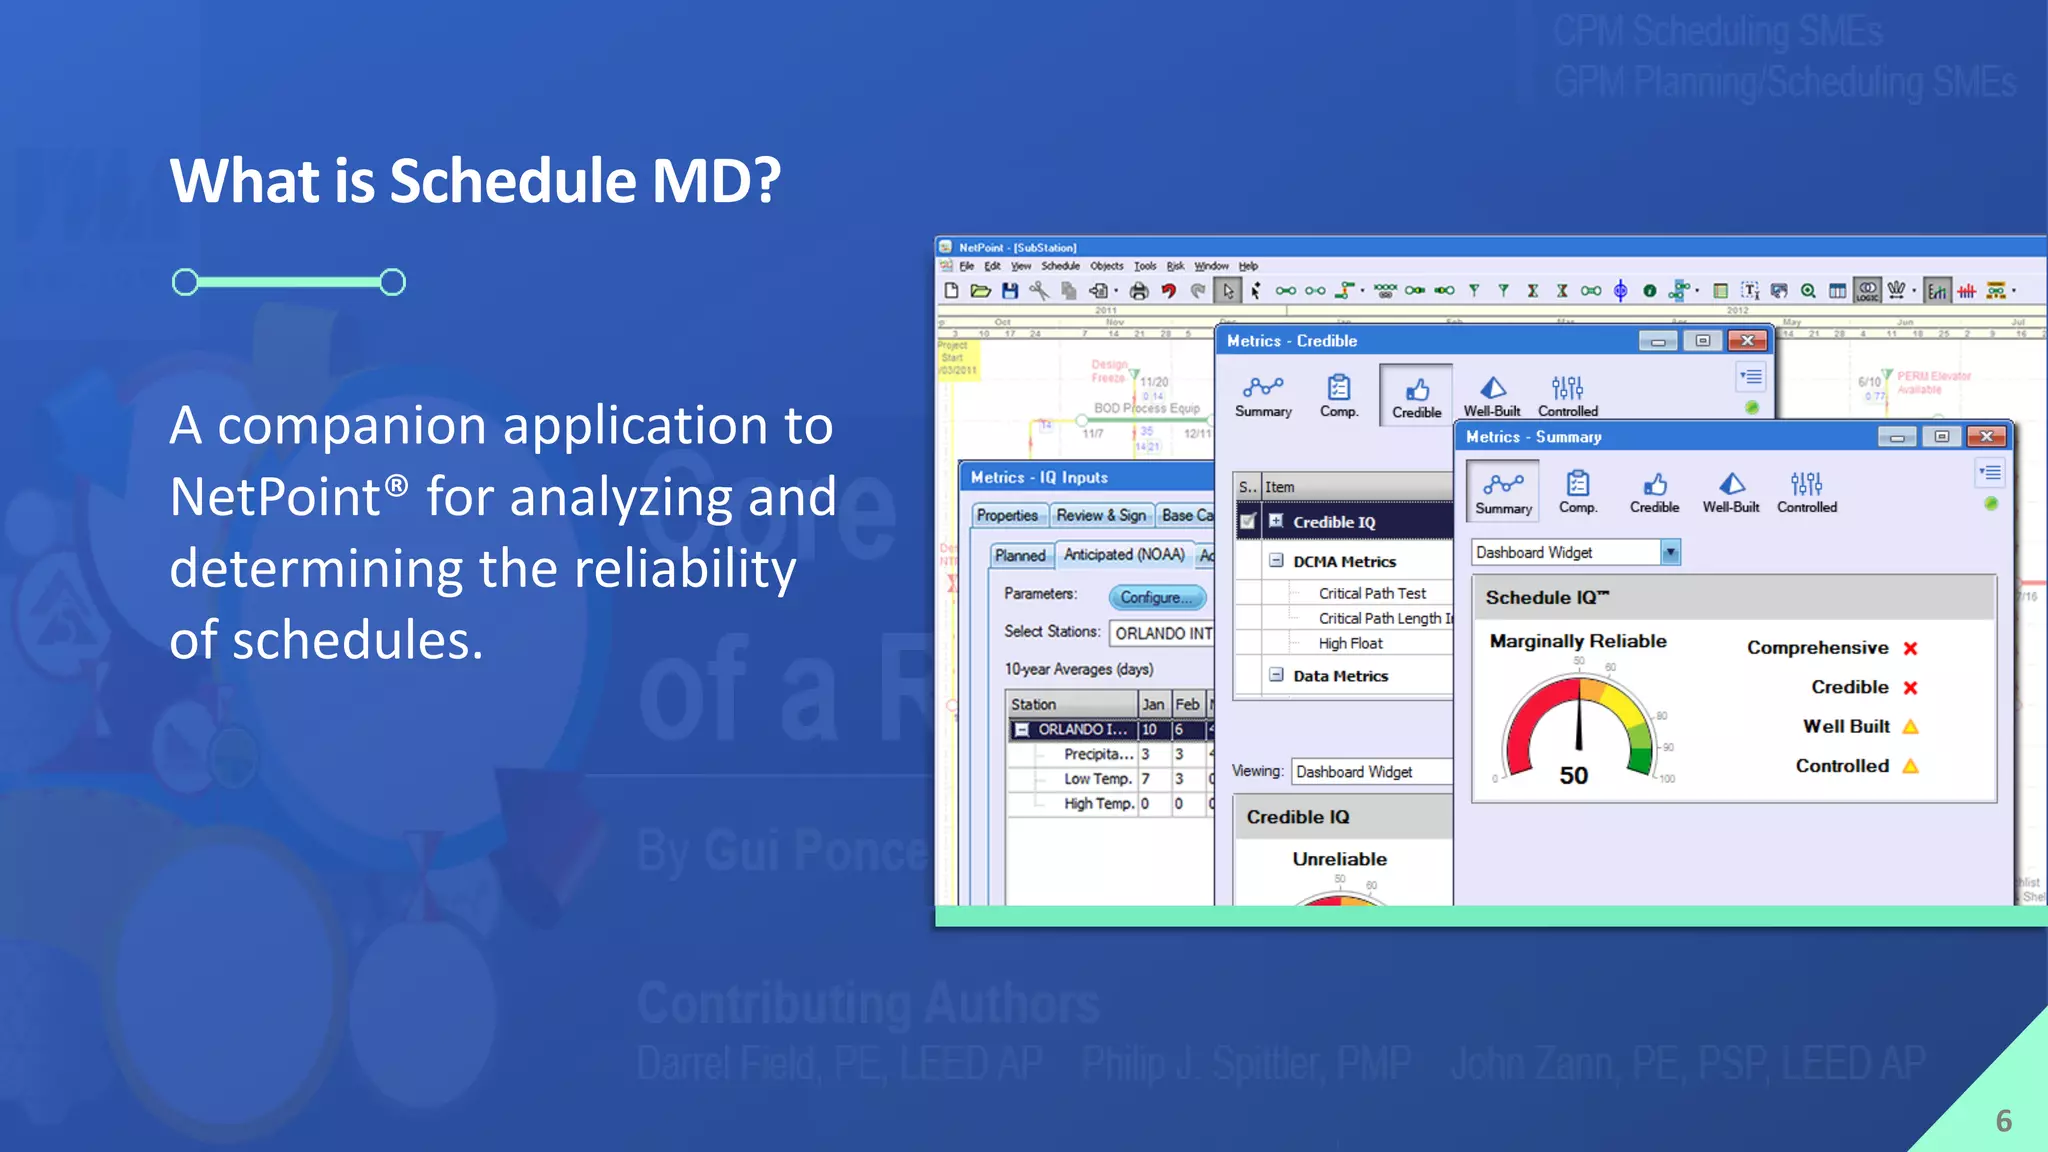
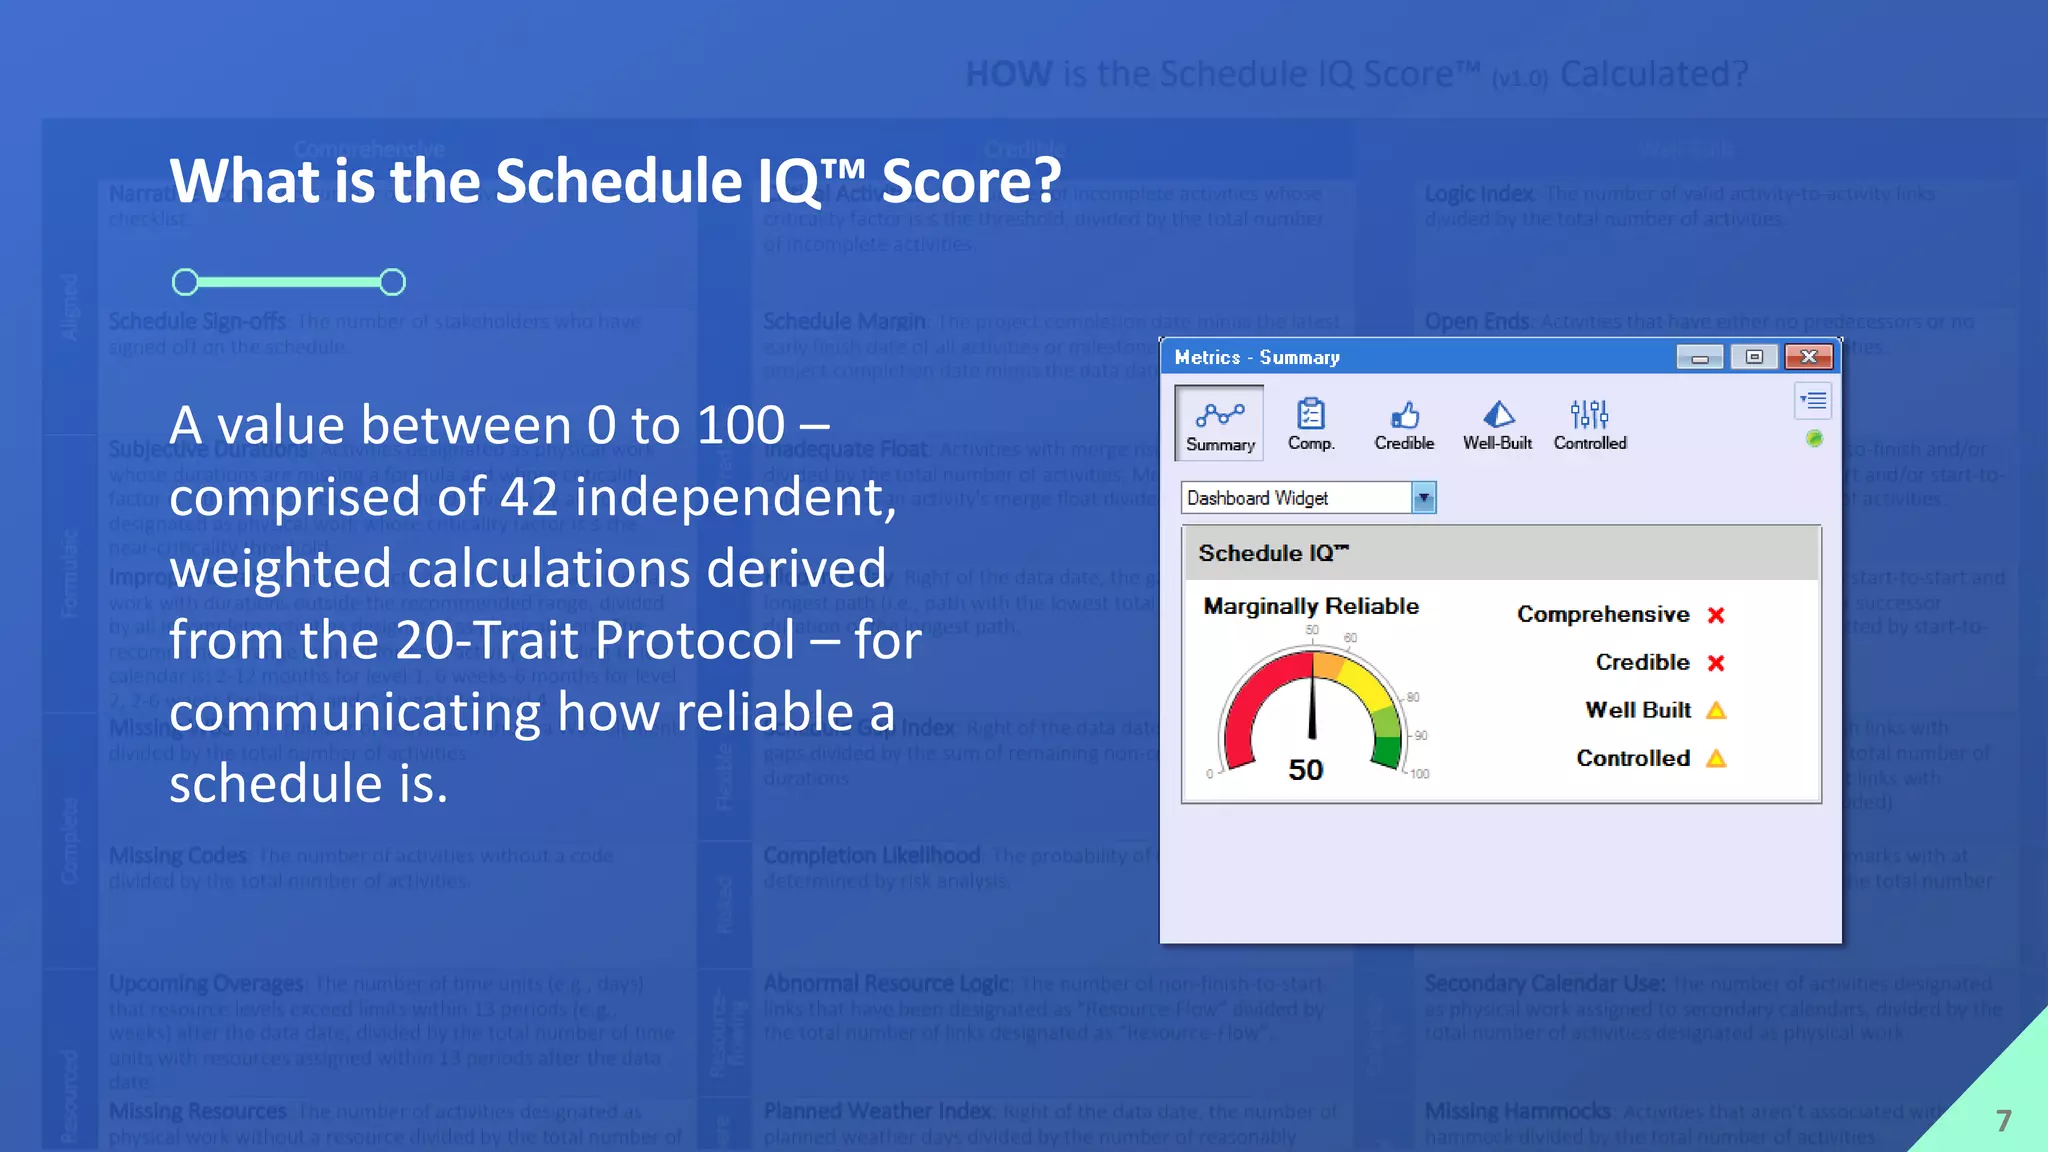
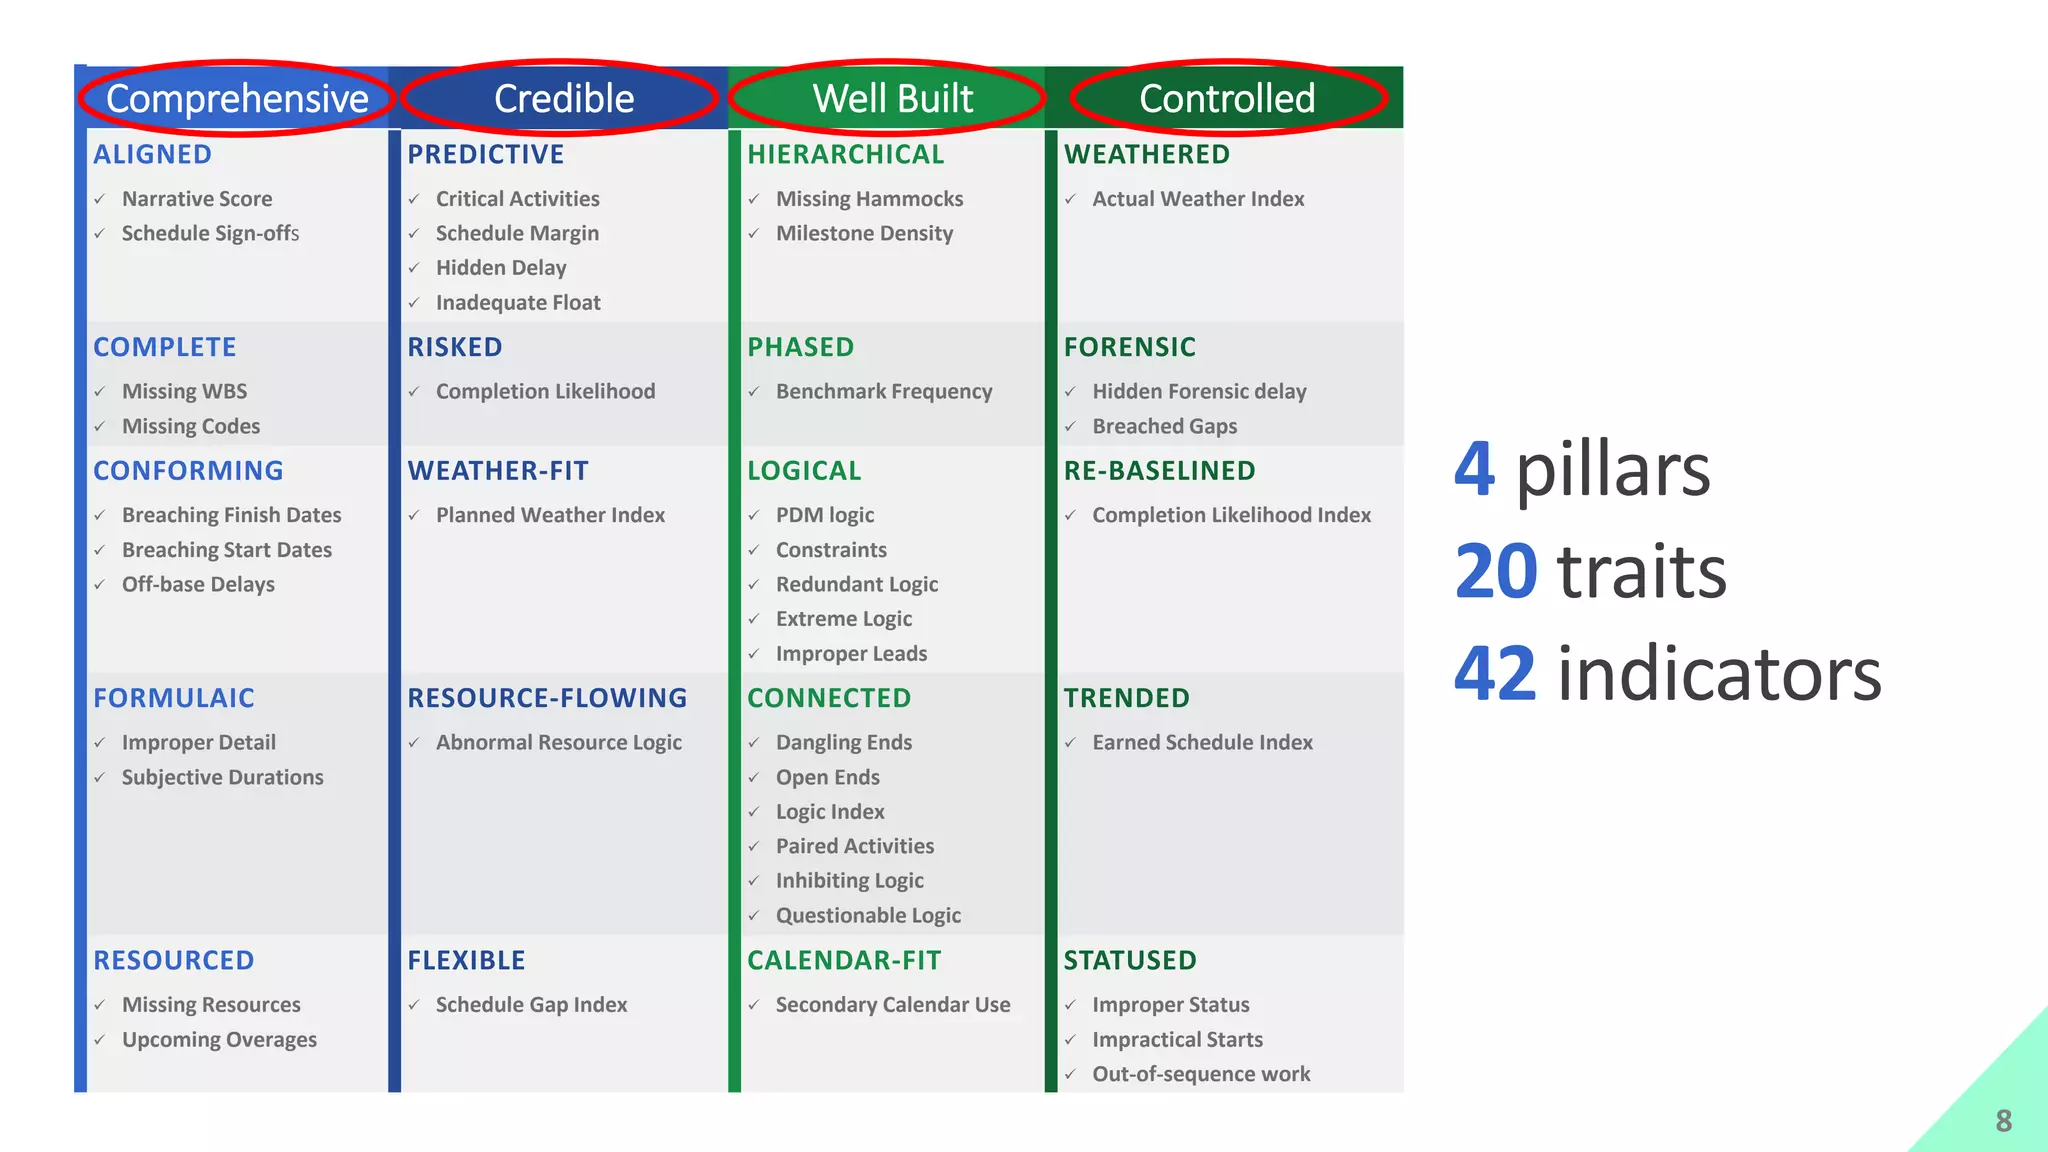


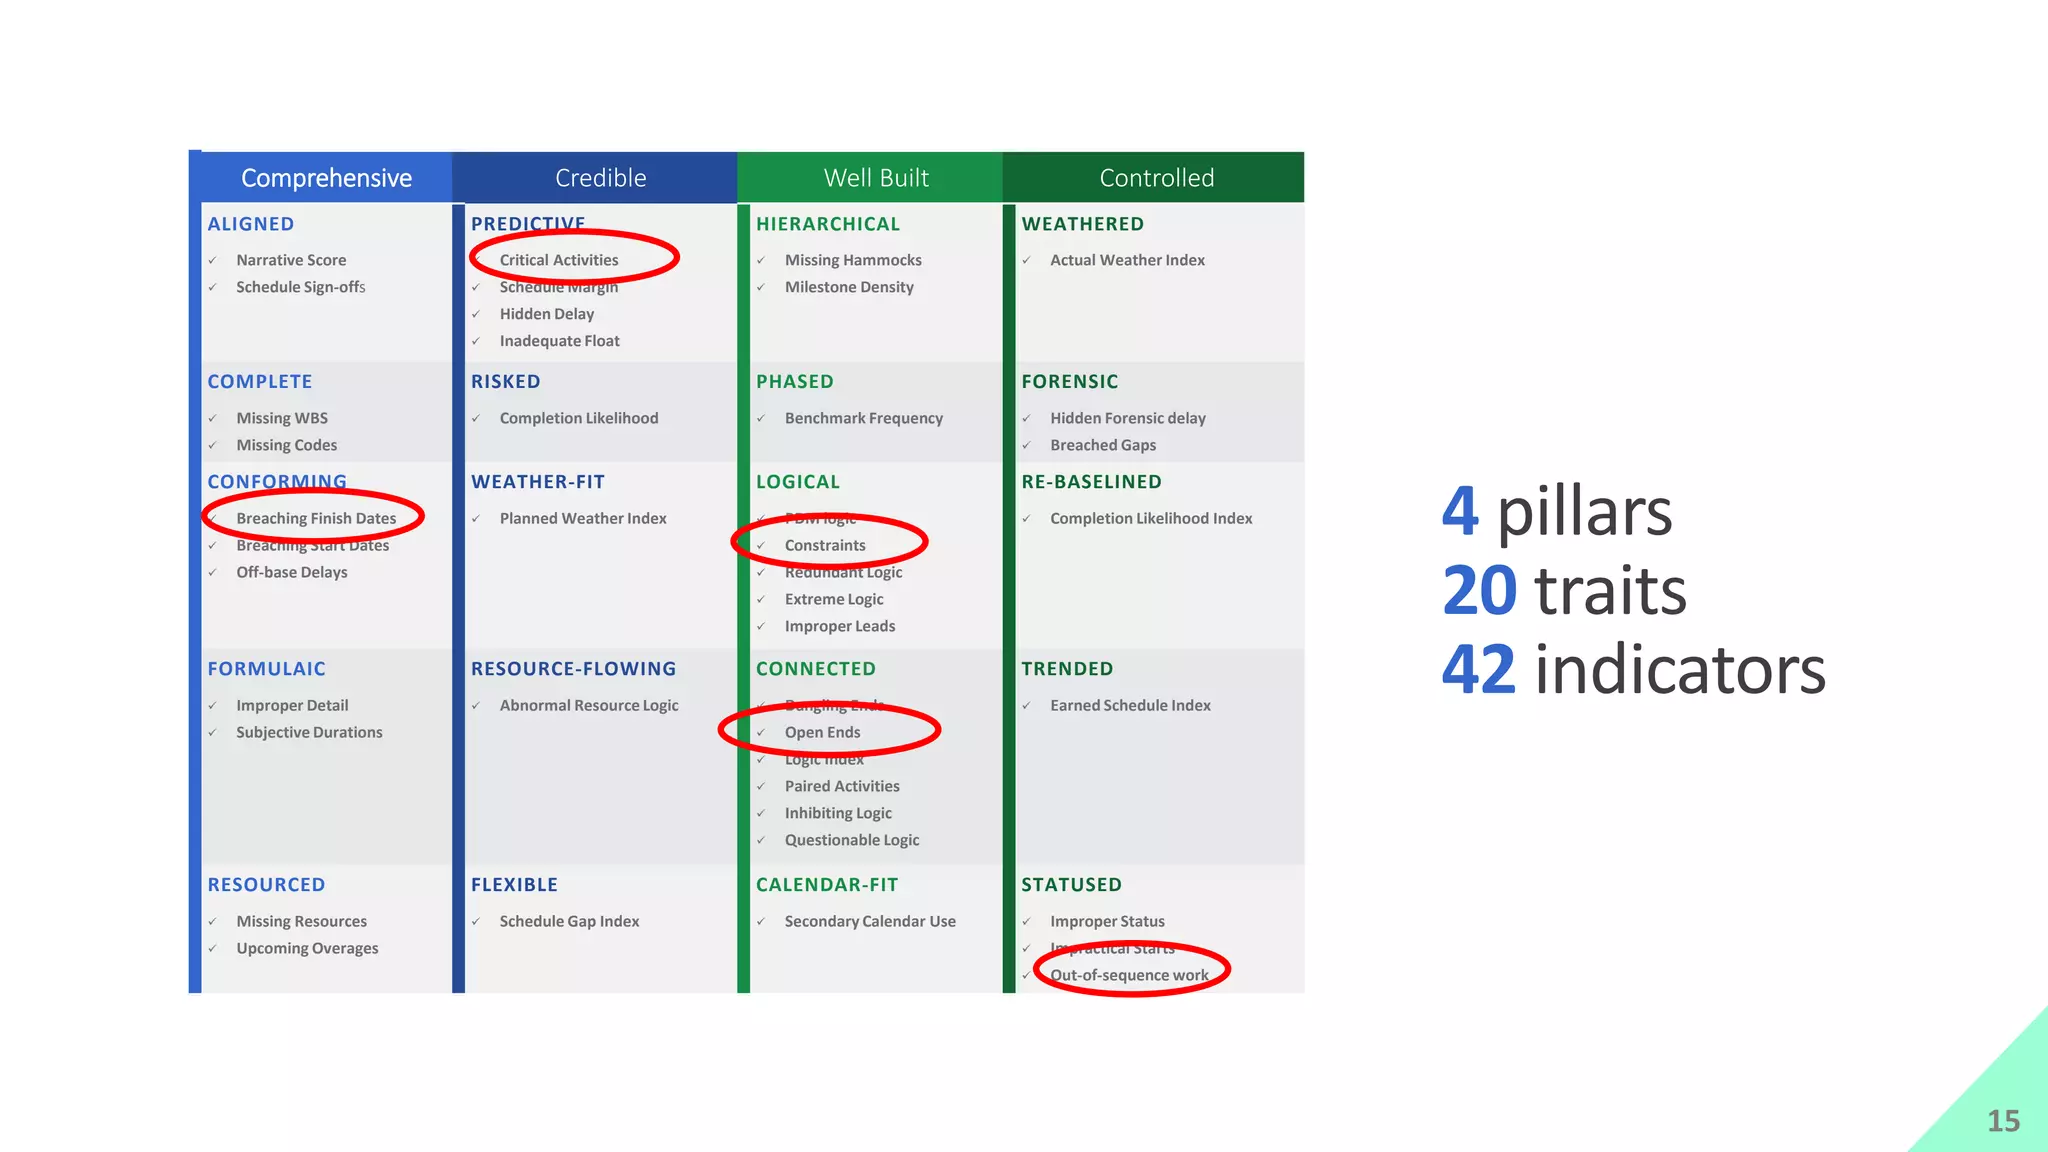


The presentation by Mike Brown discusses the importance of schedule metrics for enhancing schedule reliability in complex projects. It highlights common problems in project management such as inadequate planning and inexperienced personnel, while introducing the Schedule MD application for analyzing schedule reliability. Key concepts include the Schedule IQ score and the four pillars and twenty traits that affect schedule health.


