Download to read offline

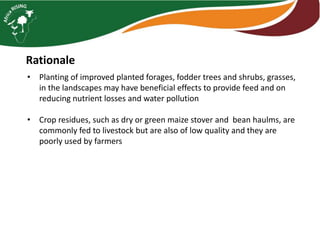
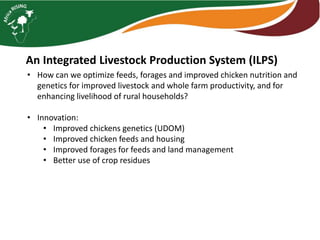
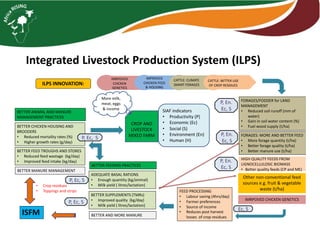
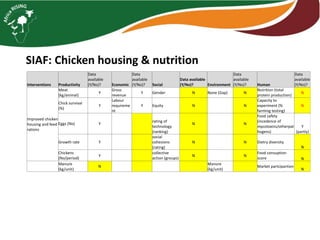
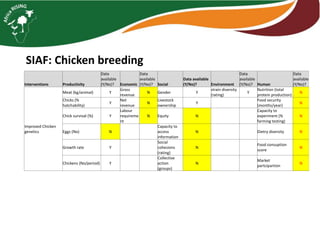
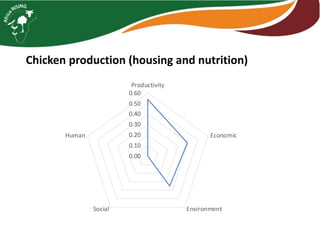
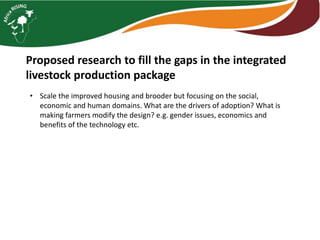

The document discusses integrated livestock feed strategies to enhance productivity, nutrient management, and water conservation through improved forages, crop residues, and chicken genetics in rural African farming systems. It emphasizes the importance of maximizing feed resources, better housing, and management practices to support the livelihoods of smallholder farmers while addressing environmental challenges. Proposed research aims to evaluate adoption drivers and optimize the use of improved feed and management practices across various farm typologies.


![Polymer [ बहुलक ] Chemistry Notes PDF - Irfanullah Mehar - JJ Sir Chemistry.pdf](https://cdn.slidesharecdn.com/ss_thumbnails/polymerchemistrynotespdf-irfanullahmehar-jjsirchemistry-260210172118-3f9b37f7-thumbnail.jpg?width=640&height=640&fit=bounds)

