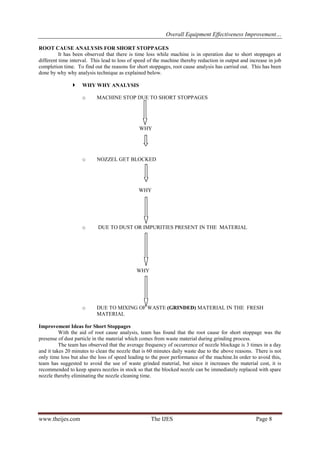
The International Journal of Engineering & Science is aimed at providing a platform for researchers, engineers, scientists, or educators to publish their original research results, to exchange new ideas, to disseminate information in innovative designs, engineering experiences and technological skills. It is also the Journal's objective to promote engineering and technology education. All papers submitted to the Journal will be blind peer-reviewed. Only original articles will be published.
1. The International Journal Of Engineering And Science (IJES)
|| Volume || 3 || Issue || 8 || Pages || 01-10 || 2014 ||
ISSN (e): 2319 – 1813 ISSN (p): 2319 – 1805
www.theijes.com The IJES Page 1
Overall Equipment Effectiveness Improvement: A Case of injection molding machine
Mr. Lalit D. Gabahne P.G. Student, Industrial Engg Department Shri Ramdeobaba College of Engg. And Management (An autonomous college under RTMU Nagpur) Katol Road Nagpur-440013, India.
Dr. Mahendra M. Gupta HOD & Faulty, Industrial Engg Department Shri Randeobaba College of Engg and Management (An autonomous college under RTMU Nagpur)
Katol Road Nagpur-440013, India.
Mr. D.R. Zanwar Associate Prof, Industrial Engg. Shri Randeobaba College of Engg. and Management (An autonomous college under RTMU Nagpur)
Katol Road Nagpur-440013, India.
-------------------------------------------------------------ABSTRACT-------------------------------------------------------- In the generation of agile manufacturing, the machines and its functions are also becoming complex. OEE of a machine plays an important role in present scenario where delivery and quality are of prime importance to customer. The aim is to illustrate the use of SMED tools, TPM and 5S techniques by discussing a novel case study dedicated to the improvement of Overall Equipment Effectiveness (OEE). Initially the machine history was analysed which helped in finding the bottleneck machine. The OEE was found to be 62% in the identified bottleneck machine. Further, a TPM team was formed to devise a systematic approach to improve the effectiveness. The project has been addressed in three aspects; namely Availability, Performance and Quality which quantify OEE of a machine. The case study was conducted in M/s Narke Electricals Pvt. Limited, B6, MIDC Hingna, Nagpur. The company which produces injection molded parts in plastic using several presses. A 200 ton Injection Moulding machines had a low OEE with a large variability. This led to the company not satisfying a customer in terms of on-time delivery performance. The large variability OEE led to high costs in terms of work-in-process and re- inspections of the products. Following a Single Minute Exchange of Die, defined the set-up times and Root Cause Analysis to find the reasons for short stoppages. Thus, adding to the objective of OEE improvement as a result. The result obtained from the TPM approach showed that the OEE was improved from 62% to 67% which indicated the desirable level in all manufacturing industry. To sum up, total saving per annum due to increased effectiveness was around Rs.2,04,000. ---------------------------------------------------------------------------------------------------------------------------------------
Date of Submission: 17 July 2014 Date of Publication: 20 August 2014 --------------------------------------------------------------------------------------------------------------------------------------- I. INTRODUCTION
In most of the automotive parts manufacturing units lack of higher rate of quality defects in produced parts and minor stops due to workforce, planning and unskilled operators for their competitive. So that it is required to keep proper observation for reducing product rejection and wastage, producing parts without defect, proper training for workers and reducing equipments breakdown and down time. The term Total productive maintenance (TPM) is originated in Japan in the year 1971 as a method for improved machine availability through better utilisation of maintenance and production resources. In most production settings the operator is not viewed as a member of the maintenance team, in TPM. The machine operator is trained to perform many of the day-to-day tasks of simple maintenance and fault-finding. Teams are created that include a technical expert (often an engineer or maintenance technician) as well as operators. The concept of overall equipment effectiveness was originated from Japan in 1971. The Japan Institute of Plant Maintenance promoted the total productive maintenance (TPM) which includes overall equipment efficiency. The OEE calculation is quite general and can be applied to any manufacturing organisation. It is closely tied to JIT (Just in Time) and TQM (Total Quality Management) and it is extension of PM (preventive maintenance), where the machines work at high productivity and efficiency, and where the maintenance is all
2. Overall Equipment Effectiveness Improvement…
www.theijes.com The IJES Page 2
employee responsibility, and focus to prevent the problem before it may occurs. The aim of TPM to reduce the six major equipment losses, to zero, has been recognised as necessary for corporate survival. TPM is a unique Japanese system of plant management, developed from preventive maintenance concept. This approach emphasises the role of team work, small group activities, and the participation of all employees to accomplish equipment improvement objectives. It challenges a sense of joint responsibility between operators and maintenance workers, not only to keep the machines running smoothly, but also to extend and optimise their overall performance. TPM is intended to bring both functions (production and maintenance) together by a combination of good working practices, team working and continuous improvement. This work focus on improving the Overall Equipment Effectiveness of the Injection Moulding machine through the implementation of availability, better utilisation of resources, high quality products and also raised employee morale and confidence.
II. RESEARCH METHOLODOGY
Overall Equipment Effectiveness The Effectiveness of the equipment is the Actual Output over the Reference Output. Equipment Effectiveness shows how effectively an equipment is utilised. Overall Equipment Effectiveness shows the effectiveness of a machine compared to the ideal machine as a percentage. OEE is essentially the ratio of Fully Productive Time to Planned Production Time. In practice, however, OEE is calculated as the product of Availability, Performance and Quality. OEE = Availability X Performance Rate X Quality Rate Availability – is enhanced by eliminating equipments breakdowns, setup/adjustment losses and other stoppages. It measure “Productivity Losses” from Breakdown times and remaining time is called “Operating Time”. Availability is the ratio of Operating Time to Planned Production time. It represents the percentage of schedule time that the equipment is available to operate. It takes into account Down Time Losses. Availability = (Available Time – Unplanned Downtime) / Available Time
Available Time = Total Available Time – Planned Downtime
Planned Downtime – Excess Capacity, Planed breaks, Planned maintenance, Communication break, Team meetings.
Unplanned Downtime – Breakdowns, Setup and Adjustment, Late material delivers, Operator availability
Performance Rate – is enhanced by eliminating equipment idling and minor stoppage and reduced speed losses. It measure “Productivity Losses” from slow cycles and remaining time is called “Net Operating Time”. Performance is the ratio of Net Operating Time to Operating Time. It represents the speed at which the equipment runs as a percentage of its designed (Ideal) speed. It takes into account Speed Losses. Performance = (Total Production Parts / Operating Time) / Idle run rate
Operating Time = Available Time – Unplanned Downtime
Idle run rate = Number of parts per minute
Output (Quantity of Product) = Operating Time / Actual Cycle Time
Net Operating Time (Productivity) = (Output x Actual Cycle Time) / Actual Operating Time
Rate Efficiency = Processed Amount x (Actual Cycle Time / Actual Operating Time)
Speed Efficiency = Design (Ideal) Cycle Time / Actual Cycle Time
Quality Rate – is enhanced by eliminating quality defects and rework, and start up losses. It takes into account Quality Losses and remaining time is called “Fully Productive Time”. Quality is the ratio of Fully Productive Time to Net Operating Time. It represents the Good units produced as a percentage of the Total units produced. Quality Rate = (Total Produced Parts – Defects Parts) / Total Produced parts Six Big Losses OEE is a simple tool that will help to measure the effectiveness of their equipment. It takes the most common and important sources of productivity loss, which are called six big losses and given in Table 1.0.
3. Overall Equipment Effectiveness Improvement…
www.theijes.com The IJES Page 3
TABLE 1.0 SIX BIG LOSSES
Major Loss Event
OEE Metric
Loss Category
Example of Loss Category
Machine breakdowns
Availability
Down time
Equipment failures, Tooling damage, Unplanned maintenance
Machine adjustments/ setups
Availability
Down time
Process warm- up, Machine change over’s, material shortage
Machine stops
Performance
Speed
Product misdeeds, component jam, product flow stoppage
Machine reduced speeds
Performance
Speed
Level of machine operator training, Equipment age, Tool wear
Machine bad parts
Quality
Quality
Tolerance adjustments, worm up process, damage
Machine production bad parts
Quality
Quality
Assembled incorrectly, rejects, rework
OEE Percentage Formula OEE percentages are useful when tracking and trending the performance effectiveness (reliability) of a single piece of equipment or single-stream process over a period of time. Using OEE for multiple aggregated assets is not a valid application of the formula. The following is a basic example of OEE percentage calculation. OEE % = Availability % x Performance efficiency % x Quality rate % Availability % = (Actual operating time ÷ Gross available time) x 100 Performance efficiency % = (Actual production rate ÷ Design production rate) x 100 Quality rate % = ((Total units produced – Defective units produced) ÷ Total units produced)) x 100 Single Minute Exchange of Die Single-Minute Exchange of Die (SMED) was developed by Shigeo Shingo in 1950s Japan in response to the emerging needs of increasingly smaller production lot sizes required to meet the required flexibility for customer demand. The SMED technique is used as an element of Total Productivity Maintenance (TPM) and “continuous improvement process”. It is one of the method of a reducing wastage in a manufacturing Process.
Single-Minute Exchange of Die is one of the many lean production methods for reducing waste in a manufacturing process. It provides a rapid and efficient way of converting a manufacturing process from running the current product to running the next product. This rapid changeover is key to reducing production lot sizes and thereby improving flow (Mura).
The phrase “single minute” does not mean that all changeovers and startups should take only one minute, but that they should take less than 10 minutes (in other words, “single-digit minute”). Closely associated is a yet more difficult concept, One-Touch Exchange of Die, (OTED), which says changeovers can and should take less than 100 seconds. A Die is a tool used in manufacturing. However SMED’s utility of is not limited to manufacturing (see value stream mapping.
4. Overall Equipment Effectiveness Improvement…
www.theijes.com The IJES Page 4
Root Cause Analysis
RCA is a method of problem solving that tries to identify the root causes of faults or problems. RCA practice tries to solve problems by attempting to identify and correct the root causes of events, as opposed to simply addressing their symptoms. Focusing correction on root causes has the goal of preventing problem recurrence. RCFA (Root Cause Failure Analysis) recognises that complete prevention of recurrence by one corrective action is not always possible. The Why Why Analysis is a great simple technique for involving a team in getting to the Root Causes of a problem, issue or opportunity. The 5 Whys is an iterative question-asking technique used to explore the cause-and-effect relationshipsunderlying a particular problem. The primary goal of the technique is to determine the root cause of a defect or problem. (The “5” in the name derives from an empirical observation on the number of iterations typically required to resolve the problem.)
III. MODEL CONSTRUCTION AND SOLUTION
Data Collection and Analysis Compiling the obtained data of 200 ton injection molding machine over a period of time, data analysis is done on excel sheet and then summarised in the form of percentage as shown in Table No.1.1 and Figure No.1.1. This data gives the details about current performance of the machine in terms of Time Availability, Performance Efficiency, Quality Rating and OEE. Table No. 1.1 Percentage of Parameters
Parameters
Average Percentage
Time Availability
82
Performance Efficiency
77
Quality Rating
98
OEE
62
Figure No. 1.1 Again analysis of data is carried out to know the time available for the various operations and the percentages of time loss in various operations as shown in Table No.1.2 thereby knowing the various reasons for low OEE. Table No. 1.2 Analysis for Low OEE
Parameters
Time in Minutes
Time in Hours
Percent
Available Loading Time
20910
349
100
Available Production Time
17090
285
82
Job Change over Time
955
16
5
Down Time
2865
48
14
Also numbers of trials taken for job change over and average time required for each activity are noted by stop watch time study as shown in Table No.1.3 and Figure No.1.2.
5. Overall Equipment Effectiveness Improvement…
www.theijes.com The IJES Page 5
Table No.1.3 Activities for Job Change Over
Activity No.
Activities for job change over
Trial 1
Trial 2
Trial 3
Trial 4
Time in Minutes
Time in Minutes
Time in Minutes
Time in Minutes
Average Time
Job Name
Diffusion knife(abs)
Round mount (tffp)
Elanza plit (pp)
Round mount (tffp)
1
Choosing the right mould in the warehouse and bringing it to the press
9
11
8
7
9
2
Choosing the right screws, bolts and fasteners for the mould.
0
0
0
0
0
3
Stopping the press and waiting for its cooling down.
0
0
0
0
0
4
Removing of cooling pipes
4
5
4
4
4
5
Unscrewing the two screws of old mould
8
8
7
7
8
6
Removing the old mould with the hammer and the lever.
3
4
5
4
4
7
Putting the old mould on the hand track.
5
5
5
6
5
8
Carrying away the old mould.
4
5
5
4
5
9
Bringing the new mold closer.
4
5
4
5
5
10
.Installing new mold.
7
7
7
6
7
11
Regulating and centering the new mold.
6
6
7
7
7
12
Tightening screws at the right tightening torque
6
6
6
6
6
13
Re-checking centering.
5
4
5
4
5
14
Fitting of cooling pipes.
4
5
6
4
5
15
Rejecting the first scraps
15
13
13
12
13
Total Time
80
84
82
76
80
6. Overall Equipment Effectiveness Improvement…
www.theijes.com The IJES Page 6
Average time for each activity of job change over
Activity. No.
Average Time in Min
1
9
2
0
3
0
4
4
5
8
6
4
7
5
8
5
9
5
10
7
11
7
12
6
13
5
14
5
15
13
Fig. 1.2 Average time for each activity of job change over A study and data analysis of around 15 days we can observe that most of the time that is fourteen percent of the Loading time lost due to down time which is mostly because of short stoppages and to rectify the quality defects. Also the another reason for time lost is due to job change over. Job Change Over is found to be of about five percent of the loading time. The short stoppages and job change over also leads to speed loss which is the main reasons for low OEE. Also It has been observed that on an average eighty minutes are required for a single job change over which need to be reduced. A stop watch time study is carried out to note down the time required for each activity for job change over as shown in the Table No.1.3. Implementation Plan The reasons for low OEE were listed. A systematic approach to increase OEE to acceptable level was attempted using TPM and 5S techniques. The following section provides information about the approach. Project was divided in to three parts as OEE is product of three parameters namely 1) Availability 2) Performance 3) Quality Formation of TPM Team for the improvement of OEE: A TPM team was formed in the company which involved operators, supervisors and managers. The team motive was to initiate TPM activities in the cell and then to horizontally deploy it to the other machine of the company. Team decided to convert the bottle neck machine into the model machine. This was done by educating the operators about the importance of TPM and was necessary in the present situation. Application of SMED Methodology SMED helps to reduce the setup time by eliminating wastes and unwanted processes and alsohelps to improve current setup process and manufacturing flexibility. The following activities are carried out during application. Distinguish Between Internal Activities and External Activities: Internal Means: Those carried out when the machine has stopped. External Means: Those carried out when the machine is running.
a) Converting Internal Activity to External Activity:
In Order to convert internal activity to External activity main focus is on the tasks related with mould handling, information gathering, adjustment and control. Our aim is to convert more internal activities to External.
b) Streamlining all aspects of the Operation:
In the final Step the improvements studies were done and checklists were formed. The causes for recursive activities were searched as possible and ideas implemented to eliminate them were provided. Finally, the tasks will no longer be unpredictable time delays by use of the precise time records. Therefore, better Planning activities will lead to customer satisfaction.
7. Overall Equipment Effectiveness Improvement…
www.theijes.com The IJES Page 7
Tables 1.4: shows the detailed activities before SMED, after SMED and improvement ideas are given:
Activity No.
Activities for job change over
Time Before SMED
Activity Before SMED
Improvement Ideas
Time After SMED
Activity After SMED
Time Saving (in min)
1
Choosing the right mould in the warehouse and bringing it to the press.
9
IED
Making a shelf close to press and setting the molds in order (5S activity)
2
OED
7
2
Choosing the right screws, bolts and fasteners for the mould.
0
IED
0
IED
0
3
Stopping the press and waiting for its cooling down.
0
IED
0
IED
0
4
Removing of cooling pipes.
4
IED
Parallel Activity
0
IED
4
5
Unscrewing the two screws of old mould.
8
IED
Trying to use magnetic locks instead of the screws
2
IED
6
6
Removing the old mould with the hammer and the lever.
4
IED
4
IED
0
7
Putting the old mould on the hand track.
5
IED
5
IED
0
8
Carrying away the old mould.
5
IED
5
IED
0
9
Bringing the new mold closer.
4
IED
Putting the new mold close to the press when it is still working
0
OED
4
10
Installing new mold.
7
IED
Making the mold auto- centering.
2
IED
5
11
Regulating and centering the new mold.
6
IED
Making the mold auto- centering.
2
IED
4
12
Tightening screws at the right tightening torque.
6
IED
Trying to use magnetic locks instead of the screws
2
IED
4
13
Re-checking centering.
5
IED
Making the mold auto- centering.
0
IED
5
14
Fitting of cooling pipes.
5
IED
Parallel Activity
0
IED
5
15
Rejecting the first scraps
13
IED
13
IED
0
TOTAL
81
37
44
8. Overall Equipment Effectiveness Improvement…
www.theijes.com The IJES Page 8
ROOT CAUSE ANALYSIS FOR SHORT STOPPAGES It has been observed that there is time loss while machine is in operation due to short stoppages at different time interval. This lead to loss of speed of the machine thereby reduction in output and increase in job completion time. To find out the reasons for short stoppages, root cause analysis has carried out. This has been done by why why analysis technique as explained below.
WHY WHY ANALYSIS
o MACHINE STOP DUE TO SHORT STOPPAGES
WHY
o NOZZEL GET BLOCKED
WHY
o DUE TO DUST OR IMPURITIES PRESENT IN THE MATERIAL
WHY
o DUE TO MIXING OF WASTE (GRINDED) MATERIAL IN THE FRESH MATERIAL
Improvement Ideas for Short Stoppages With the aid of root cause analysis, team has found that the root cause for short stoppage was the presense of dust particle in the material which comes from waste material during grinding process. The team has observed that the average frequency of occurrence of nozzle blockage is 3 times in a day and it takes 20 minutes to clean the nozzle that is 60 minutes daily waste due to the above reasons. There is not only time loss but also the loss of speed leading to the poor performance of the machine.In order to avoid this, team has suggested to avoid the use of waste grinded material, but since it increases the material cost, it is recommended to keep spares nozzles in stock so that the blocked nozzle can be immediately replaced with spare nozzle thereby eliminating the nozzle cleaning time.
9. Overall Equipment Effectiveness Improvement…
www.theijes.com The IJES Page 9
IV. RESULTS, CONCLUSION, AND DISCUSSION
. Comparison between setup time before SMED and After SMED After the SMED technique was applied to the bottle neck Operation, the total time taken to perform the operation was decreased by 54 percent from 81 minutes to 37 minutes, thus the saving of 44 minutes has been achieved. The OEE of the machine increased from 62% to 64%. The Cost saving about Rs.1,02,000 per year is achieved by application of SMED Fig. 1.3 shows the Comparison of changeover time before and after SMED. Fig. 1.3 Fig. 1.3 Comparison between setup time before SMED and After SMED Also OEE has been improved from 62% to 65% with cost saving of Rs.1, 50,000 by finding the root cause of short stoppages and providing the solution to reduce the short stoppage time with the application of root cause analysis. Thus OEE has been improved by 2.0% with the application of SMED and 3.0% with the application of Root Cause Analysis and Overall Equipment Effectiveness of injection molding machine has been improved from 62% to 67% as shown in the Table 1.5 and Fig. No. 1.4 and total cost saving of Rs.2, 04,000 per annum as shown in the Table 1.6 Table 1.5 Comparison of OEE before and after Improvement
Loading Time (Min)
Available Production Time (Min)
Time Availability (%)
Performance Efficiency (%)
Rate of Quality (%)
OEE (%)
Before
20910
17090
82
77
98
62
After
20910
18277
87
79
98
67
Fig. 1.4 Comparison of OEE before and after Improvement
10. Overall Equipment Effectiveness Improvement…
www.theijes.com The IJES Page 10
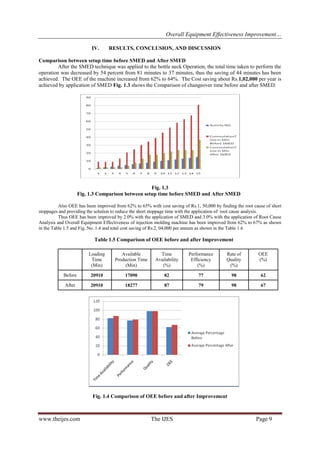
Table No. 1.6 TOTAL COST SAVING
COST SAVING BY SMED
Time saving in (hr) per job
0.7
Average job change over per month
24
Time saving in hr per month
17
Time saving in hr per year
204
M/c cost per Hour (Rs)
500
Total cost saving per year for job setup per m/c (Rs.)
1,02,000
COST SAVING BY RCA
Time saving in (min) per Stoppage
20
Time saving in (hr) per Stoppage
0.33
Average stoppage per month
76
Time saving in hr per month
25
Time saving in hr per year
300
M/c cost per Hour (Rs)
500
Total cost saving per year per m/c (Rs.)
1,50,000
Project Investment Cost
48,000
TOTAL COST SAVING
2,04,000
CONCLUSION This case study carried out in M/s. Narke Electricals Pvt. Limited a plastic products manufacturing company has demonstrated how a Lean Six Sigma project can improve the OEE performance of a injection molding machine for plastic components in a relevant way. The project has been carried out in accordance with the results of the literature review. The performance of 67% OEE was attained with an increase of 5 % in OEE which would represent annual earnings of Rs.2.04 lakhs. To achieve this target, better communication and team- work was promoted. The following points have given competitive advantage to the company as, OEE parameters were focused with systematic approaches. Availability, Performance and Quality are the three focused parameters. Availability was improved from 82% to 87 %, Performance was improved from 77 % to 79 % and Quality was sustained at 98 %. To increase the OEE all the three parameters had to be increased individually. 5S was implemented in the cell layout. Due to increase in OEE the production rates and the delivery time was improved. Approximately around Rs.2.04 lakhs per annum was saved due to increase of OEE. REFERENCES
[1]. Harsha G. Hegde and N. S. Mahesh, Kishan Doss. “Overall Equipment Effectiveness Improvement by TPM and 5S Techniques in a CNC Machine.”
[2]. Mr. Rahul.R.Joshi and Prof.G.R.Naik. “A Case Study in Small Scale Industry.”
[3]. E. Sivaselvam an S. Gajendran. “Improvement of Overall Equipment Effectiveness in a Plastic Injection Moulding Industry.”
[4]. Halim Mad Lazim, T. Ramayah and Norzieiriani Ahmad “Total Productive Maintenance And Performance: A Malaysian SME Experience, International Review of Business Research Papers.” Vol. 4 No. 4 Aug – Sept 2008 Pp.237-250
[5]. Improvement of OEE performance using a Lean Six Sigma approach: an Italian manufacturing case study.
[6]. Ralph M. Barnes. “Motion and Time study Design and measurement of work.”