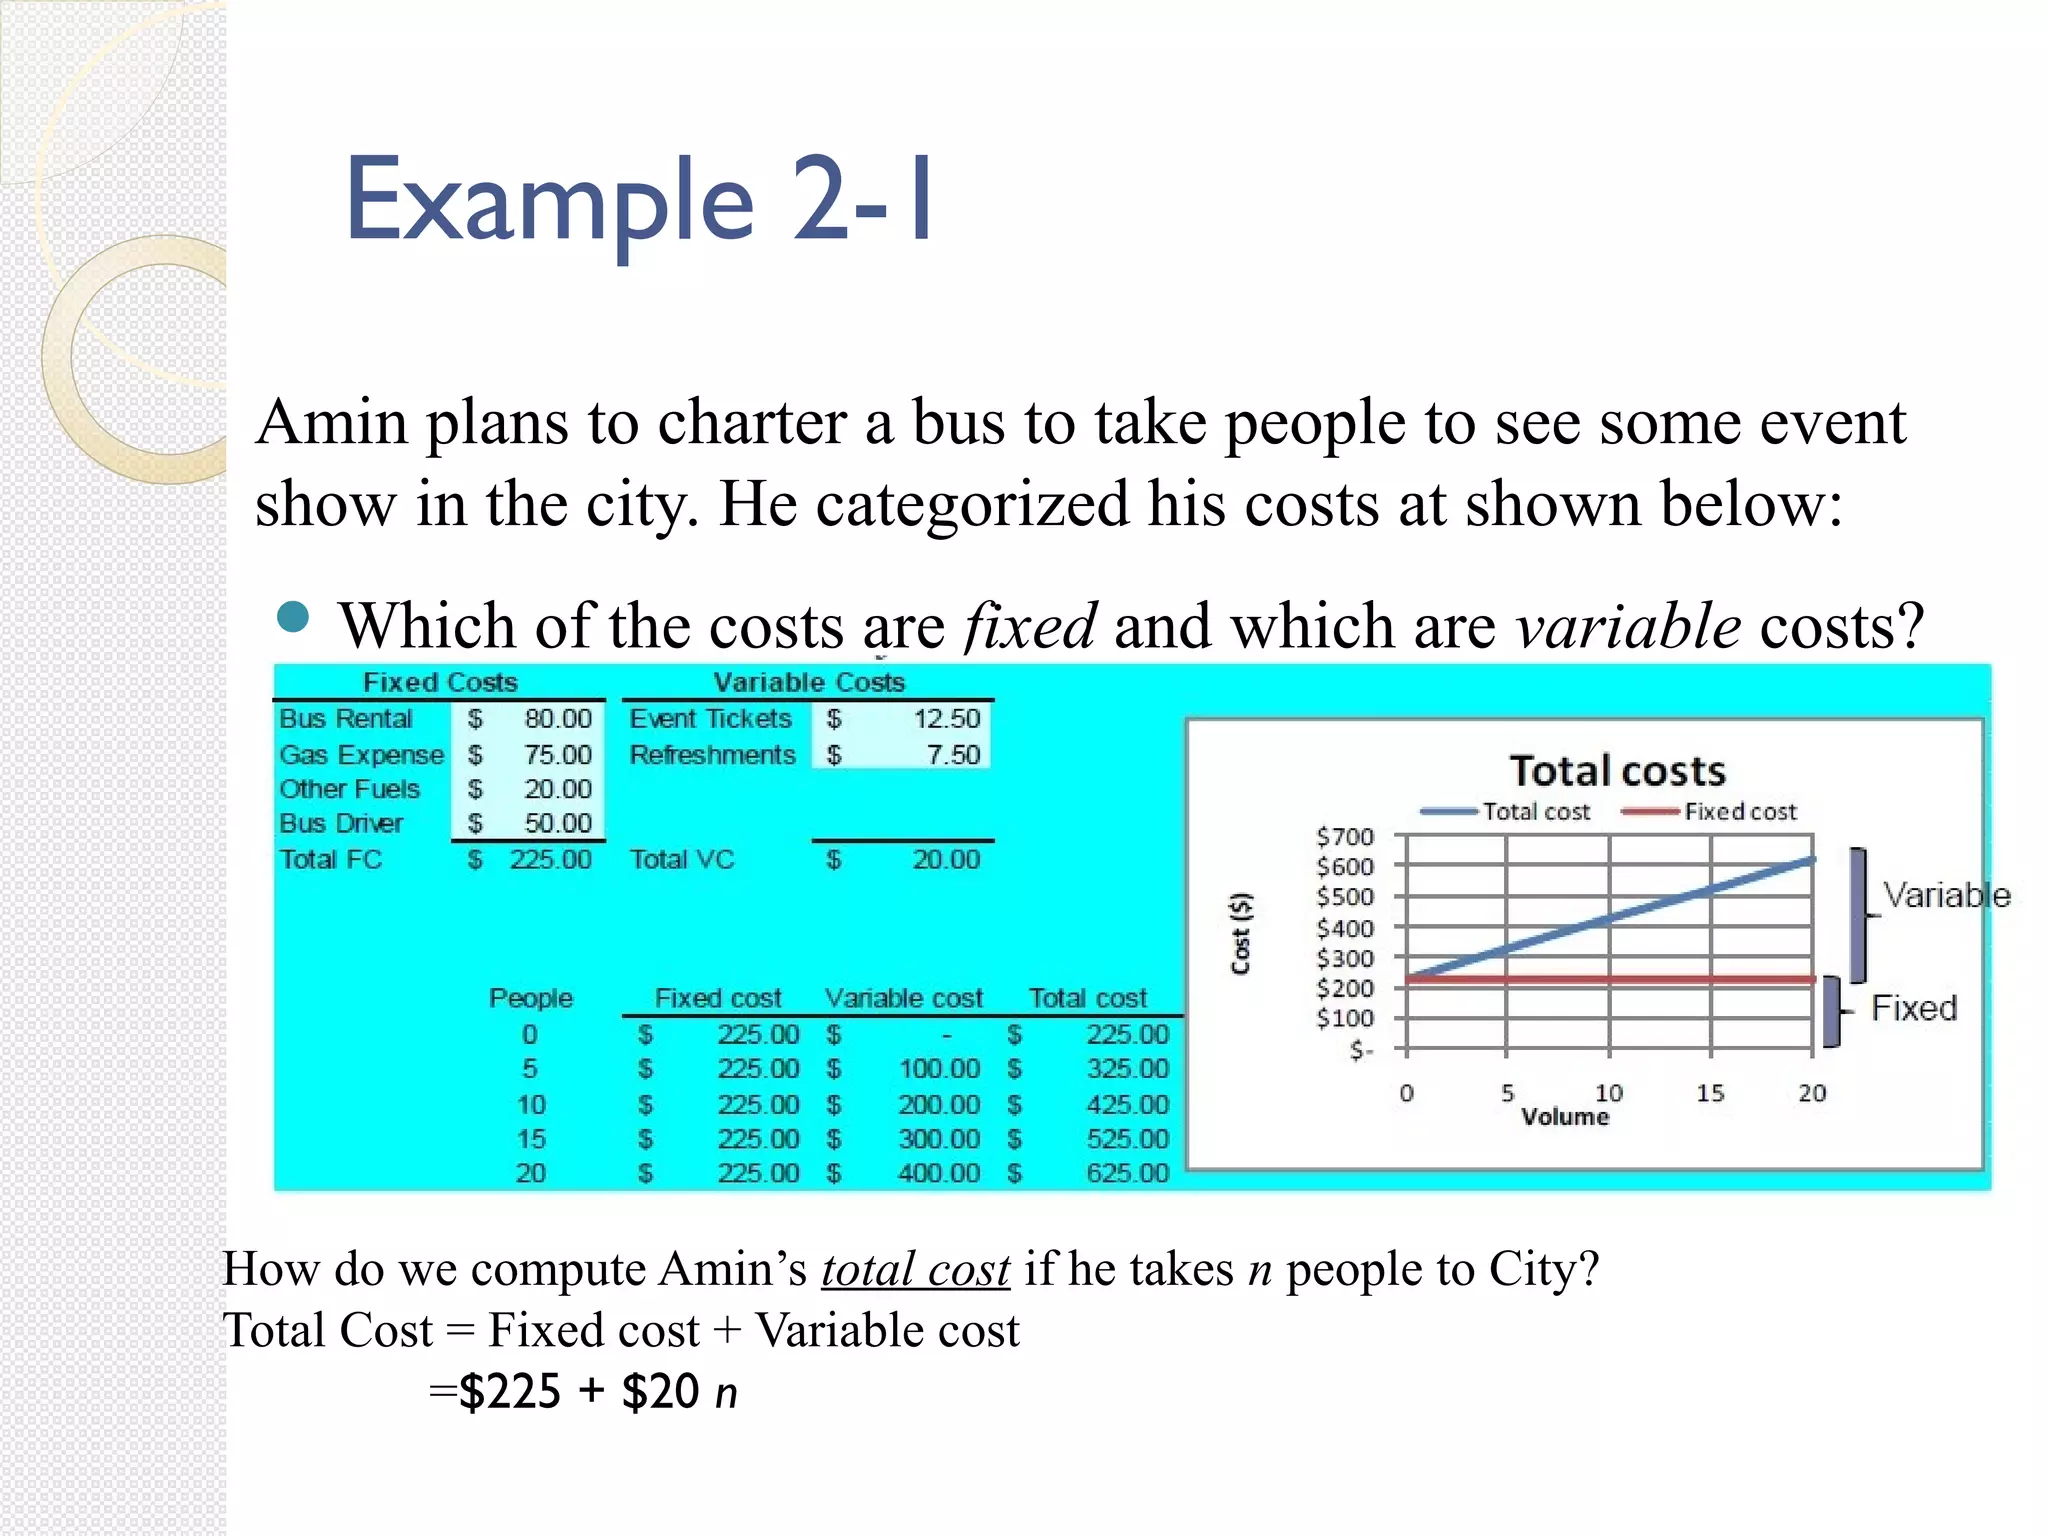
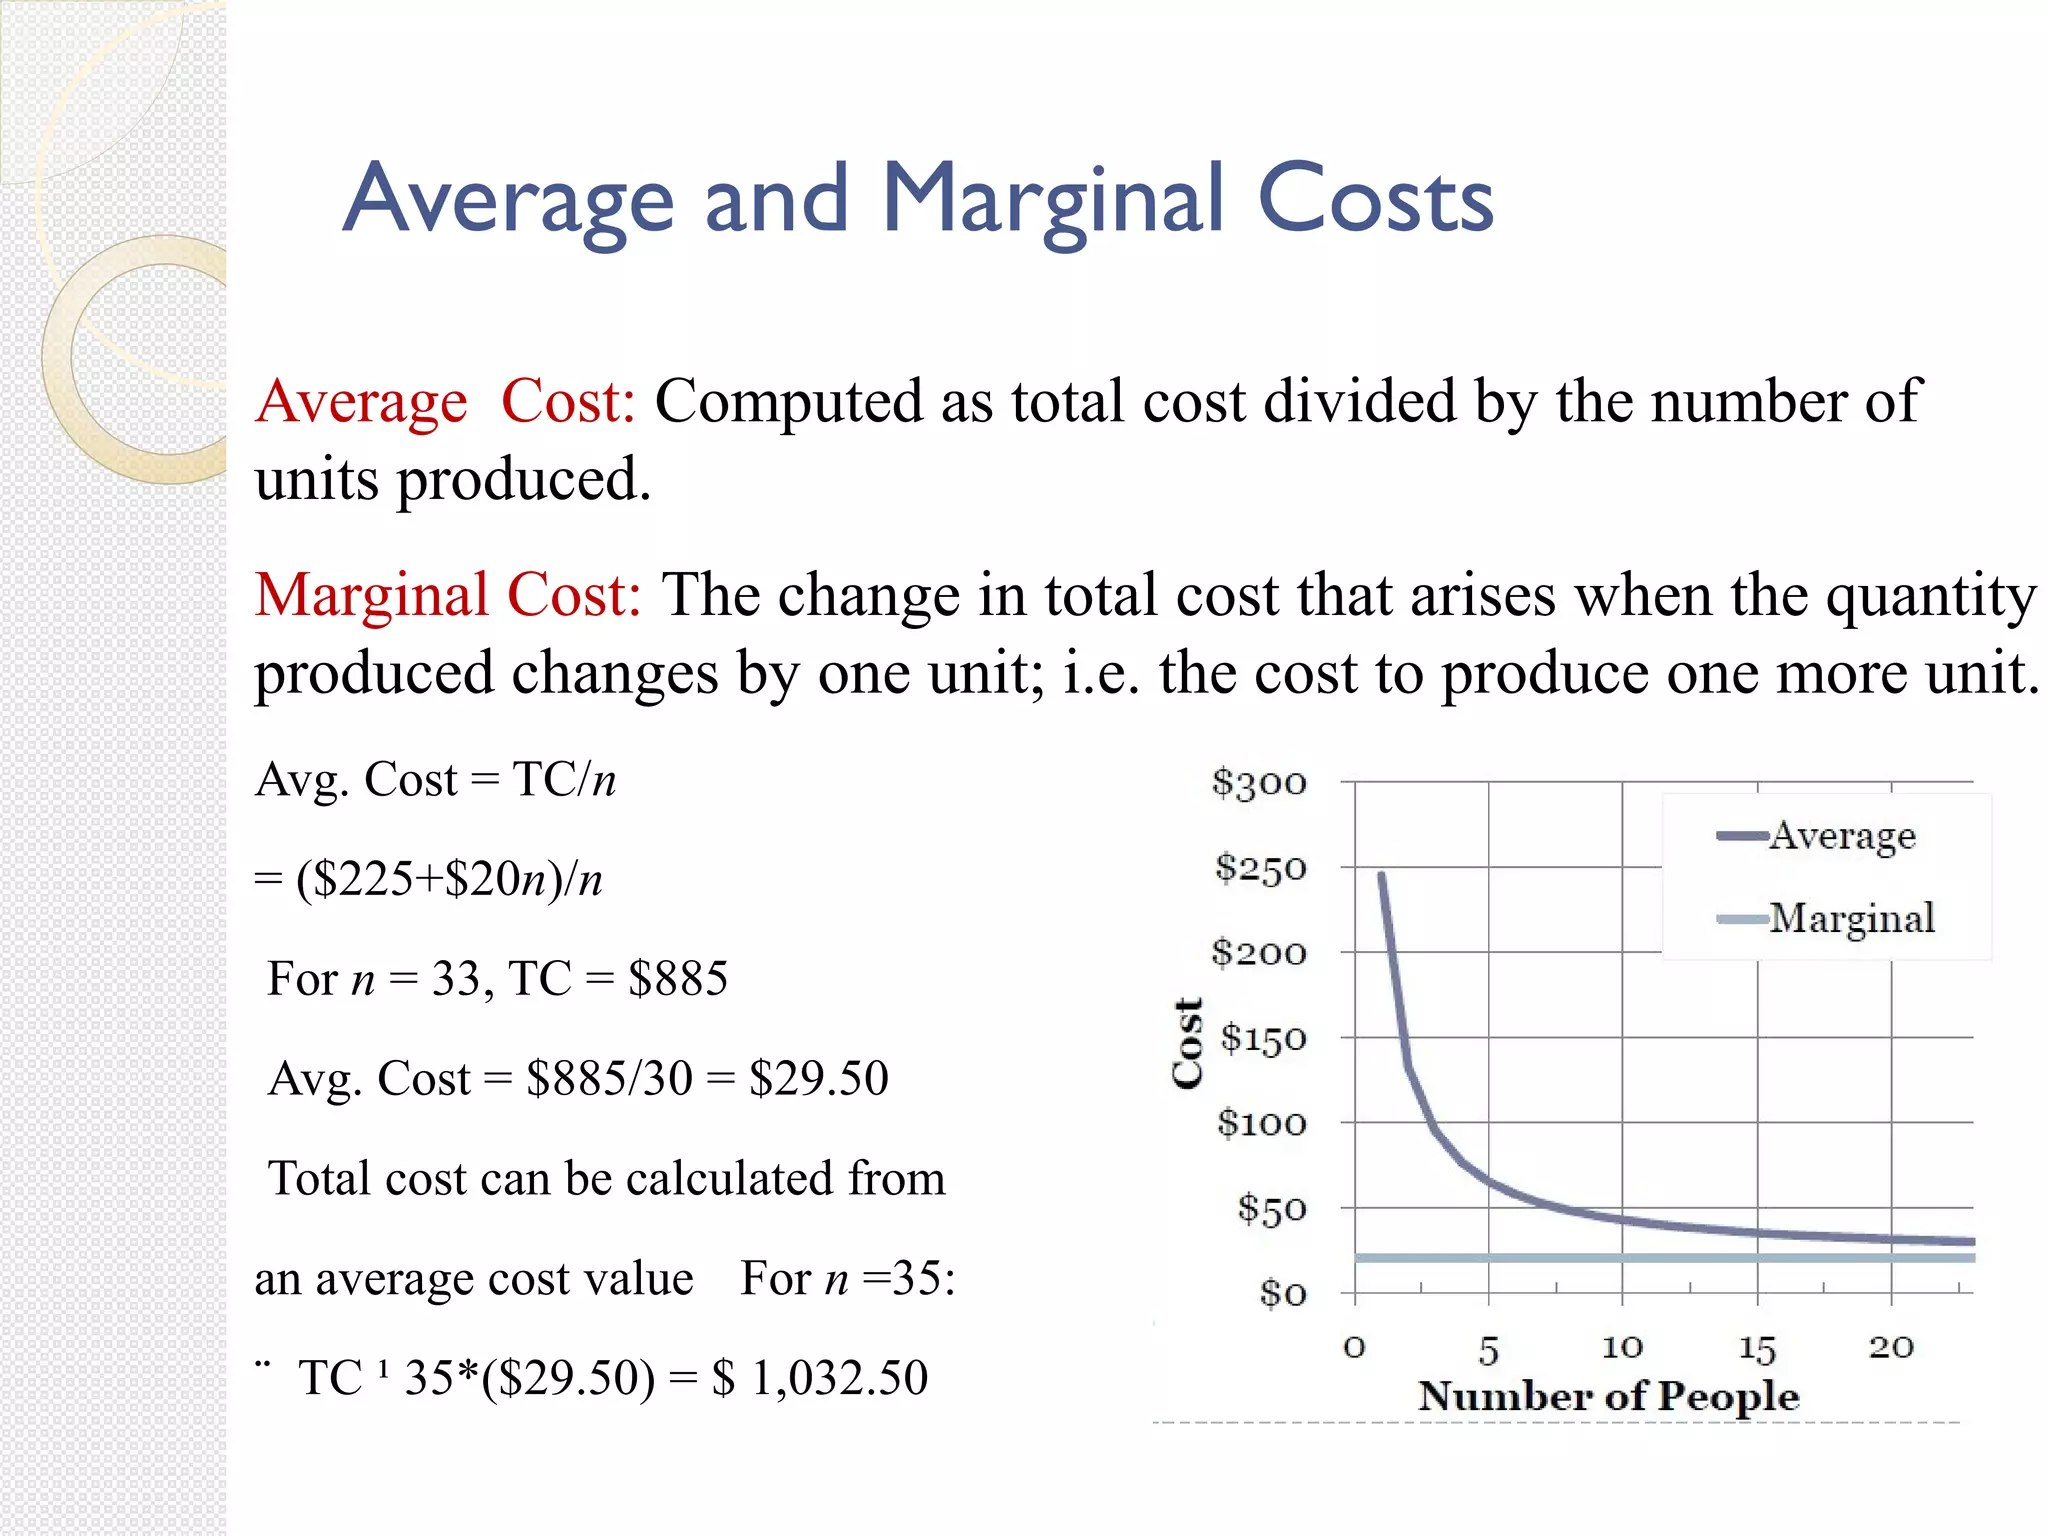
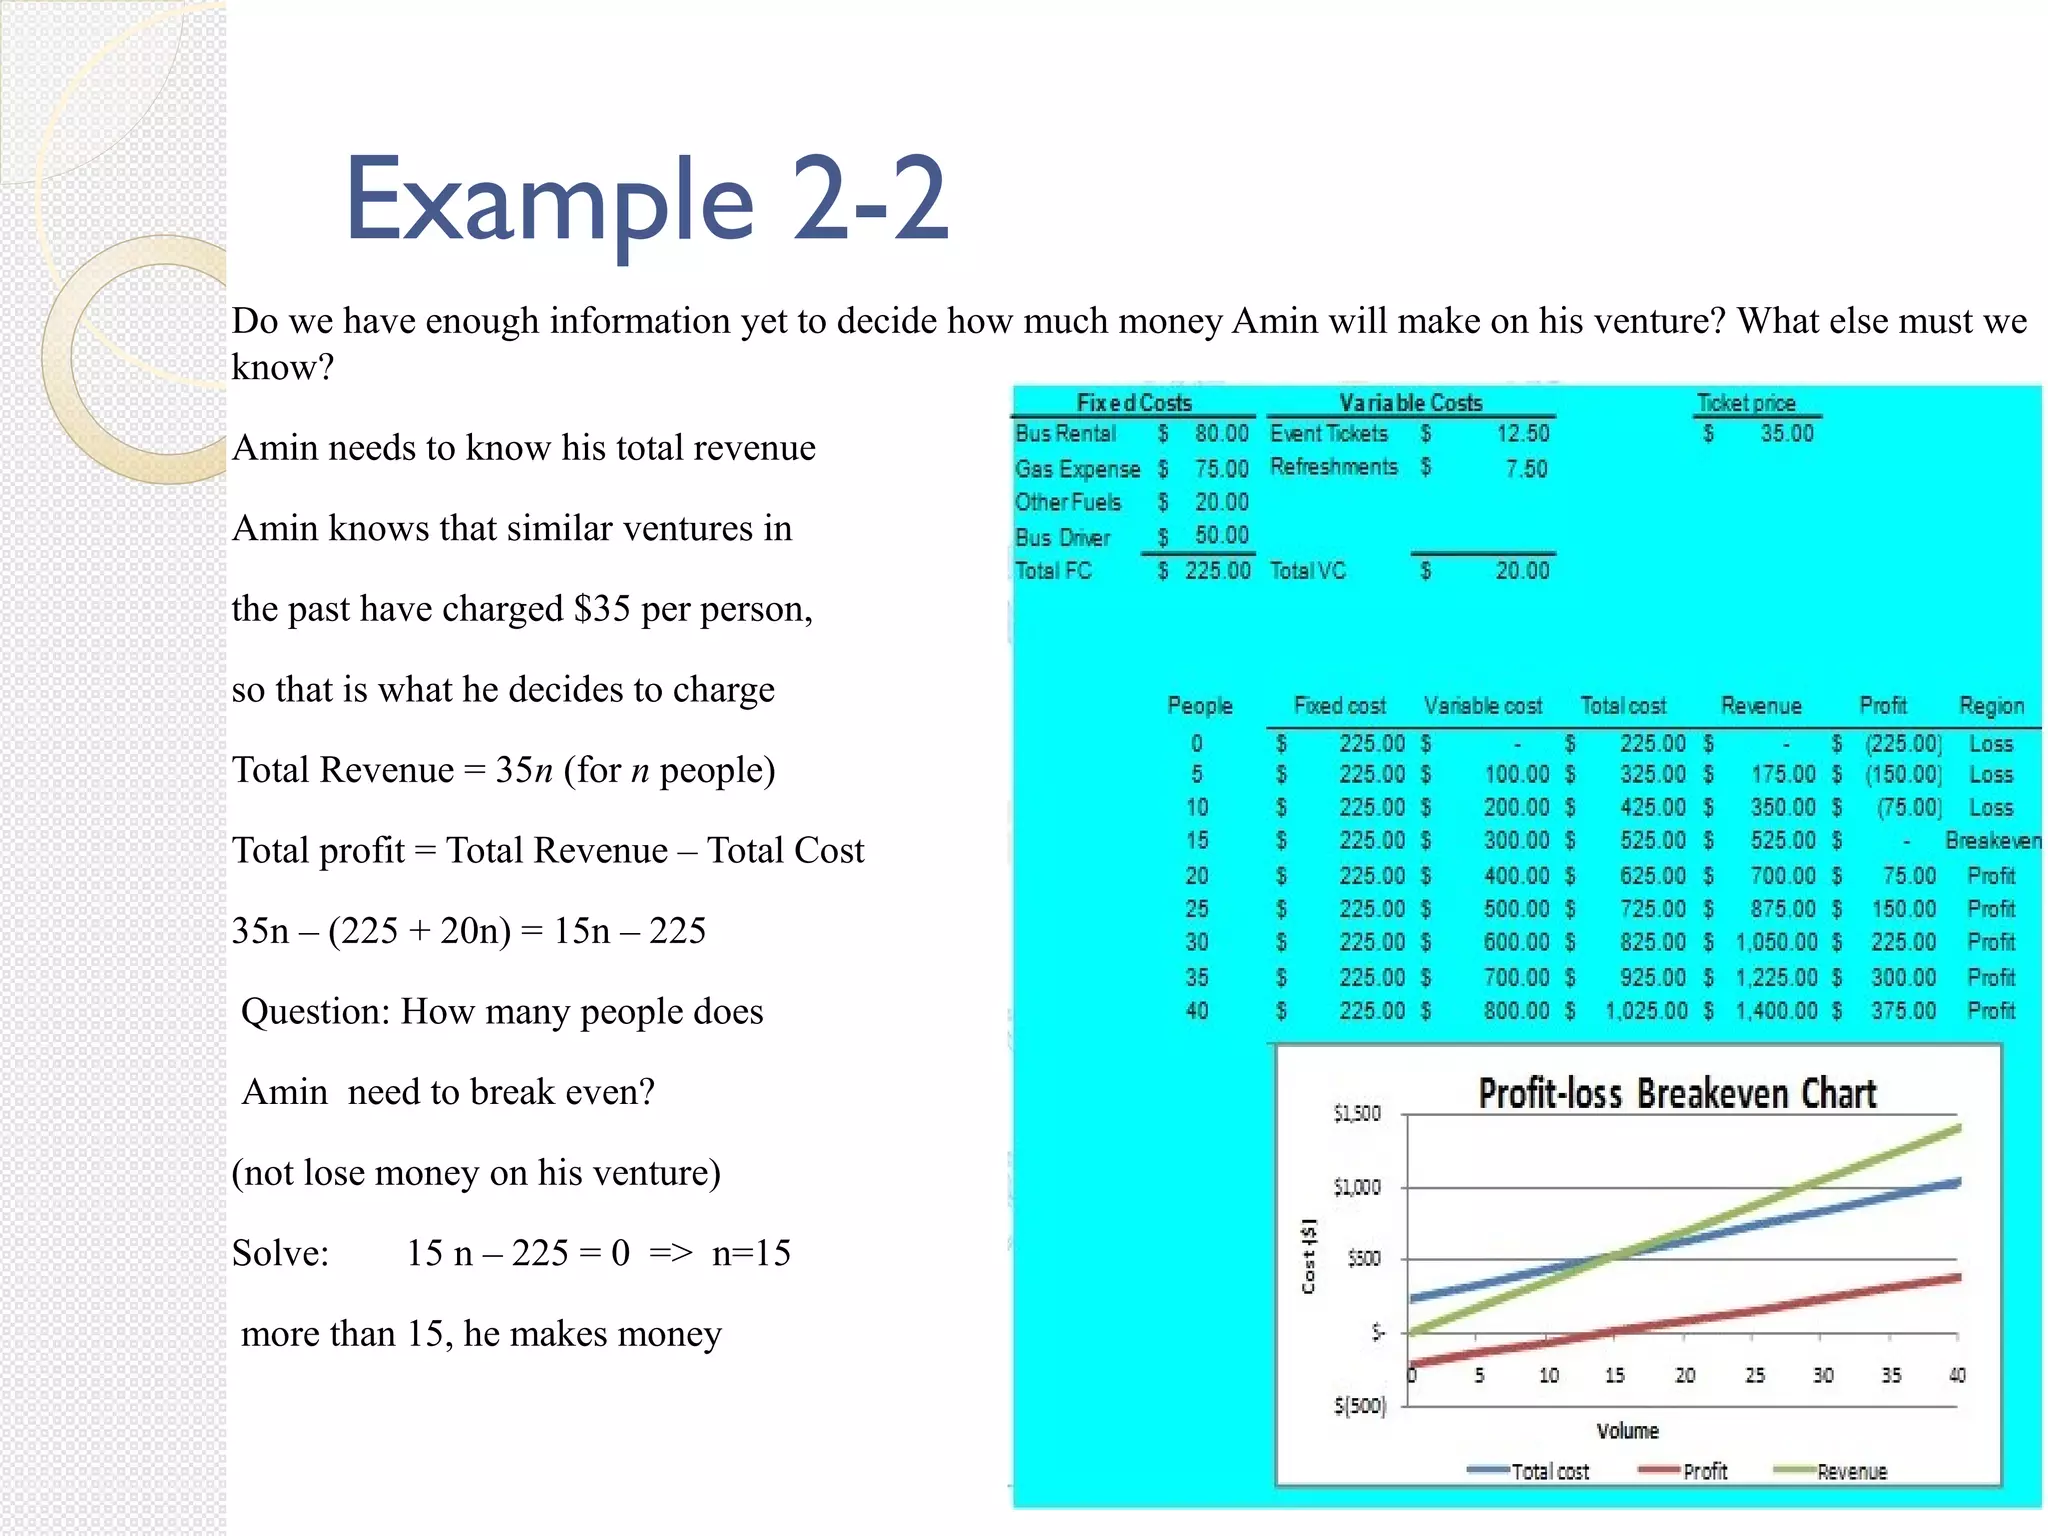
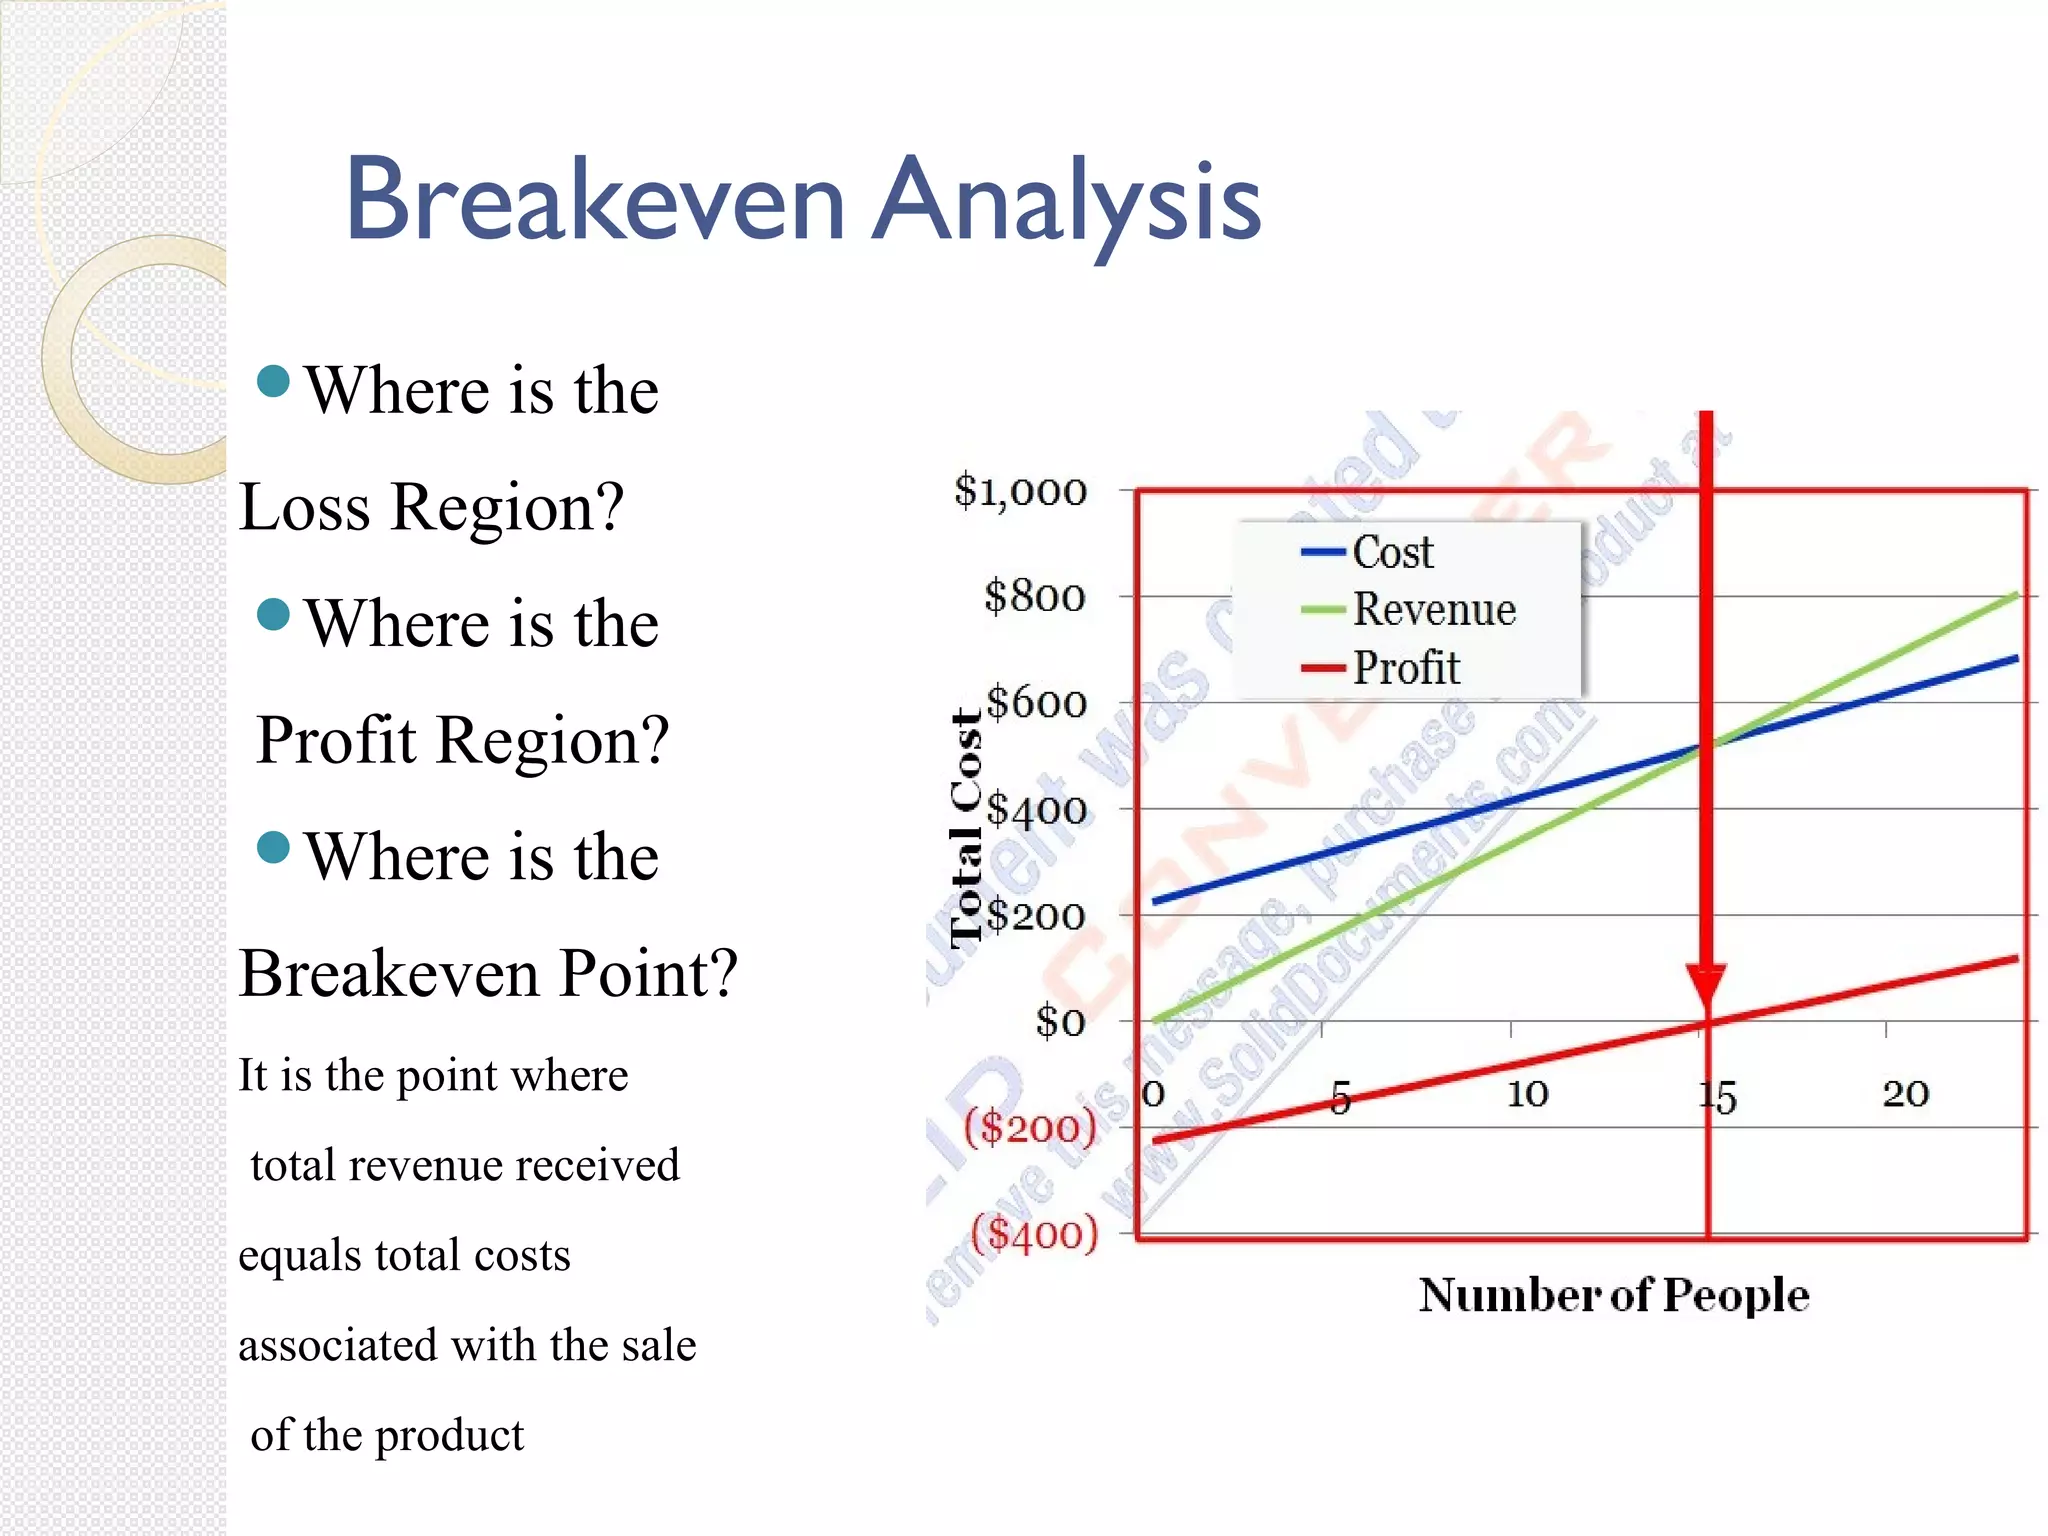
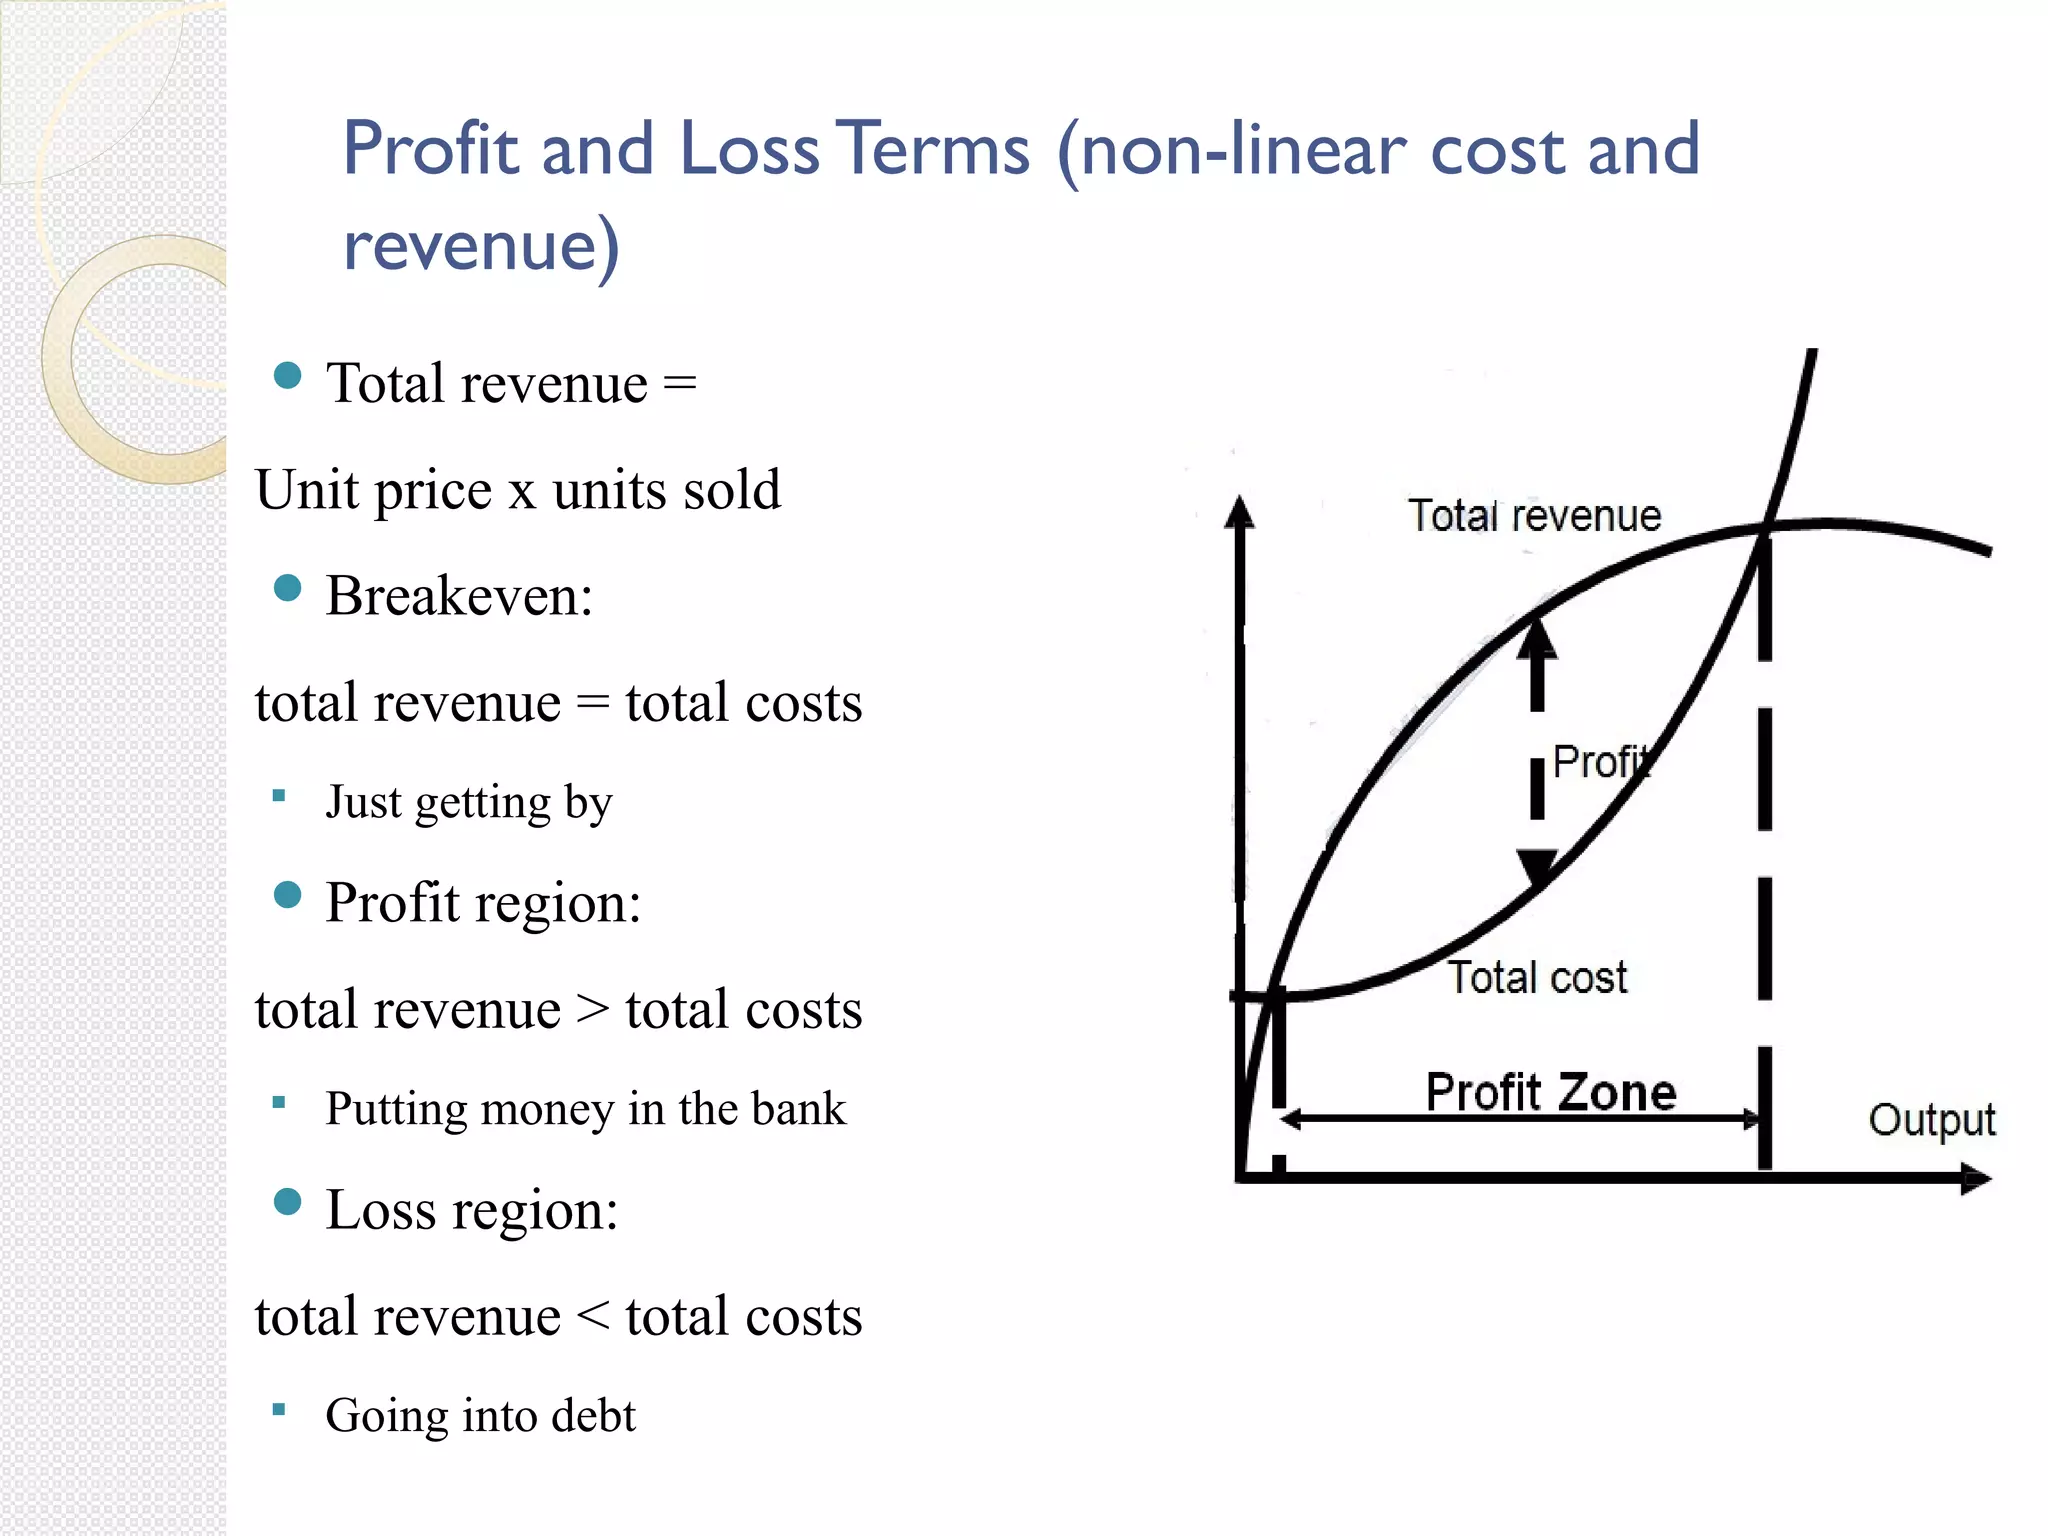
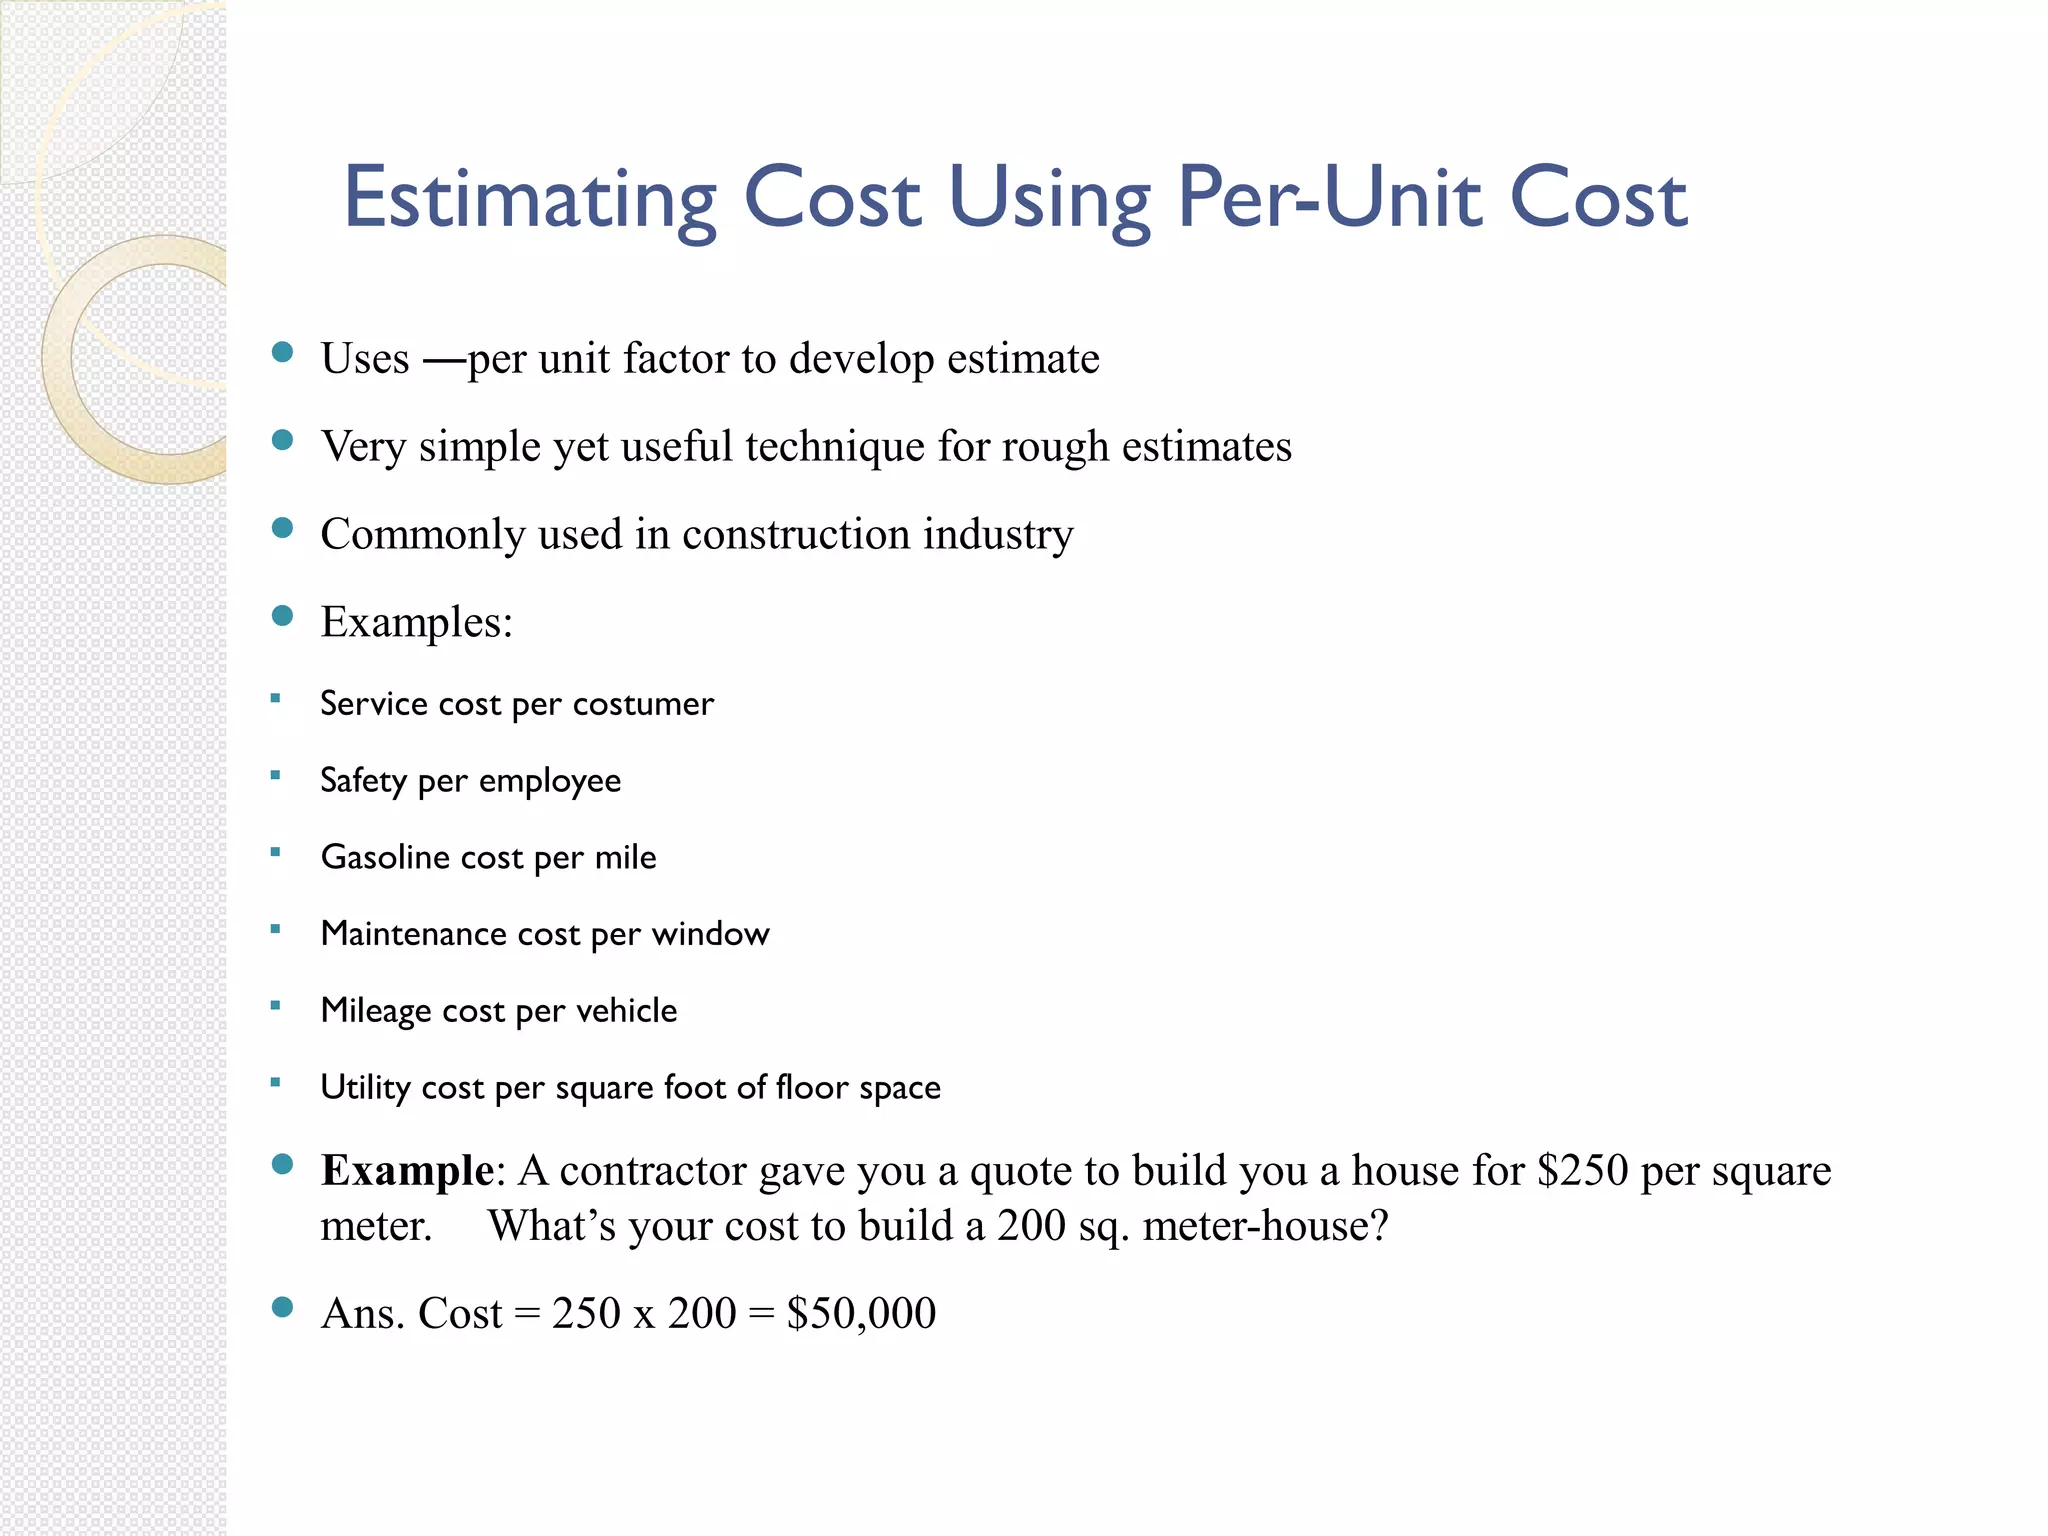
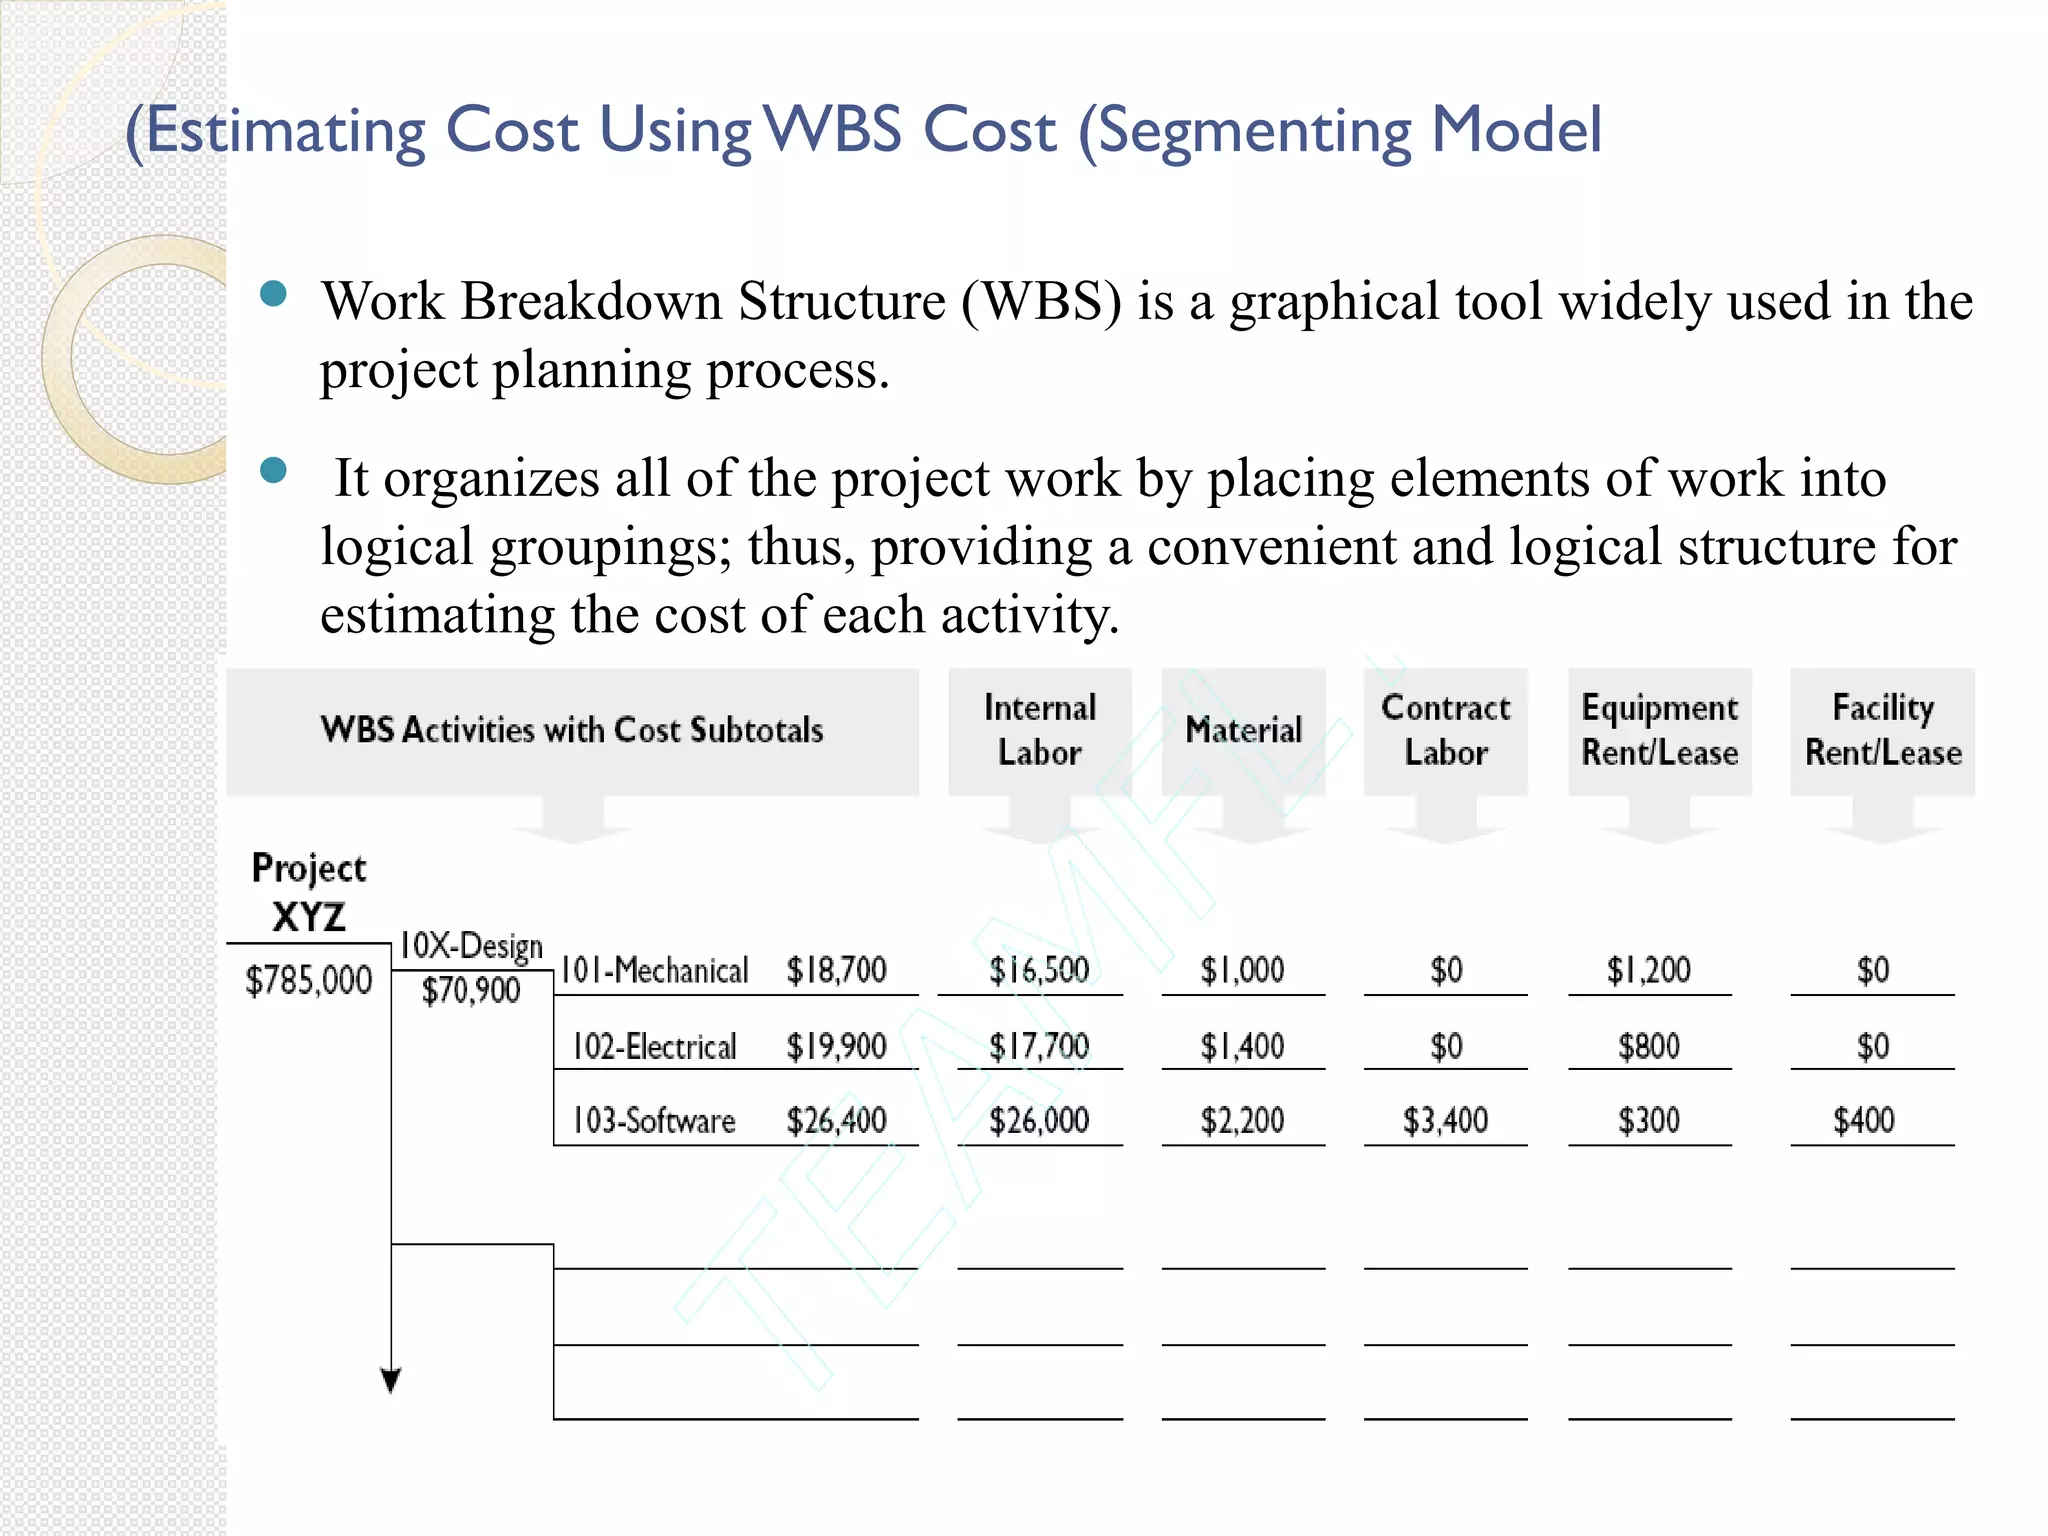
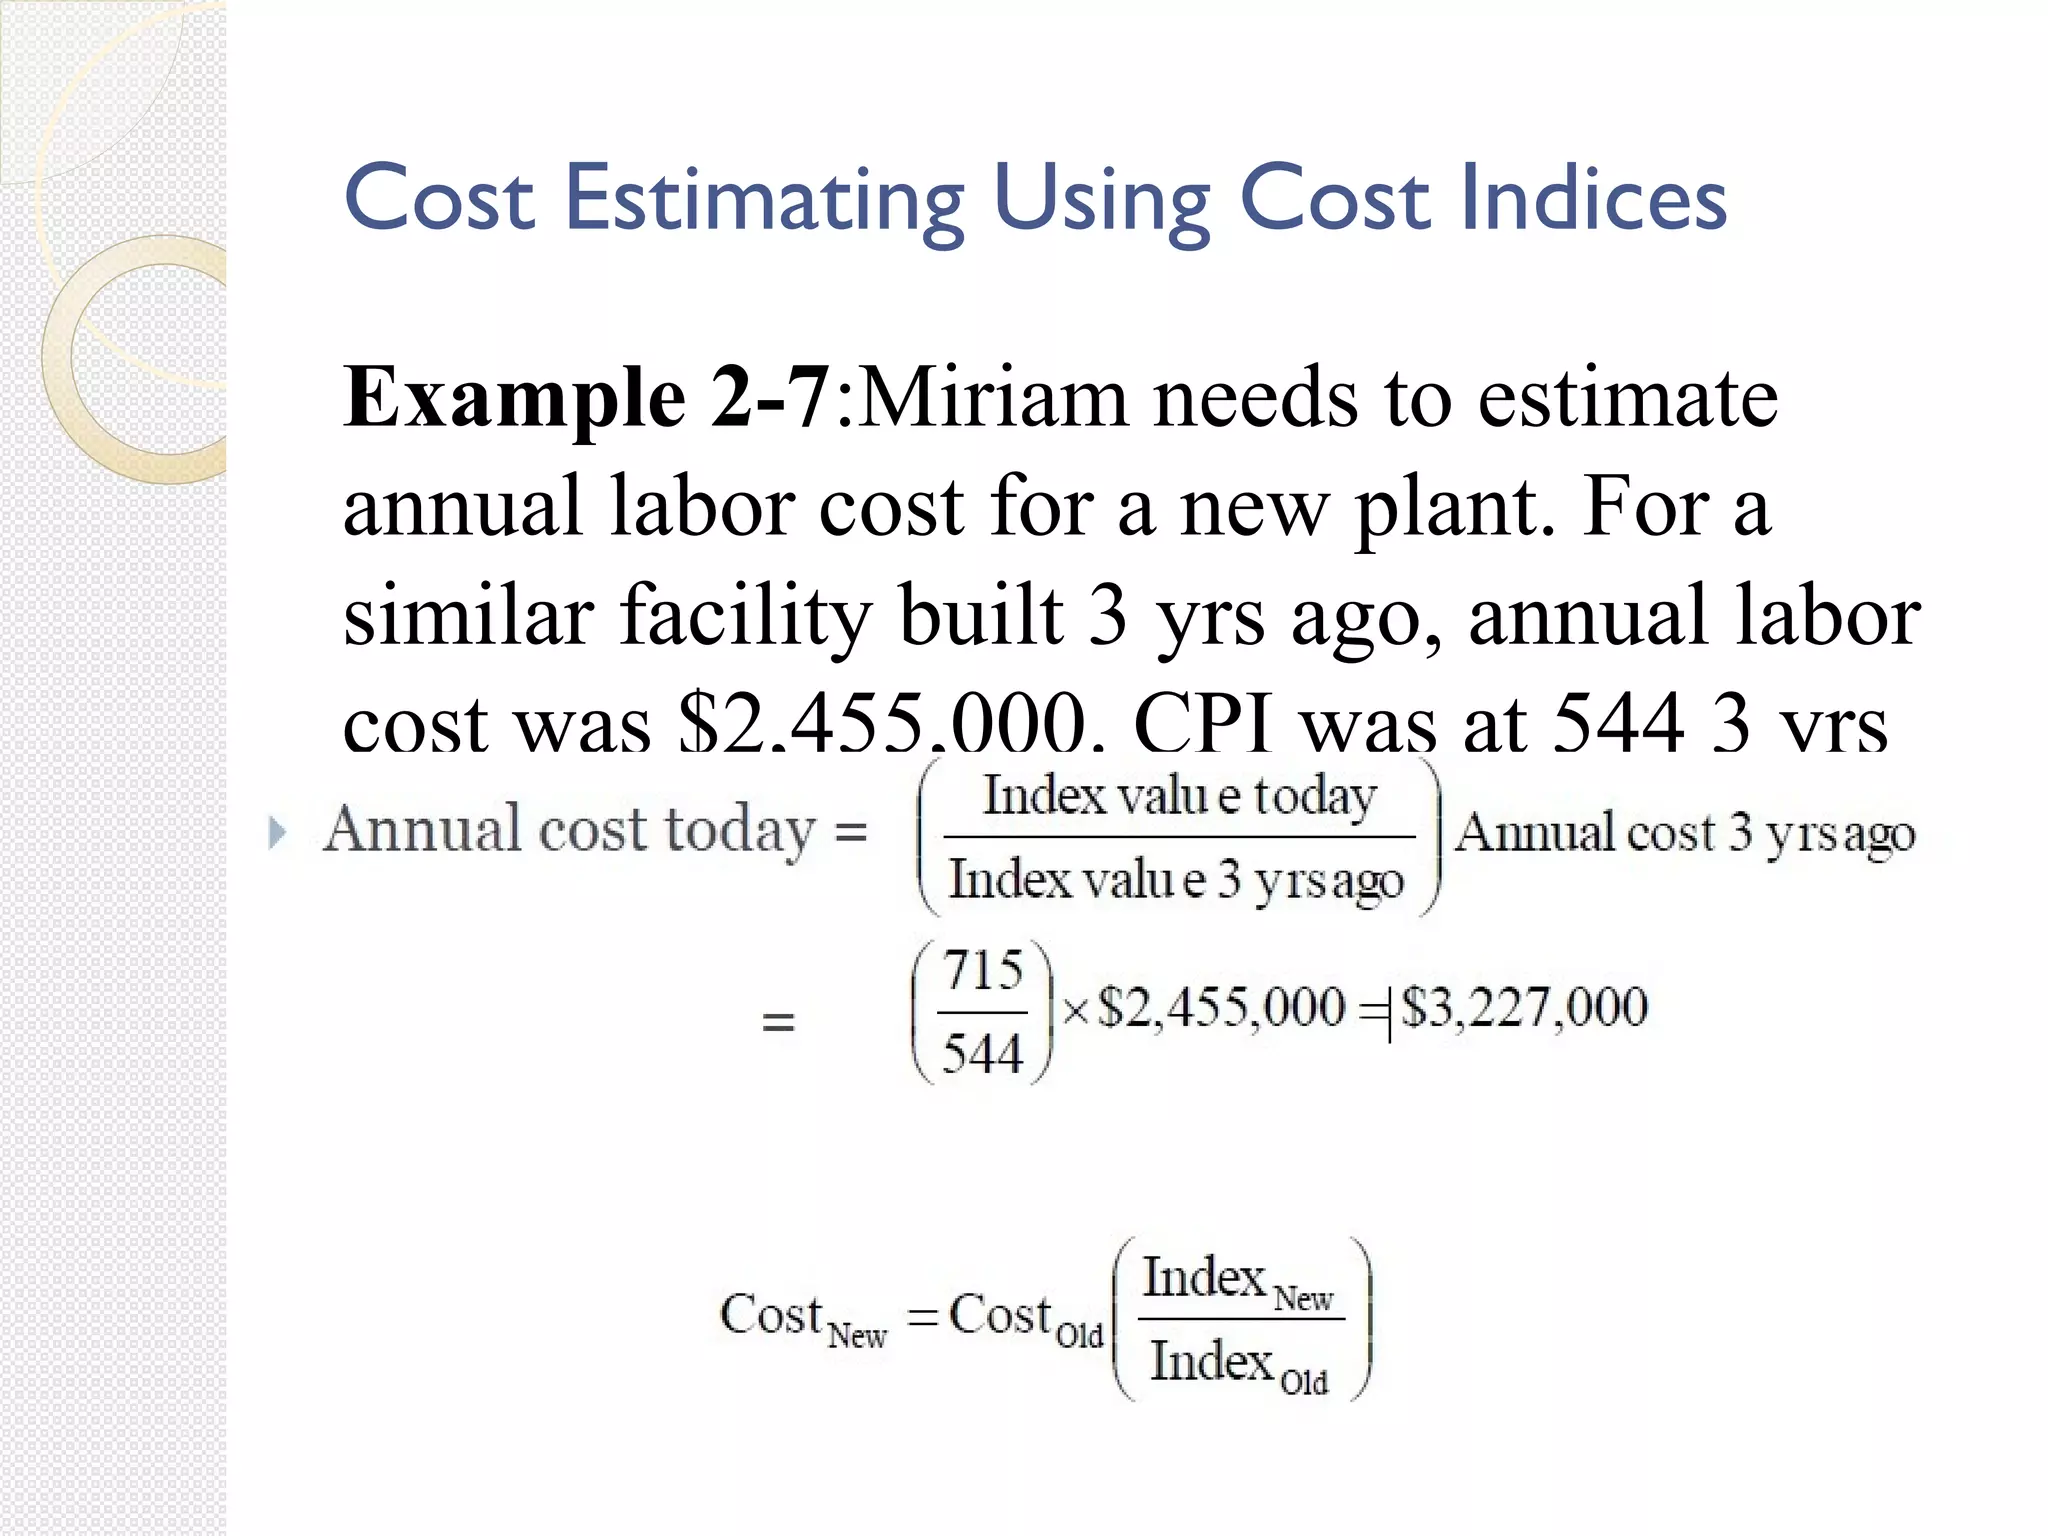
SlideShare a Scribd company logo
Engineering Costs and Cost Estimating
Cost Types:
Fixed and Variable
Direct and Indirect
Marginal and Average
Sunk and Opportunity
Recurring and Non- Recurring
Incremental
Cash and Book
Life-Cycle
Engineering Costs and Cost Estimating
Estimating Costs:
Per-Unit Model
WBS Model
Cost Indices
Estimating Benefits
Cash Flow Diagrams
Cost Types
Engineering Costs and Cost Estimating
Engineering Costs: Value of the economic resources used in the
production of goods and services.
Examples: Land, labor, capital or initial investment, wages and
salaries, material purchases, utilities
Cost estimating: Approximating the cost of resources or activities
Cost estimating is necessary for any economic analysis
Key Question: Where do the numbers we use in an engineering
economic analysis come from?
When working in industry, you may need to consult with
professional accountants to obtain such information
Classification of Costs
Fixed Costs:
Costs that do not vary (i.e., constant and unchanging regardless of the level of the
activity.
Variable Costs:
Costs that vary in total with the quantity of output or other measures of activity level.
 Total Cost is the sum of Fixed Cost and Variable Cost.
Direct Costs:
Cost that can be reasonably measured and allocated to a specific output or work activity.
Indirect/Overhead Cost:
Cost that it is difficult to attribute or allocate to a specific output or work activity.
Example 2-1
Amin plans to charter a bus to take people to see some event
show in the city. He categorized his costs at shown below:
 Which of the costs are fixed and which are variable costs?
How do we compute Amin’s total cost if he takes n people to City?
Total Cost = Fixed cost + Variable cost
=$225 + $20 n
Average and Marginal Costs
Average Cost: Computed as total cost divided by the number of
units produced.
Marginal Cost: The change in total cost that arises when the quantity
produced changes by one unit; i.e. the cost to produce one more unit.
Avg. Cost = TC/n
= ($225+$20n)/n
For n = 33, TC = $885
Avg. Cost = $885/30 = $29.50
Total cost can be calculated from
an average cost value For n =35:
¨ TC ¹ 35*($29.50) = $ 1,032.50
Example 2-2
Do we have enough information yet to decide how much money Amin will make on his venture? What else must we
know?
Amin needs to know his total revenue
Amin knows that similar ventures in
the past have charged $35 per person,
so that is what he decides to charge
Total Revenue = 35n (for n people)
Total profit = Total Revenue – Total Cost
35n – (225 + 20n) = 15n – 225
Question: How many people does
Amin need to break even?
(not lose money on his venture)
Solve: 15 n – 225 = 0 => n=15
more than 15, he makes money
Breakeven Analysis
Where is the
Loss Region?
Where is the
Profit Region?
Where is the
Breakeven Point?
It is the point where
total revenue received
equals total costs
associated with the sale
of the product
Profit and Loss Terms (non-linear cost and
revenue)
 Total revenue =
Unit price x units sold
 Breakeven:
total revenue = total costs
 Just getting by
 Profit region:
total revenue > total costs
 Putting money in the bank
 Loss region:
total revenue < total costs
 Going into debt
Sunk (Past) Costs
 A sunk cost is money already spent due to a past decision.
 As engineering economists we deal with present and future opportunities
 We must be careful not to be influenced by the past
 Disregard sunk costs in engineering economic analysis
 Example: Suppose that three years ago you bought a laptop PC for $2,000.
 How likely is it that you can sell it today for what it cost?
 Suppose you can sell the laptop today for $400. Does the
$2000 purchase cost have any effect on the selling price today?
 The $2,000 is a sunk cost. It has no influence on the
present opportunity to sell the laptop for $400.
Opportunity (Future) Cost
 An opportunity cost is a benefit that is foregone by engaging a
business resource in a chosen activity instead of engaging that same
resource in the foregone activity.
 Example: Suppose your wealthy uncle gives you
$75,000 when you graduate from high school. It is enough to put you through
college (5 years at $15,000 per year). It is also enough for you to open a
business making web pages for small companies instead of going to
college. You estimate you would make $20,000 per year with this business.
 If you decide to go to college you give up the opportunity to
make $20,000 per year
 Your opportunity cost is $20,000
 Your total cost per year is $35,000
Recurring and Non-Recurring Costs
 Recurring costs are those expenses that are known, anticipated, and occur at regular intervals.
 These costs can be modeled as cash flows.
 Non-recurring costs are one-of-a-kind (one-time) event that
occurs at irregular intervals.
 They are difficult to plan for or anticipate.
 Example: A company decided to landscape a lot of ground and then care for it. Which are recurring and
which are non-recurring costs the company incur?
 Remove existing trees, vegetation
 Have land graded with bulldozer
 Have yard planted with grass
 Plant shrubs, trees
 Mow grass
 Fertilize grass, shrubs
 Water grass, shrubs
Incremental Cost
Incremental Cost is the additional cost
that results from selecting one alternative
over another.
It is the difference in cost between two
alternative investments or activities.
Example
Solution
Let's look more closely at each of the data items.
Distributor's purchase price 3 years ago: This is a
sunk cost that should not be considered in setting the
price today.
Distributor's storage costs to date: The storage costs
for keeping the pumps in inventory are sunk costs; that
is, they have been paid. Hence they should not
influence the pricing decision.
Solution
Distributor's list price 3 years ago: If there have been no willing buyers in the
past 3 years at this price, it is unlikely that a buyer will emerge in the future.
This past list price should have no influence on the current pricing decision.
Current list price of newer pumps: Newer pumps now include technology and
features that have made the older pumps less valuable. Directly comparing
the older pumps to those with new technology is misleading. However, the
price of the new pumps and the value of the new features help determine the
market value of the old pumps.
Solution
Amount offered from a buyer 2 years ago: This is a forgone opportunity. At
the time of
the offer, the company chose to keep the lot and thus the $5000 offered
became an
opportunity cost for keeping the pumps. This amount should not influence
the current
pricing decision.
Current price the lot could bring: The price a willing buyer in the
marketplace offers is
called the asset's market value. The lot of old pumps in question is believed
to have a
current market value of $3000.
Cash Costs vs. Book Costs
Cash Costs: require the cash transaction of dollars out of
one person’s pocket into the pocket of someone else.
Book Costs: cost of a past transaction that is recorded in a
book (accounting book) of a firm.
 Do not represent cash flows
 Not included in engineering economic analysis
 One exception is for asset depreciation (used for tax purposes)
Example: You got offers to sell your car for $6,000 (i.e., the book value of your car
is $6,000). The book value can be thought of as the book cost. If you actually sell
the car to a friend for $5,500, then the cash cost to your friend is
$5,500.
Life-Cycle Costs
 Life-cycle Costs are the summation of all costs, both recurring and nonrecurring,
related to a product, structure, system, or service during its lifetime.
 Products go through a life cycle in phases:
1. Assessment & Justification
2. Conceptual or Preliminary Design
3. Detailed Design
4. Production or Construction
5. Operational Use
6. Decline and Retirement
 Engineers should consider all life-cycle costs when designing
products and the systems that produce them.
 About 70-90% of all costs are set during the design phases when only 10-30% of
cumulative life-cycle costs have been spent.
Cost Estimation
Cost Estimating
Engineering economic analysis is future based.
Future consequences (costs and benefits) of current decisions and require estimating.
Estimated costs and benefits are not known with certainty.
 The more accurate the estimate, the more reliable the decision.
 Difficulties arise due to an uncertain future.
Types of estimates:
 Rough: gut level; Inaccurate; -30% to +60%.
 Semi-detailed: based on historical records; Reasonably sophisticated and accurate; -15%
to +20%.
 Detailed: based on specifications and cost models; Very accurate; -3% to +5%.
 One-of-a-kind or first time projects: Few such projects in engineering economic analysis.
Estimator experience and knowledge è better quality (and more reliable)
estimates.
Estimating Cost Using Per-Unit Cost
 Uses ―per unit factor to develop estimate
 Very simple yet useful technique for rough estimates
 Commonly used in construction industry
 Examples:
 Service cost per costumer
 Safety per employee
 Gasoline cost per mile
 Maintenance cost per window
 Mileage cost per vehicle
 Utility cost per square foot of floor space
 Example: A contractor gave you a quote to build you a house for $250 per square
meter. What’s your cost to build a 200 sq. meter-house?
 Ans. Cost = 250 x 200 = $50,000
(Estimating Cost Using WBS Cost (Segmenting Model
 Work Breakdown Structure (WBS) is a graphical tool widely used in the
project planning process.
 It organizes all of the project work by placing elements of work into
logical groupings; thus, providing a convenient and logical structure for
estimating the cost of each activity.
Cost Estimating Using Cost Indices
Governments usually publish cost index data for labor,
construction, and materials.
The best-known example is the consumer price index (CPI), a
measure of inflation.
 The measure is scaled, so it is only the relative values of any two
measures that are meaningful.
 For example, in 1920, the measure was about 20; in 1997 it was
about 160. The conclusion is that one would have to spend 160/20,
or 8 times as much in 1997 as in 1920 for the same consumables.
Cost indices work in the same way as price indices.
Cost indices are dimensionless.
Cost Estimating Using Cost Indices
Example 2-7:Miriam needs to estimate
annual labor cost for a new plant. For a
similar facility built 3 yrs ago, annual labor
cost was $2,455,000. CPI was at 544 3 yrs
ago but it is 715 today.
Estimating Benefits
For the most part, we can use exactly the same app
roach to estimate benefits as to estimate costs:
 Fixed and variable benefits
 Recurring and non-recurring benefits
 Incremental benefits
 Life-cycle benefits
 Rough, semi-detailed, and detailed benefit estimates
 Difficulties in estimation
 Segmentation and index models
Major differences between benefit and cost estimation:
 Costs are more likely to be underestimated
 Benefits are most likely to be overestimated
 Benefits tend to occur further in the future than costs
Cash Flow Diagram
Cash Flow Diagrams
 A Cash Flow Diagram (CFD) summarizes the costs and benefits of a project
 It illustrates the size, sign, and timing of individual cash flows
 The time line is a horizontal line divided into equal periods such as days, months, or
years.
 The end of one period is the beginning of the next one.
 Each cash flow, such as a payment or receipt, is plotted along this line at the beginning
or end of the period in which it occurs.
 Arrows: usual interpretation is positive (upward) for cash inflows (revenues) and
negative (Downward) for cash outflows (expenses).
 Length of the arrow represents the magnitude ($) of the cash flow.
 It is essential to use only one perspective in any CFD.
 One person’s payment (cash outflow with – sign) is another
person’s receipt (cash inflow with + sign)
CFD Example
Categories of Cash Flows
1. First cost ≡ construction, purchase, or installation expense.
2. Operations and maintenance ≡ annual expense.
3. Salvage value ≡ receipt at project termination.
4. Revenues ≡ annual receipts due to sale of products.
5. Overhaul ≡ major capital expenditure occurring during life of
asset.
A concrete aggregate mix is required to contain at least 31% sand by
volume for proper batching. One source of material, which has 25%
sand and 75% coarse aggregate, sells for $3 per cubic meter (m3).
Another source, which has 40% sand and 60% coarse aggregate, sells
for $4.4/m3.
Determine the least cost per cubic meter of blended aggregates.
Example:
 The least cost of blended aggregates will result from maximum use of the
lower-cost material. The higher-cost material will be used to increase the
proportion of sand up to the minimum level (31%) specified. ..
Let x = Portion of blended aggregates from $3.00/m3 source
1 - x =Portion of blended aggregates from $4.40/m3 source
Sand Balance
 x(0.25) + (1 -x) (0.40) = 0.31
 0.25x + 0.40- 0.04x =0.31 =0.60
 Thus the blended aggregates will contain
 60% of $3.00/m3 material
 40% of $4.40/m3 material
Solution
 The least cost per cubic meter of blended.aggregates.is
0.60($3.00) + 0.40($4.40) = 1.8+1.76
 =$3.56/m3
Solution
 A machine part is manufactured at a unit cost of 0.4$ for material
and 0.15$ for direct labor. An investment of $500,000 in tooling is
required. The order calls for 3 million pieces. Halfway through the
order, a new method of manufacture can be put into effect that wi11
reduce the unit costs to 0.34$ for material and 0.1$ for direct labor
but it will require 100,000$ for additional tooling. This tooling will
not be useful for future orders. Other costs are allocated at 2.5 times
the direct labor cost. What if anything, should be done?
Example:
 Since there is only one way to handle first 1.5 million pieces, our problem
concerns only the second half of the order.
 Alternative A: Continue with Present Method
 Cost for remaining 1,500,000 pieces = $1,387,500
Solution
Material cost 1,500,000pieces x 0.4= $600,000
Direct labor cost 1,500,000pieces x 0.15= $225,000
Other costs 2.50 x direct labor cost = $562,500
 Alternative B: Change the Manufacturing Method
 Cost for remaining 1,500,000 pieces = $1,135,000
 Before making a final decision, one should closely examine the Other costs to
see that they do, in fact, vary as the Direct labor cost varies. Assuming they do,
the decision would be to change the manufacturing method.
Solution
Additional tooling
cost
$100,000
Material cost 1,500,000pieces x 0.34= $510,000
Direct labor cost 1,500,000pieces x 0.1= $150,000
Other costs 2.50 x direct labor cost = $375,000
Next Class
Read Chapter 2 of textbook
Try to do some of the problems at end of Chapter 2
Next time we’ll start the mathematical part!

More Related Content

What's hot

PPCE unit 3 (ME8793 – PROCESS PLANNING AND COST ESTIMATION)
 PPCE  unit 3 (ME8793 – PROCESS PLANNING AND COST ESTIMATION)  PPCE  unit 3 (ME8793 – PROCESS PLANNING AND COST ESTIMATION)
PPCE unit 3 (ME8793 – PROCESS PLANNING AND COST ESTIMATION)
TAMILMECHKIT
 
Process planning and cost estimation unit iii
Process planning and cost estimation  unit   iiiProcess planning and cost estimation  unit   iii
Process planning and cost estimation unit iii
s Kumaravel
 
Introduction to Engineering Economics Unit I MG6863
Introduction to Engineering Economics  Unit I MG6863Introduction to Engineering Economics  Unit I MG6863
Introduction to Engineering Economics Unit I MG6863
Balamurugan Subburaj
 
Chapter 6&amp;7 annual worth analysis &amp; ror lo3b
Chapter 6&amp;7  annual worth analysis &amp; ror   lo3bChapter 6&amp;7  annual worth analysis &amp; ror   lo3b
Chapter 6&amp;7 annual worth analysis &amp; ror lo3b
Abdulaziz AlSuwaidi
 
UNIT – I.ppt
UNIT – I.pptUNIT – I.ppt
UNIT – I.pptAsha A
 
UNIT V DEPRECIATION
UNIT V DEPRECIATIONUNIT V DEPRECIATION
UNIT V DEPRECIATIONAsha A
 
Value Engineering
Value EngineeringValue Engineering
Value Engineering
Farzad Vasheghani Farahani
 
Replacement analysis importance and application
Replacement analysis importance and applicationReplacement analysis importance and application
Replacement analysis importance and application
abdus sobhan
 
Engineering Economics: Solved exam problems [ch1-ch4]
Engineering Economics: Solved exam problems [ch1-ch4]Engineering Economics: Solved exam problems [ch1-ch4]
Engineering Economics: Solved exam problems [ch1-ch4]
Mohsin Siddique
 
Elementary Economic Analysis
Elementary Economic AnalysisElementary Economic Analysis
Elementary Economic Analysis
Prabu U
 
Project cost stimating
Project cost stimatingProject cost stimating
Project cost stimating
hatim ahmed
 
Concept of Efficiency- Engineering Economics
Concept of Efficiency- Engineering Economics Concept of Efficiency- Engineering Economics
Concept of Efficiency- Engineering Economics
Dr Naim R Kidwai
 
Introduction to Engineering Economics
Introduction to Engineering EconomicsIntroduction to Engineering Economics
Introduction to Engineering Economics
Prabu U
 
cost estimation and break even analysis
cost estimation and break even analysiscost estimation and break even analysis
cost estimation and break even analysis
Dr Naim R Kidwai
 
7. annual cash flow analysis
7. annual cash flow analysis7. annual cash flow analysis
7. annual cash flow analysis
Mohsin Siddique
 
Measurement of Smoke Density using Bosch type smoke meter
Measurement of Smoke Density using Bosch type smoke meterMeasurement of Smoke Density using Bosch type smoke meter
Measurement of Smoke Density using Bosch type smoke meter
Rohtash kumar
 
Methods of depreciation
Methods of depreciationMethods of depreciation
Methods of depreciation
Aashish Singh
 
Cash Flow - Unit III Engineering Economics - MG6863
Cash Flow - Unit III Engineering Economics - MG6863Cash Flow - Unit III Engineering Economics - MG6863
Cash Flow - Unit III Engineering Economics - MG6863
Balamurugan Subburaj
 
Carburetor air-fuel ratio calculations
Carburetor air-fuel ratio calculationsCarburetor air-fuel ratio calculations
Carburetor air-fuel ratio calculations
INDIAN INSTITUTE OF TECHNOLOGY Delhi
 
Chapter 5 present worth analysis -with examples
Chapter 5   present worth analysis -with examplesChapter 5   present worth analysis -with examples
Chapter 5 present worth analysis -with examples
Abdulaziz AlSuwaidi
 

What's hot (20)

PPCE unit 3 (ME8793 – PROCESS PLANNING AND COST ESTIMATION)
 PPCE  unit 3 (ME8793 – PROCESS PLANNING AND COST ESTIMATION)  PPCE  unit 3 (ME8793 – PROCESS PLANNING AND COST ESTIMATION)
PPCE unit 3 (ME8793 – PROCESS PLANNING AND COST ESTIMATION)
 
Process planning and cost estimation unit iii
Process planning and cost estimation  unit   iiiProcess planning and cost estimation  unit   iii
Process planning and cost estimation unit iii
 
Introduction to Engineering Economics Unit I MG6863
Introduction to Engineering Economics  Unit I MG6863Introduction to Engineering Economics  Unit I MG6863
Introduction to Engineering Economics Unit I MG6863
 
Chapter 6&amp;7 annual worth analysis &amp; ror lo3b
Chapter 6&amp;7  annual worth analysis &amp; ror   lo3bChapter 6&amp;7  annual worth analysis &amp; ror   lo3b
Chapter 6&amp;7 annual worth analysis &amp; ror lo3b
 
UNIT – I.ppt
UNIT – I.pptUNIT – I.ppt
UNIT – I.ppt
 
UNIT V DEPRECIATION
UNIT V DEPRECIATIONUNIT V DEPRECIATION
UNIT V DEPRECIATION
 
Value Engineering
Value EngineeringValue Engineering
Value Engineering
 
Replacement analysis importance and application
Replacement analysis importance and applicationReplacement analysis importance and application
Replacement analysis importance and application
 
Engineering Economics: Solved exam problems [ch1-ch4]
Engineering Economics: Solved exam problems [ch1-ch4]Engineering Economics: Solved exam problems [ch1-ch4]
Engineering Economics: Solved exam problems [ch1-ch4]
 
Elementary Economic Analysis
Elementary Economic AnalysisElementary Economic Analysis
Elementary Economic Analysis
 
Project cost stimating
Project cost stimatingProject cost stimating
Project cost stimating
 
Concept of Efficiency- Engineering Economics
Concept of Efficiency- Engineering Economics Concept of Efficiency- Engineering Economics
Concept of Efficiency- Engineering Economics
 
Introduction to Engineering Economics
Introduction to Engineering EconomicsIntroduction to Engineering Economics
Introduction to Engineering Economics
 
cost estimation and break even analysis
cost estimation and break even analysiscost estimation and break even analysis
cost estimation and break even analysis
 
7. annual cash flow analysis
7. annual cash flow analysis7. annual cash flow analysis
7. annual cash flow analysis
 
Measurement of Smoke Density using Bosch type smoke meter
Measurement of Smoke Density using Bosch type smoke meterMeasurement of Smoke Density using Bosch type smoke meter
Measurement of Smoke Density using Bosch type smoke meter
 
Methods of depreciation
Methods of depreciationMethods of depreciation
Methods of depreciation
 
Cash Flow - Unit III Engineering Economics - MG6863
Cash Flow - Unit III Engineering Economics - MG6863Cash Flow - Unit III Engineering Economics - MG6863
Cash Flow - Unit III Engineering Economics - MG6863
 
Carburetor air-fuel ratio calculations
Carburetor air-fuel ratio calculationsCarburetor air-fuel ratio calculations
Carburetor air-fuel ratio calculations
 
Chapter 5 present worth analysis -with examples
Chapter 5   present worth analysis -with examplesChapter 5   present worth analysis -with examples
Chapter 5 present worth analysis -with examples
 

Similar to Engineering costs and cost estimating

Engineering Cost & Estimation .pptx
Engineering Cost & Estimation .pptxEngineering Cost & Estimation .pptx
Engineering Cost & Estimation .pptx
SAMIRDE6
 
Module 3_Presentation EE _67-73(1).pptx
Module 3_Presentation EE _67-73(1).pptxModule 3_Presentation EE _67-73(1).pptx
Module 3_Presentation EE _67-73(1).pptx
ArchanaBelge2
 
3 150316005311-conversion-gate01
3 150316005311-conversion-gate013 150316005311-conversion-gate01
3 150316005311-conversion-gate01
abidiqbal55
 
Engineering economics ECO-202
Engineering economics ECO-202Engineering economics ECO-202
Engineering economics ECO-202
Saqib Imran
 
Engineering economics eco202
Engineering economics eco202Engineering economics eco202
Engineering economics eco202
Saqib Imran
 
Cost and BEA
Cost and BEACost and BEA
Cost and BEA
Preet_patel
 
Cost concepts and behaviours
Cost concepts and behavioursCost concepts and behaviours
Cost concepts and behaviours
Jai Vishal
 
Chapter 2 Managerial Accounting 15th edition by Garison
Chapter 2 Managerial Accounting 15th edition by Garison Chapter 2 Managerial Accounting 15th edition by Garison
Chapter 2 Managerial Accounting 15th edition by Garison
MuhammadUsman208471
 
Engineering Economy - WEEK 1.pdf
Engineering Economy - WEEK 1.pdfEngineering Economy - WEEK 1.pdf
Engineering Economy - WEEK 1.pdf
nivine7
 
Business Canvas and SWOT Analysis For mo.docx
             Business Canvas and SWOT Analysis   For mo.docx             Business Canvas and SWOT Analysis   For mo.docx
Business Canvas and SWOT Analysis For mo.docx
hallettfaustina
 
Ca 01
Ca 01Ca 01
Pmp integration chapter 4
Pmp integration chapter 4Pmp integration chapter 4
Pmp integration chapter 4
Ahmed Elshaboury,PMP,LEED GA
 
Cost Concepts.ppt
Cost Concepts.pptCost Concepts.ppt
Cost Concepts.ppt
Habibullah Qayumi
 
Managerial Economics- Cost analysis and BEP Analysis notes
Managerial Economics- Cost analysis and BEP Analysis notesManagerial Economics- Cost analysis and BEP Analysis notes
Managerial Economics- Cost analysis and BEP Analysis notes
Dr. Durgaprasad Navulla
 
2.Chapter two.pptx
2.Chapter two.pptx2.Chapter two.pptx
2.Chapter two.pptx
AberraBeri
 
4. 2 Construction Cost Estimate.pdf
4. 2 Construction Cost Estimate.pdf4. 2 Construction Cost Estimate.pdf
4. 2 Construction Cost Estimate.pdf
ThanoonQasem
 
Costs functions
Costs functionsCosts functions
Costs functions
Dr. Shweta Uppadhyay
 
Engineering economics Slides for Postgraduates
Engineering economics Slides for PostgraduatesEngineering economics Slides for Postgraduates
Engineering economics Slides for Postgraduates
ssuser50050d1
 
ENGINEERING-ECONOMY.docx
ENGINEERING-ECONOMY.docxENGINEERING-ECONOMY.docx
ENGINEERING-ECONOMY.docx
NCCollegeofGeodeticE
 
Training on Financial and Economic Project Evaluation
Training on Financial and Economic Project Evaluation Training on Financial and Economic Project Evaluation
Training on Financial and Economic Project Evaluation tobiassommer2013
 

Similar to Engineering costs and cost estimating (20)

Engineering Cost & Estimation .pptx
Engineering Cost & Estimation .pptxEngineering Cost & Estimation .pptx
Engineering Cost & Estimation .pptx
 
Module 3_Presentation EE _67-73(1).pptx
Module 3_Presentation EE _67-73(1).pptxModule 3_Presentation EE _67-73(1).pptx
Module 3_Presentation EE _67-73(1).pptx
 
3 150316005311-conversion-gate01
3 150316005311-conversion-gate013 150316005311-conversion-gate01
3 150316005311-conversion-gate01
 
Engineering economics ECO-202
Engineering economics ECO-202Engineering economics ECO-202
Engineering economics ECO-202
 
Engineering economics eco202
Engineering economics eco202Engineering economics eco202
Engineering economics eco202
 
Cost and BEA
Cost and BEACost and BEA
Cost and BEA
 
Cost concepts and behaviours
Cost concepts and behavioursCost concepts and behaviours
Cost concepts and behaviours
 
Chapter 2 Managerial Accounting 15th edition by Garison
Chapter 2 Managerial Accounting 15th edition by Garison Chapter 2 Managerial Accounting 15th edition by Garison
Chapter 2 Managerial Accounting 15th edition by Garison
 
Engineering Economy - WEEK 1.pdf
Engineering Economy - WEEK 1.pdfEngineering Economy - WEEK 1.pdf
Engineering Economy - WEEK 1.pdf
 
Business Canvas and SWOT Analysis For mo.docx
             Business Canvas and SWOT Analysis   For mo.docx             Business Canvas and SWOT Analysis   For mo.docx
Business Canvas and SWOT Analysis For mo.docx
 
Ca 01
Ca 01Ca 01
Ca 01
 
Pmp integration chapter 4
Pmp integration chapter 4Pmp integration chapter 4
Pmp integration chapter 4
 
Cost Concepts.ppt
Cost Concepts.pptCost Concepts.ppt
Cost Concepts.ppt
 
Managerial Economics- Cost analysis and BEP Analysis notes
Managerial Economics- Cost analysis and BEP Analysis notesManagerial Economics- Cost analysis and BEP Analysis notes
Managerial Economics- Cost analysis and BEP Analysis notes
 
2.Chapter two.pptx
2.Chapter two.pptx2.Chapter two.pptx
2.Chapter two.pptx
 
4. 2 Construction Cost Estimate.pdf
4. 2 Construction Cost Estimate.pdf4. 2 Construction Cost Estimate.pdf
4. 2 Construction Cost Estimate.pdf
 
Costs functions
Costs functionsCosts functions
Costs functions
 
Engineering economics Slides for Postgraduates
Engineering economics Slides for PostgraduatesEngineering economics Slides for Postgraduates
Engineering economics Slides for Postgraduates
 
ENGINEERING-ECONOMY.docx
ENGINEERING-ECONOMY.docxENGINEERING-ECONOMY.docx
ENGINEERING-ECONOMY.docx
 
Training on Financial and Economic Project Evaluation
Training on Financial and Economic Project Evaluation Training on Financial and Economic Project Evaluation
Training on Financial and Economic Project Evaluation
 

Recently uploaded

AKS UNIVERSITY Satna Final Year Project By OM Hardaha.pdf
AKS UNIVERSITY Satna Final Year Project By OM Hardaha.pdfAKS UNIVERSITY Satna Final Year Project By OM Hardaha.pdf
AKS UNIVERSITY Satna Final Year Project By OM Hardaha.pdf
SamSarthak3
 
Final project report on grocery store management system..pdf
Final project report on grocery store management system..pdfFinal project report on grocery store management system..pdf
Final project report on grocery store management system..pdf
Kamal Acharya
 
Standard Reomte Control Interface - Neometrix
Standard Reomte Control Interface - NeometrixStandard Reomte Control Interface - Neometrix
Standard Reomte Control Interface - Neometrix
Neometrix_Engineering_Pvt_Ltd
 
Nuclear Power Economics and Structuring 2024
Nuclear Power Economics and Structuring 2024Nuclear Power Economics and Structuring 2024
Nuclear Power Economics and Structuring 2024
Massimo Talia
 
Immunizing Image Classifiers Against Localized Adversary Attacks
Immunizing Image Classifiers Against Localized Adversary AttacksImmunizing Image Classifiers Against Localized Adversary Attacks
Immunizing Image Classifiers Against Localized Adversary Attacks
gerogepatton
 
WATER CRISIS and its solutions-pptx 1234
WATER CRISIS and its solutions-pptx 1234WATER CRISIS and its solutions-pptx 1234
WATER CRISIS and its solutions-pptx 1234
AafreenAbuthahir2
 
Railway Signalling Principles Edition 3.pdf
Railway Signalling Principles Edition 3.pdfRailway Signalling Principles Edition 3.pdf
Railway Signalling Principles Edition 3.pdf
TeeVichai
 
Halogenation process of chemical process industries
Halogenation process of chemical process industriesHalogenation process of chemical process industries
Halogenation process of chemical process industries
MuhammadTufail242431
 
Forklift Classes Overview by Intella Parts
Forklift Classes Overview by Intella PartsForklift Classes Overview by Intella Parts
Forklift Classes Overview by Intella Parts
Intella Parts
 
Sachpazis:Terzaghi Bearing Capacity Estimation in simple terms with Calculati...
Sachpazis:Terzaghi Bearing Capacity Estimation in simple terms with Calculati...Sachpazis:Terzaghi Bearing Capacity Estimation in simple terms with Calculati...
Sachpazis:Terzaghi Bearing Capacity Estimation in simple terms with Calculati...
Dr.Costas Sachpazis
 
Industrial Training at Shahjalal Fertilizer Company Limited (SFCL)
Industrial Training at Shahjalal Fertilizer Company Limited (SFCL)Industrial Training at Shahjalal Fertilizer Company Limited (SFCL)
Industrial Training at Shahjalal Fertilizer Company Limited (SFCL)
MdTanvirMahtab2
 
一比一原版(SFU毕业证)西蒙菲莎大学毕业证成绩单如何办理
一比一原版(SFU毕业证)西蒙菲莎大学毕业证成绩单如何办理一比一原版(SFU毕业证)西蒙菲莎大学毕业证成绩单如何办理
一比一原版(SFU毕业证)西蒙菲莎大学毕业证成绩单如何办理
bakpo1
 
Top 10 Oil and Gas Projects in Saudi Arabia 2024.pdf
Top 10 Oil and Gas Projects in Saudi Arabia 2024.pdfTop 10 Oil and Gas Projects in Saudi Arabia 2024.pdf
Top 10 Oil and Gas Projects in Saudi Arabia 2024.pdf
Teleport Manpower Consultant
 
road safety engineering r s e unit 3.pdf
road safety engineering  r s e unit 3.pdfroad safety engineering  r s e unit 3.pdf
road safety engineering r s e unit 3.pdf
VENKATESHvenky89705
 
HYDROPOWER - Hydroelectric power generation
HYDROPOWER - Hydroelectric power generationHYDROPOWER - Hydroelectric power generation
HYDROPOWER - Hydroelectric power generation
Robbie Edward Sayers
 
Quality defects in TMT Bars, Possible causes and Potential Solutions.
Quality defects in TMT Bars, Possible causes and Potential Solutions.Quality defects in TMT Bars, Possible causes and Potential Solutions.
Quality defects in TMT Bars, Possible causes and Potential Solutions.
PrashantGoswami42
 
Design and Analysis of Algorithms-DP,Backtracking,Graphs,B&B
Design and Analysis of Algorithms-DP,Backtracking,Graphs,B&BDesign and Analysis of Algorithms-DP,Backtracking,Graphs,B&B
Design and Analysis of Algorithms-DP,Backtracking,Graphs,B&B
Sreedhar Chowdam
 
TECHNICAL TRAINING MANUAL GENERAL FAMILIARIZATION COURSE
TECHNICAL TRAINING MANUAL   GENERAL FAMILIARIZATION COURSETECHNICAL TRAINING MANUAL   GENERAL FAMILIARIZATION COURSE
TECHNICAL TRAINING MANUAL GENERAL FAMILIARIZATION COURSE
DuvanRamosGarzon1
 
ethical hacking in wireless-hacking1.ppt
ethical hacking in wireless-hacking1.pptethical hacking in wireless-hacking1.ppt
ethical hacking in wireless-hacking1.ppt
Jayaprasanna4
 
NO1 Uk best vashikaran specialist in delhi vashikaran baba near me online vas...
NO1 Uk best vashikaran specialist in delhi vashikaran baba near me online vas...NO1 Uk best vashikaran specialist in delhi vashikaran baba near me online vas...
NO1 Uk best vashikaran specialist in delhi vashikaran baba near me online vas...
Amil Baba Dawood bangali
 

Recently uploaded (20)

AKS UNIVERSITY Satna Final Year Project By OM Hardaha.pdf
AKS UNIVERSITY Satna Final Year Project By OM Hardaha.pdfAKS UNIVERSITY Satna Final Year Project By OM Hardaha.pdf
AKS UNIVERSITY Satna Final Year Project By OM Hardaha.pdf
 
Final project report on grocery store management system..pdf
Final project report on grocery store management system..pdfFinal project report on grocery store management system..pdf
Final project report on grocery store management system..pdf
 
Standard Reomte Control Interface - Neometrix
Standard Reomte Control Interface - NeometrixStandard Reomte Control Interface - Neometrix
Standard Reomte Control Interface - Neometrix
 
Nuclear Power Economics and Structuring 2024
Nuclear Power Economics and Structuring 2024Nuclear Power Economics and Structuring 2024
Nuclear Power Economics and Structuring 2024
 
Immunizing Image Classifiers Against Localized Adversary Attacks
Immunizing Image Classifiers Against Localized Adversary AttacksImmunizing Image Classifiers Against Localized Adversary Attacks
Immunizing Image Classifiers Against Localized Adversary Attacks
 
WATER CRISIS and its solutions-pptx 1234
WATER CRISIS and its solutions-pptx 1234WATER CRISIS and its solutions-pptx 1234
WATER CRISIS and its solutions-pptx 1234
 
Railway Signalling Principles Edition 3.pdf
Railway Signalling Principles Edition 3.pdfRailway Signalling Principles Edition 3.pdf
Railway Signalling Principles Edition 3.pdf
 
Halogenation process of chemical process industries
Halogenation process of chemical process industriesHalogenation process of chemical process industries
Halogenation process of chemical process industries
 
Forklift Classes Overview by Intella Parts
Forklift Classes Overview by Intella PartsForklift Classes Overview by Intella Parts
Forklift Classes Overview by Intella Parts
 
Sachpazis:Terzaghi Bearing Capacity Estimation in simple terms with Calculati...
Sachpazis:Terzaghi Bearing Capacity Estimation in simple terms with Calculati...Sachpazis:Terzaghi Bearing Capacity Estimation in simple terms with Calculati...
Sachpazis:Terzaghi Bearing Capacity Estimation in simple terms with Calculati...
 
Industrial Training at Shahjalal Fertilizer Company Limited (SFCL)
Industrial Training at Shahjalal Fertilizer Company Limited (SFCL)Industrial Training at Shahjalal Fertilizer Company Limited (SFCL)
Industrial Training at Shahjalal Fertilizer Company Limited (SFCL)
 
一比一原版(SFU毕业证)西蒙菲莎大学毕业证成绩单如何办理
一比一原版(SFU毕业证)西蒙菲莎大学毕业证成绩单如何办理一比一原版(SFU毕业证)西蒙菲莎大学毕业证成绩单如何办理
一比一原版(SFU毕业证)西蒙菲莎大学毕业证成绩单如何办理
 
Top 10 Oil and Gas Projects in Saudi Arabia 2024.pdf
Top 10 Oil and Gas Projects in Saudi Arabia 2024.pdfTop 10 Oil and Gas Projects in Saudi Arabia 2024.pdf
Top 10 Oil and Gas Projects in Saudi Arabia 2024.pdf
 
road safety engineering r s e unit 3.pdf
road safety engineering  r s e unit 3.pdfroad safety engineering  r s e unit 3.pdf
road safety engineering r s e unit 3.pdf
 
HYDROPOWER - Hydroelectric power generation
HYDROPOWER - Hydroelectric power generationHYDROPOWER - Hydroelectric power generation
HYDROPOWER - Hydroelectric power generation
 
Quality defects in TMT Bars, Possible causes and Potential Solutions.
Quality defects in TMT Bars, Possible causes and Potential Solutions.Quality defects in TMT Bars, Possible causes and Potential Solutions.
Quality defects in TMT Bars, Possible causes and Potential Solutions.
 
Design and Analysis of Algorithms-DP,Backtracking,Graphs,B&B
Design and Analysis of Algorithms-DP,Backtracking,Graphs,B&BDesign and Analysis of Algorithms-DP,Backtracking,Graphs,B&B
Design and Analysis of Algorithms-DP,Backtracking,Graphs,B&B
 
TECHNICAL TRAINING MANUAL GENERAL FAMILIARIZATION COURSE
TECHNICAL TRAINING MANUAL   GENERAL FAMILIARIZATION COURSETECHNICAL TRAINING MANUAL   GENERAL FAMILIARIZATION COURSE
TECHNICAL TRAINING MANUAL GENERAL FAMILIARIZATION COURSE
 
ethical hacking in wireless-hacking1.ppt
ethical hacking in wireless-hacking1.pptethical hacking in wireless-hacking1.ppt
ethical hacking in wireless-hacking1.ppt
 
NO1 Uk best vashikaran specialist in delhi vashikaran baba near me online vas...
NO1 Uk best vashikaran specialist in delhi vashikaran baba near me online vas...NO1 Uk best vashikaran specialist in delhi vashikaran baba near me online vas...
NO1 Uk best vashikaran specialist in delhi vashikaran baba near me online vas...
 

Engineering costs and cost estimating

  • 1. Engineering Costs and Cost Estimating Cost Types: Fixed and Variable Direct and Indirect Marginal and Average Sunk and Opportunity Recurring and Non- Recurring Incremental Cash and Book Life-Cycle
  • 2. Engineering Costs and Cost Estimating Estimating Costs: Per-Unit Model WBS Model Cost Indices Estimating Benefits Cash Flow Diagrams
  • 4. Engineering Costs and Cost Estimating Engineering Costs: Value of the economic resources used in the production of goods and services. Examples: Land, labor, capital or initial investment, wages and salaries, material purchases, utilities Cost estimating: Approximating the cost of resources or activities Cost estimating is necessary for any economic analysis Key Question: Where do the numbers we use in an engineering economic analysis come from? When working in industry, you may need to consult with professional accountants to obtain such information
  • 5. Classification of Costs Fixed Costs: Costs that do not vary (i.e., constant and unchanging regardless of the level of the activity. Variable Costs: Costs that vary in total with the quantity of output or other measures of activity level.  Total Cost is the sum of Fixed Cost and Variable Cost. Direct Costs: Cost that can be reasonably measured and allocated to a specific output or work activity. Indirect/Overhead Cost: Cost that it is difficult to attribute or allocate to a specific output or work activity.
  • 6. Example 2-1 Amin plans to charter a bus to take people to see some event show in the city. He categorized his costs at shown below:  Which of the costs are fixed and which are variable costs? How do we compute Amin’s total cost if he takes n people to City? Total Cost = Fixed cost + Variable cost =$225 + $20 n
  • 7. Average and Marginal Costs Average Cost: Computed as total cost divided by the number of units produced. Marginal Cost: The change in total cost that arises when the quantity produced changes by one unit; i.e. the cost to produce one more unit. Avg. Cost = TC/n = ($225+$20n)/n For n = 33, TC = $885 Avg. Cost = $885/30 = $29.50 Total cost can be calculated from an average cost value For n =35: ¨ TC ¹ 35*($29.50) = $ 1,032.50
  • 8. Example 2-2 Do we have enough information yet to decide how much money Amin will make on his venture? What else must we know? Amin needs to know his total revenue Amin knows that similar ventures in the past have charged $35 per person, so that is what he decides to charge Total Revenue = 35n (for n people) Total profit = Total Revenue – Total Cost 35n – (225 + 20n) = 15n – 225 Question: How many people does Amin need to break even? (not lose money on his venture) Solve: 15 n – 225 = 0 => n=15 more than 15, he makes money
  • 9. Breakeven Analysis Where is the Loss Region? Where is the Profit Region? Where is the Breakeven Point? It is the point where total revenue received equals total costs associated with the sale of the product
  • 10. Profit and Loss Terms (non-linear cost and revenue)  Total revenue = Unit price x units sold  Breakeven: total revenue = total costs  Just getting by  Profit region: total revenue > total costs  Putting money in the bank  Loss region: total revenue < total costs  Going into debt
  • 11. Sunk (Past) Costs  A sunk cost is money already spent due to a past decision.  As engineering economists we deal with present and future opportunities  We must be careful not to be influenced by the past  Disregard sunk costs in engineering economic analysis  Example: Suppose that three years ago you bought a laptop PC for $2,000.  How likely is it that you can sell it today for what it cost?  Suppose you can sell the laptop today for $400. Does the $2000 purchase cost have any effect on the selling price today?  The $2,000 is a sunk cost. It has no influence on the present opportunity to sell the laptop for $400.
  • 12. Opportunity (Future) Cost  An opportunity cost is a benefit that is foregone by engaging a business resource in a chosen activity instead of engaging that same resource in the foregone activity.  Example: Suppose your wealthy uncle gives you $75,000 when you graduate from high school. It is enough to put you through college (5 years at $15,000 per year). It is also enough for you to open a business making web pages for small companies instead of going to college. You estimate you would make $20,000 per year with this business.  If you decide to go to college you give up the opportunity to make $20,000 per year  Your opportunity cost is $20,000  Your total cost per year is $35,000
  • 13. Recurring and Non-Recurring Costs  Recurring costs are those expenses that are known, anticipated, and occur at regular intervals.  These costs can be modeled as cash flows.  Non-recurring costs are one-of-a-kind (one-time) event that occurs at irregular intervals.  They are difficult to plan for or anticipate.  Example: A company decided to landscape a lot of ground and then care for it. Which are recurring and which are non-recurring costs the company incur?  Remove existing trees, vegetation  Have land graded with bulldozer  Have yard planted with grass  Plant shrubs, trees  Mow grass  Fertilize grass, shrubs  Water grass, shrubs
  • 14. Incremental Cost Incremental Cost is the additional cost that results from selecting one alternative over another. It is the difference in cost between two alternative investments or activities.
  • 16. Solution Let's look more closely at each of the data items. Distributor's purchase price 3 years ago: This is a sunk cost that should not be considered in setting the price today. Distributor's storage costs to date: The storage costs for keeping the pumps in inventory are sunk costs; that is, they have been paid. Hence they should not influence the pricing decision.
  • 17. Solution Distributor's list price 3 years ago: If there have been no willing buyers in the past 3 years at this price, it is unlikely that a buyer will emerge in the future. This past list price should have no influence on the current pricing decision. Current list price of newer pumps: Newer pumps now include technology and features that have made the older pumps less valuable. Directly comparing the older pumps to those with new technology is misleading. However, the price of the new pumps and the value of the new features help determine the market value of the old pumps.
  • 18. Solution Amount offered from a buyer 2 years ago: This is a forgone opportunity. At the time of the offer, the company chose to keep the lot and thus the $5000 offered became an opportunity cost for keeping the pumps. This amount should not influence the current pricing decision. Current price the lot could bring: The price a willing buyer in the marketplace offers is called the asset's market value. The lot of old pumps in question is believed to have a current market value of $3000.
  • 19. Cash Costs vs. Book Costs Cash Costs: require the cash transaction of dollars out of one person’s pocket into the pocket of someone else. Book Costs: cost of a past transaction that is recorded in a book (accounting book) of a firm.  Do not represent cash flows  Not included in engineering economic analysis  One exception is for asset depreciation (used for tax purposes) Example: You got offers to sell your car for $6,000 (i.e., the book value of your car is $6,000). The book value can be thought of as the book cost. If you actually sell the car to a friend for $5,500, then the cash cost to your friend is $5,500.
  • 20. Life-Cycle Costs  Life-cycle Costs are the summation of all costs, both recurring and nonrecurring, related to a product, structure, system, or service during its lifetime.  Products go through a life cycle in phases: 1. Assessment & Justification 2. Conceptual or Preliminary Design 3. Detailed Design 4. Production or Construction 5. Operational Use 6. Decline and Retirement  Engineers should consider all life-cycle costs when designing products and the systems that produce them.  About 70-90% of all costs are set during the design phases when only 10-30% of cumulative life-cycle costs have been spent.
  • 22. Cost Estimating Engineering economic analysis is future based. Future consequences (costs and benefits) of current decisions and require estimating. Estimated costs and benefits are not known with certainty.  The more accurate the estimate, the more reliable the decision.  Difficulties arise due to an uncertain future. Types of estimates:  Rough: gut level; Inaccurate; -30% to +60%.  Semi-detailed: based on historical records; Reasonably sophisticated and accurate; -15% to +20%.  Detailed: based on specifications and cost models; Very accurate; -3% to +5%.  One-of-a-kind or first time projects: Few such projects in engineering economic analysis. Estimator experience and knowledge è better quality (and more reliable) estimates.
  • 23. Estimating Cost Using Per-Unit Cost  Uses ―per unit factor to develop estimate  Very simple yet useful technique for rough estimates  Commonly used in construction industry  Examples:  Service cost per costumer  Safety per employee  Gasoline cost per mile  Maintenance cost per window  Mileage cost per vehicle  Utility cost per square foot of floor space  Example: A contractor gave you a quote to build you a house for $250 per square meter. What’s your cost to build a 200 sq. meter-house?  Ans. Cost = 250 x 200 = $50,000
  • 24. (Estimating Cost Using WBS Cost (Segmenting Model  Work Breakdown Structure (WBS) is a graphical tool widely used in the project planning process.  It organizes all of the project work by placing elements of work into logical groupings; thus, providing a convenient and logical structure for estimating the cost of each activity.
  • 25. Cost Estimating Using Cost Indices Governments usually publish cost index data for labor, construction, and materials. The best-known example is the consumer price index (CPI), a measure of inflation.  The measure is scaled, so it is only the relative values of any two measures that are meaningful.  For example, in 1920, the measure was about 20; in 1997 it was about 160. The conclusion is that one would have to spend 160/20, or 8 times as much in 1997 as in 1920 for the same consumables. Cost indices work in the same way as price indices. Cost indices are dimensionless.
  • 26. Cost Estimating Using Cost Indices Example 2-7:Miriam needs to estimate annual labor cost for a new plant. For a similar facility built 3 yrs ago, annual labor cost was $2,455,000. CPI was at 544 3 yrs ago but it is 715 today.
  • 27. Estimating Benefits For the most part, we can use exactly the same app roach to estimate benefits as to estimate costs:  Fixed and variable benefits  Recurring and non-recurring benefits  Incremental benefits  Life-cycle benefits  Rough, semi-detailed, and detailed benefit estimates  Difficulties in estimation  Segmentation and index models Major differences between benefit and cost estimation:  Costs are more likely to be underestimated  Benefits are most likely to be overestimated  Benefits tend to occur further in the future than costs
  • 29. Cash Flow Diagrams  A Cash Flow Diagram (CFD) summarizes the costs and benefits of a project  It illustrates the size, sign, and timing of individual cash flows  The time line is a horizontal line divided into equal periods such as days, months, or years.  The end of one period is the beginning of the next one.  Each cash flow, such as a payment or receipt, is plotted along this line at the beginning or end of the period in which it occurs.  Arrows: usual interpretation is positive (upward) for cash inflows (revenues) and negative (Downward) for cash outflows (expenses).  Length of the arrow represents the magnitude ($) of the cash flow.  It is essential to use only one perspective in any CFD.  One person’s payment (cash outflow with – sign) is another person’s receipt (cash inflow with + sign)
  • 31. Categories of Cash Flows 1. First cost ≡ construction, purchase, or installation expense. 2. Operations and maintenance ≡ annual expense. 3. Salvage value ≡ receipt at project termination. 4. Revenues ≡ annual receipts due to sale of products. 5. Overhaul ≡ major capital expenditure occurring during life of asset.
  • 32. A concrete aggregate mix is required to contain at least 31% sand by volume for proper batching. One source of material, which has 25% sand and 75% coarse aggregate, sells for $3 per cubic meter (m3). Another source, which has 40% sand and 60% coarse aggregate, sells for $4.4/m3. Determine the least cost per cubic meter of blended aggregates. Example:
  • 33.  The least cost of blended aggregates will result from maximum use of the lower-cost material. The higher-cost material will be used to increase the proportion of sand up to the minimum level (31%) specified. .. Let x = Portion of blended aggregates from $3.00/m3 source 1 - x =Portion of blended aggregates from $4.40/m3 source Sand Balance  x(0.25) + (1 -x) (0.40) = 0.31  0.25x + 0.40- 0.04x =0.31 =0.60  Thus the blended aggregates will contain  60% of $3.00/m3 material  40% of $4.40/m3 material Solution
  • 34.  The least cost per cubic meter of blended.aggregates.is 0.60($3.00) + 0.40($4.40) = 1.8+1.76  =$3.56/m3 Solution
  • 35.  A machine part is manufactured at a unit cost of 0.4$ for material and 0.15$ for direct labor. An investment of $500,000 in tooling is required. The order calls for 3 million pieces. Halfway through the order, a new method of manufacture can be put into effect that wi11 reduce the unit costs to 0.34$ for material and 0.1$ for direct labor but it will require 100,000$ for additional tooling. This tooling will not be useful for future orders. Other costs are allocated at 2.5 times the direct labor cost. What if anything, should be done? Example:
  • 36.  Since there is only one way to handle first 1.5 million pieces, our problem concerns only the second half of the order.  Alternative A: Continue with Present Method  Cost for remaining 1,500,000 pieces = $1,387,500 Solution Material cost 1,500,000pieces x 0.4= $600,000 Direct labor cost 1,500,000pieces x 0.15= $225,000 Other costs 2.50 x direct labor cost = $562,500
  • 37.  Alternative B: Change the Manufacturing Method  Cost for remaining 1,500,000 pieces = $1,135,000  Before making a final decision, one should closely examine the Other costs to see that they do, in fact, vary as the Direct labor cost varies. Assuming they do, the decision would be to change the manufacturing method. Solution Additional tooling cost $100,000 Material cost 1,500,000pieces x 0.34= $510,000 Direct labor cost 1,500,000pieces x 0.1= $150,000 Other costs 2.50 x direct labor cost = $375,000
  • 38. Next Class Read Chapter 2 of textbook Try to do some of the problems at end of Chapter 2 Next time we’ll start the mathematical part!

Editor's Notes

  1. &amp;lt;number&amp;gt;