The document discusses various cost concepts including:
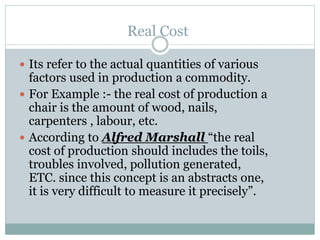
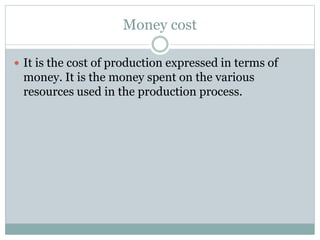
- Real cost refers to the actual quantities of factors used in production, while money cost expresses costs in monetary terms.
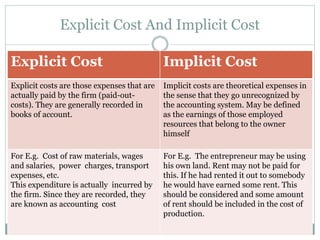
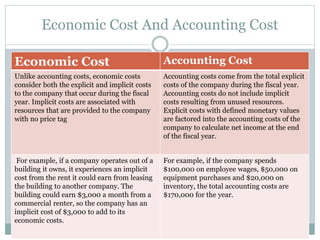
- Explicit costs are actual expenses paid by the firm, while implicit costs are theoretical expenses not captured in accounting.
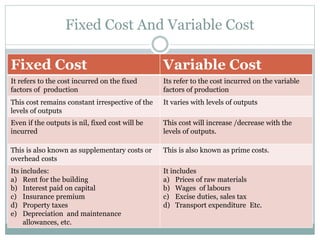
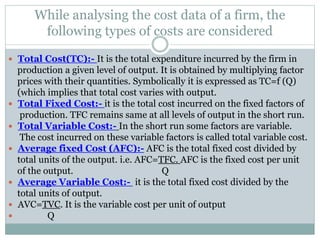
- Fixed costs remain constant regardless of output levels, while variable costs fluctuate with output.
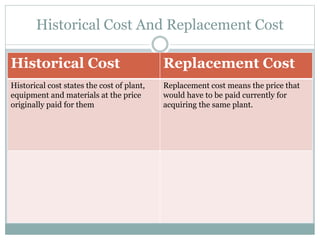
- Historical cost refers to the original price paid, while replacement cost is the current price to acquire the same assets.
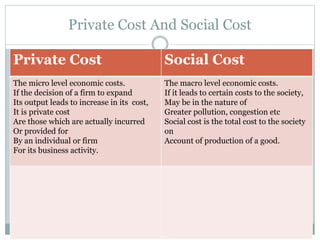
- Private costs affect individual firms, while social costs impact society as a whole.