SlideShare a Scribd company logo
Engineering Costs and Cost Estimating
CostTypes:
Fixed andVariable
Direct and Indirect
Marginaland Average
Sunk and Opportunity
Recurring and Non- Recurring
Incremental
Cashand Book
Life-Cycle
Engineering Costs and Cost Estimating
Estimating Costs:
Per-Unit Model
WBS Model
Cost Indices
Estimating Benefits
Cash Flow Diagrams
Cost Types
Engineering Costs and Cost Estimating
Engineering Costs: Value of the economic resources used in the
production of goods and services.
Examples: Land, labor, capital or initial investment, wages and
salaries, material purchases, utilities
Cost estimating: Approximating the cost of resources or activities
Cost estimating is necessary for any economic analysis
Key Question: Where do the numbers we use in an engineering
economic analysis come from?
When working in industry, you may need to consult with
professional accountants to obtain such information
Classification of Costs
Fixed Costs:
Costs that do not vary (i.e., constant and unchanging regardless of the level of the
activity.
Variable Costs:
Costs that vary in total with the quantity of output or other measures of activity level.
Total Cost is the sum of Fixed Cost and Variable Cost.
Direct Costs:
Cost that can be reasonably measured and allocated to a specific output or work activity.
Indirect/Overhead Cost:
Cost that it is difficult to attribute or allocate to a specific output or work activity.
Example 2-1
Amin plans to charter a bus to take people to see some event
show in the city. He categorized his costs at shown below:
Which of the costs are fixed and which are variablecosts?
How do we compute Amin’s total cost if he takes n people to City?
Total Cost = Fixed cost + Variable cost
=$225 + $20 n
Average and Marginal Costs
Average Cost: Computed as total cost divided by the number of
units produced.
Marginal Cost: The change in total cost that arises when the quantity
produced changes by one unit; i.e. the cost to produce one more unit.
Avg. Cost = TC/n
= ($225+$20n)/n
For n = 33, TC = $885
Avg. Cost = $885/30 = $29.50
Total cost can be calculated from
an average cost value For n =35:
¨ TC ¹ 35*($29.50) = $ 1,032.50
Example 2-2
Do we have enough information yet to decide how much money Amin will make on his venture? What else must we
know?
Amin needs to know his total revenue
Amin knows that similar ventures in
the past have charged $35 per person,
so that is what he decides to charge
Total Revenue = 35n (for n people)
Total profit = Total Revenue – Total Cost
35n – (225 + 20n) = 15n – 225
Question: How many people does
Amin need to break even?
(not lose money on his venture)
Solve: 15 n – 225 = 0 => n=15
more than 15, he makes money
BreakevenAnalysis
Where is the
Loss Region?
Where is the
Profit Region?
Where is the
Breakeven Point?
It is the point where
total revenue received
equals total costs
associated with the sale
of the product
Profit and Loss Terms (non-linear cost and
revenue)
Total revenue =
Unit price x units sold
Breakeven:
total revenue = total costs
Just getting by
Profitregion:
total revenue > total costs
Putting money in the bank
Lossregion:
total revenue < total costs
Going into debt
Sunk (Past) Costs
A sunk cost is money already spent due to a pastdecision.
As engineering economists we deal with present and future opportunities
We must be careful not to be influenced by the past
Disregard sunk costs in engineering economic analysis
Example: Suppose that three years ago you bought a laptop PC for $2,000.
How likely is it that you can sell it today for what it cost?
Suppose you can sell the laptop today for $400. Does the
$2000 purchase cost have any effect on the selling price today?
The $2,000 is a sunk cost. It has no influence on the
present opportunity to sell the laptop for $400.
Opportunity (Future) Cost
An opportunity cost is a benefit that is foregone by engaging a
business resource in a chosen activity instead of engaging that same
resource in the foregone activity.
Example: Suppose your wealthy uncle gives you
$75,000 when you graduate from high school. It is enough to put you through
college (5 years at $15,000 per year). It is also enough for you to open a
business making web pages for small companies instead of going to
college. You estimate you would make $20,000 per year with this business.
If you decide to go to college you give up the opportunity to
make $20,000 per year
Your opportunity cost is $20,000
Your total cost per year is $35,000
Recurring and Non-Recurring Costs
Recurring costs are those expenses that are known, anticipated, and occur at regular intervals.
These costs can be modeled as cash flows.
Non-recurring costs are one-of-a-kind (one-time) event that
occurs at irregular intervals.
They are difficult to plan for or anticipate.
Example: A company decided to landscape a lot of ground and then care for it. Which are recurring and
which are non-recurring costs the company incur?
Remove existing trees, vegetation
Have land graded with bulldozer
Have yard planted with grass
Plant shrubs, trees
Mow grass
Fertilize grass, shrubs
Water grass, shrubs
Incremental Cost
Incremental Cost is the additional cost
that results from selecting one alternative
over another.
It is the difference in cost between two
alternative investments or activities.
Example
Solution
Let's look more closely at each of the data items.
Distributor's purchase price 3 years ago: This is a
sunk cost that should not be considered in setting the
price today.
Distributor's storage costs to date: The storage costs
for keeping the pumps in inventory are sunk costs; that
is, they have been paid. Hence they should not
influence the pricing decision.
Solution
Distributor's list price 3 years ago: If there have been no willing buyers in the
past 3 years at this price, it is unlikely that a buyer will emerge in the future.
This past list price should have no influence on the current pricing decision.
Current list price of newer pumps: Newer pumps now include technology and
features that have made the older pumps less valuable. Directly comparing
the older pumps to those with new technology is misleading. However, the
price of the new pumps and the value of the new features help determine the
market value of the old pumps.
Solution
Amount offered from a buyer 2 years ago: This is a forgone opportunity. At
the time of
the offer, the company chose to keep the lot and thus the $5000 offered
became an
opportunity cost for keeping the pumps. This amount should not influence
the current
pricing decision.
Current price the lot could bring: The price a willing buyer in the
marketplace offers is
called the asset's market value. The lot of old pumps in question is believed
to have a
current market value of $3000.
Cash Costs vs. Book Costs
Cash Costs: require the cash transaction of dollars out of
one person’s pocket into the pocket of someone else.
Book Costs: cost of a past transaction that is recorded in a
book (accounting book) of a firm.
Do not represent cash flows
Not included in engineering economic analysis
One exception is for asset depreciation (used for tax purposes)
Example: You got offers to sell your car for $6,000 (i.e., the book value of your car
is $6,000). The book value can be thought of as the book cost. If you actually sell
the car to a friend for $5,500, then the cash cost to your friend is
$5,500.
Life-Cycle Costs
Life-cycle Costs are the summation of all costs, both recurring and nonrecurring,
related to a product, structure, system, or service during its lifetime.
Products go through a life cycle in phases:
1. Assessment & Justification
2. Conceptual or Preliminary Design
3. Detailed Design
4. Production or Construction
5. Operational Use
6. Decline and Retirement
Engineers should consider all life-cycle costs when designing
products and the systems that produce them.
About 70-90% of all costs are set during the design phases when only 10-30% of
cumulative life-cycle costs have been spent.
Cost Estimation
Cost Estimating
Engineering economic analysis is future based.
Future consequences (costs and benefits) of current decisions and require estimating.
Estimated costs and benefits are not known with certainty.
The more accurate the estimate, the more reliable the decision.
Difficulties arise due to an uncertain future.
Types of estimates:
Rough: gut level; Inaccurate; -30% to +60%.
Semi-detailed: based on historical records; Reasonably sophisticated and accurate; -15%
to +20%.
Detailed: based on specifications and cost models; Very accurate; -3% to +5%.
One-of-a-kind or first time projects: Few such projects in engineering economic analysis.
Estimator experience and knowledge è better quality (and more reliable)
estimates.
Estimating Cost Using Per-Unit Cost
Uses ―per unit factor to develop estimate
Very simple yet useful technique for rough estimates
Commonly used in construction industry
Examples:
Service cost per costumer
Safetyper employee
Gasoline cost per mile
Maintenance cost per window
Mileage cost per vehicle
Utility cost per square foot of floor space
Example: A contractor gave you a quote to build you a house for $250 per square
meter. What’s your cost to build a 200 sq. meter-house?
Ans. Cost = 250 x 200 = $50,000
(Estimating Cost Using WBS Cost (Segmenting Model
Work Breakdown Structure (WBS) is a graphical tool widely used in the
project planning process.
It organizes all of the project work by placing elements of work into
logical groupings; thus, providing a convenient and logical structure for
estimating the cost of each activity.
Cost Estimating Using Cost Indices
Governments usually publish cost index data for labor,
construction, and materials.
The best-known example is the consumer price index (CPI), a
measure of inflation.
The measure is scaled, so it is only the relative values of any two
measures that are meaningful.
For example, in 1920, the measure was about 20; in 1997 it was
about 160. The conclusion is that one would have to spend 160/20,
or 8 times as much in 1997 as in 1920 for the same consumables.
Cost indices work in the same way as price indices.
Cost indices are dimensionless.
Cost Estimating Using Cost Indices
Example 2-7:Miriam needs to estimate
annual labor cost for a new plant. For a
similar facility built 3 yrs ago, annual labor
cost was $2,455,000. CPI was at 544 3 yrs
ago but it is 715 today.
Estimating Benefits
For the most part, we can use exactly the same app
roach to estimate benefits as to estimate costs:
Fixed and variable benefits
Recurring and non-recurring benefits
Incremental benefits
Life-cycle benefits
Rough, semi-detailed, and detailed benefit estimates
Difficulties in estimation
Segmentation and index models
Major differences between benefit and cost estimation:
Costs are more likely to be underestimated
Benefits are most likely to be overestimated
Benefits tend to occur further in the future than costs
Cash Flow Diagram
Cash Flow Diagrams
A Cash Flow Diagram (CFD) summarizes the costs and benefits of a project
It illustrates the size, sign, and timing of individual cash flows
The time line is a horizontal line divided into equal periods such as days, months, or
years.
The end of one period is the beginning of the next one.
Each cash flow, such as a payment or receipt, is plotted along this line at the beginning
or end of the period in which it occurs.
Arrows: usual interpretation is positive (upward) for cash inflows (revenues) and
negative (Downward) for cash outflows (expenses).
Length of the arrow represents the magnitude ($) of the cash flow.
It is essential to use only one perspective in any CFD.
One person’s payment (cash outflow with – sign) is another
person’s receipt (cash inflow with + sign)
CFD Example
Categories of Cash Flows
1. First cost ≡ construction, purchase, or installation expense.
2. Operations and maintenance ≡ annual expense.
3. Salvage value ≡ receipt at project termination.
4. Revenues ≡ annual receipts due to sale of products.
5. Overhaul ≡ major capital expenditure occurring during life of
asset.
A concrete aggregate mix is required to contain at least 31% sand by
volume for proper batching. One source of material, which has 25%
sand and 75% coarse aggregate, sells for $3 per cubic meter (m3).
Another source, which has 40% sand and 60% coarse aggregate, sells
for $4.4/m3.
Determine the least cost per cubic meter of blended aggregates.
Example:
The least cost of blended aggregates will result from maximum use of the
lower-cost material. The higher-cost material will be used to increase the
proportion of sand up to the minimum level (31%) specified. ..
Let x = Portion of blended aggregates from $3.00/m3 source
1 - x =Portion of blended aggregates from $4.40/m3 source
Sand Balance
x(0.25) + (1 -x) (0.40) = 0.31
0.25x + 0.40- 0.04x =0.31 =0.60
Thus the blended aggregates will contain
60% of $3.00/m3 material
40% of $4.40/m3 material
Solution
The least cost per cubic meter of blended.aggregates.is
0.60($3.00) + 0.40($4.40) = 1.8+1.76
=$3.56/m3
Solution
A machine part is manufactured at a unit cost of 0.4$ for material
and 0.15$ for direct labor. An investment of $500,000 in tooling is
required. The order calls for 3 million pieces. Halfway through the
order, a new method of manufacture can be put into effect that wi11
reduce the unit costs to 0.34$ for material and 0.1$ for direct labor
but it will require 100,000$ for additional tooling. This tooling will
not be useful for future orders. Other costs are allocated at 2.5 times
the direct labor cost. What if anything, should be done?
Example:
Since there is only one way to handle first 1.5 million pieces, our problem
concerns only the second half of the order.
Alternative A: Continue with Present Method
Cost for remaining 1,500,000 pieces = $1,387,500
Solution
Material cost 1,500,000pieces x 0.4= $600,000
Direct labor cost 1,500,000pieces x 0.15= $225,000
Other costs 2.50 x direct labor cost = $562,500
Alternative B: Change the ManufacturingMethod
Cost for remaining 1,500,000 pieces = $1,135,000
Before making a final decision, one should closely examine the Other costs to
see that they do, in fact, vary as the Direct labor cost varies. Assuming they do,
the decision would be to change the manufacturing method.
Solution
Additional tooling $100,000
cost
Material cost 1,500,000pieces x 0.34= $510,000
Direct labor cost 1,500,000pieces x 0.1= $150,000
Other costs 2.50 x direct labor cost = $375,000
Next Class
Read Chapter 2 of textbook
Try to do some of the problems at end of Chapter 2
Next time we’ll start the mathematical part!

More Related Content

Similar to Engineering Cost & Estimation .pptx

Pmp integration chapter 4
Pmp integration chapter 4Pmp integration chapter 4
Pmp integration chapter 4
Ahmed Elshaboury,PMP,LEED GA
 
Engineering economics Slides for Postgraduates
Engineering economics Slides for PostgraduatesEngineering economics Slides for Postgraduates
Engineering economics Slides for Postgraduates
ssuser50050d1
 
Cost concepts and behaviours
Cost concepts and behavioursCost concepts and behaviours
Cost concepts and behaviours
Jai Vishal
 
Chapter 2 Managerial Accounting 15th edition by Garison
Chapter 2 Managerial Accounting 15th edition by Garison Chapter 2 Managerial Accounting 15th edition by Garison
Chapter 2 Managerial Accounting 15th edition by Garison
MuhammadUsman208471
 
2.Chapter two.pptx
2.Chapter two.pptx2.Chapter two.pptx
2.Chapter two.pptx
AberraBeri
 
Training on Financial and Economic Project Evaluation
Training on Financial and Economic Project Evaluation Training on Financial and Economic Project Evaluation
Training on Financial and Economic Project Evaluation tobiassommer2013
 
Cost Concepts.ppt
Cost Concepts.pptCost Concepts.ppt
Cost Concepts.ppt
Habibullah Qayumi
 
Evans_Analytics2e_ppt_11.pptx
Evans_Analytics2e_ppt_11.pptxEvans_Analytics2e_ppt_11.pptx
Evans_Analytics2e_ppt_11.pptx
Pandora36
 
Costs of Production
Costs of ProductionCosts of Production
Costs of Production
Dr. Shweta Uppadhyay
 
Engineering Economy - WEEK 1.pdf
Engineering Economy - WEEK 1.pdfEngineering Economy - WEEK 1.pdf
Engineering Economy - WEEK 1.pdf
nivine7
 
Ca 01
Ca 01Ca 01
Engineering economics (1)
Engineering economics (1)Engineering economics (1)
Engineering economics (1)
senthamarai kannan
 
ENGINEERING-ECONOMY.docx
ENGINEERING-ECONOMY.docxENGINEERING-ECONOMY.docx
ENGINEERING-ECONOMY.docx
NCCollegeofGeodeticE
 
Nce603 mod unit3
Nce603 mod unit3Nce603 mod unit3
Nce603 mod unit3
MODASSAR ANSARI
 
Costs functions
Costs functionsCosts functions
Costs functions
Dr. Shweta Uppadhyay
 
UNIT – I.ppt
UNIT – I.pptUNIT – I.ppt
UNIT – I.pptAsha A
 
Managerial Economics- Cost analysis and BEP Analysis notes
Managerial Economics- Cost analysis and BEP Analysis notesManagerial Economics- Cost analysis and BEP Analysis notes
Managerial Economics- Cost analysis and BEP Analysis notes
Dr. Durgaprasad Navulla
 
Job Order and Process Costin Accounting
Job Order and Process Costin AccountingJob Order and Process Costin Accounting
Job Order and Process Costin Accounting
Bahadir Beadin
 
Cost theory
Cost theoryCost theory
Cost theory
SAMINAKHAN72
 
Managerial Economics (Chapter 8 - Theory and Estimation of Cost)
Managerial Economics (Chapter 8 - Theory and Estimation of Cost)Managerial Economics (Chapter 8 - Theory and Estimation of Cost)
Managerial Economics (Chapter 8 - Theory and Estimation of Cost)
Nurul Shareena Misran
 

Similar to Engineering Cost & Estimation .pptx (20)

Pmp integration chapter 4
Pmp integration chapter 4Pmp integration chapter 4
Pmp integration chapter 4
 
Engineering economics Slides for Postgraduates
Engineering economics Slides for PostgraduatesEngineering economics Slides for Postgraduates
Engineering economics Slides for Postgraduates
 
Cost concepts and behaviours
Cost concepts and behavioursCost concepts and behaviours
Cost concepts and behaviours
 
Chapter 2 Managerial Accounting 15th edition by Garison
Chapter 2 Managerial Accounting 15th edition by Garison Chapter 2 Managerial Accounting 15th edition by Garison
Chapter 2 Managerial Accounting 15th edition by Garison
 
2.Chapter two.pptx
2.Chapter two.pptx2.Chapter two.pptx
2.Chapter two.pptx
 
Training on Financial and Economic Project Evaluation
Training on Financial and Economic Project Evaluation Training on Financial and Economic Project Evaluation
Training on Financial and Economic Project Evaluation
 
Cost Concepts.ppt
Cost Concepts.pptCost Concepts.ppt
Cost Concepts.ppt
 
Evans_Analytics2e_ppt_11.pptx
Evans_Analytics2e_ppt_11.pptxEvans_Analytics2e_ppt_11.pptx
Evans_Analytics2e_ppt_11.pptx
 
Costs of Production
Costs of ProductionCosts of Production
Costs of Production
 
Engineering Economy - WEEK 1.pdf
Engineering Economy - WEEK 1.pdfEngineering Economy - WEEK 1.pdf
Engineering Economy - WEEK 1.pdf
 
Ca 01
Ca 01Ca 01
Ca 01
 
Engineering economics (1)
Engineering economics (1)Engineering economics (1)
Engineering economics (1)
 
ENGINEERING-ECONOMY.docx
ENGINEERING-ECONOMY.docxENGINEERING-ECONOMY.docx
ENGINEERING-ECONOMY.docx
 
Nce603 mod unit3
Nce603 mod unit3Nce603 mod unit3
Nce603 mod unit3
 
Costs functions
Costs functionsCosts functions
Costs functions
 
UNIT – I.ppt
UNIT – I.pptUNIT – I.ppt
UNIT – I.ppt
 
Managerial Economics- Cost analysis and BEP Analysis notes
Managerial Economics- Cost analysis and BEP Analysis notesManagerial Economics- Cost analysis and BEP Analysis notes
Managerial Economics- Cost analysis and BEP Analysis notes
 
Job Order and Process Costin Accounting
Job Order and Process Costin AccountingJob Order and Process Costin Accounting
Job Order and Process Costin Accounting
 
Cost theory
Cost theoryCost theory
Cost theory
 
Managerial Economics (Chapter 8 - Theory and Estimation of Cost)
Managerial Economics (Chapter 8 - Theory and Estimation of Cost)Managerial Economics (Chapter 8 - Theory and Estimation of Cost)
Managerial Economics (Chapter 8 - Theory and Estimation of Cost)
 

More from SAMIRDE6

15800721104-PCME501 (1).pptx
15800721104-PCME501 (1).pptx15800721104-PCME501 (1).pptx
15800721104-PCME501 (1).pptx
SAMIRDE6
 
Renewable Energy Source .pptx
Renewable Energy Source .pptxRenewable Energy Source .pptx
Renewable Energy Source .pptx
SAMIRDE6
 
Engine Cooling System.pptx
Engine Cooling System.pptxEngine Cooling System.pptx
Engine Cooling System.pptx
SAMIRDE6
 
Water Jet Machine .pptx
Water Jet Machine .pptxWater Jet Machine .pptx
Water Jet Machine .pptx
SAMIRDE6
 
Jet Machine .pptx
Jet Machine .pptxJet Machine .pptx
Jet Machine .pptx
SAMIRDE6
 
Water Jet Machine.pptx
Water Jet Machine.pptxWater Jet Machine.pptx
Water Jet Machine.pptx
SAMIRDE6
 

More from SAMIRDE6 (6)

15800721104-PCME501 (1).pptx
15800721104-PCME501 (1).pptx15800721104-PCME501 (1).pptx
15800721104-PCME501 (1).pptx
 
Renewable Energy Source .pptx
Renewable Energy Source .pptxRenewable Energy Source .pptx
Renewable Energy Source .pptx
 
Engine Cooling System.pptx
Engine Cooling System.pptxEngine Cooling System.pptx
Engine Cooling System.pptx
 
Water Jet Machine .pptx
Water Jet Machine .pptxWater Jet Machine .pptx
Water Jet Machine .pptx
 
Jet Machine .pptx
Jet Machine .pptxJet Machine .pptx
Jet Machine .pptx
 
Water Jet Machine.pptx
Water Jet Machine.pptxWater Jet Machine.pptx
Water Jet Machine.pptx
 

Recently uploaded

一比一原版(UIUC毕业证)伊利诺伊大学|厄巴纳-香槟分校毕业证如何办理
一比一原版(UIUC毕业证)伊利诺伊大学|厄巴纳-香槟分校毕业证如何办理一比一原版(UIUC毕业证)伊利诺伊大学|厄巴纳-香槟分校毕业证如何办理
一比一原版(UIUC毕业证)伊利诺伊大学|厄巴纳-香槟分校毕业证如何办理
ahzuo
 
原版制作(Deakin毕业证书)迪肯大学毕业证学位证一模一样
原版制作(Deakin毕业证书)迪肯大学毕业证学位证一模一样原版制作(Deakin毕业证书)迪肯大学毕业证学位证一模一样
原版制作(Deakin毕业证书)迪肯大学毕业证学位证一模一样
u86oixdj
 
一比一原版(Coventry毕业证书)考文垂大学毕业证如何办理
一比一原版(Coventry毕业证书)考文垂大学毕业证如何办理一比一原版(Coventry毕业证书)考文垂大学毕业证如何办理
一比一原版(Coventry毕业证书)考文垂大学毕业证如何办理
74nqk8xf
 
一比一原版(UVic毕业证)维多利亚大学毕业证成绩单
一比一原版(UVic毕业证)维多利亚大学毕业证成绩单一比一原版(UVic毕业证)维多利亚大学毕业证成绩单
一比一原版(UVic毕业证)维多利亚大学毕业证成绩单
ukgaet
 
做(mqu毕业证书)麦考瑞大学毕业证硕士文凭证书学费发票原版一模一样
做(mqu毕业证书)麦考瑞大学毕业证硕士文凭证书学费发票原版一模一样做(mqu毕业证书)麦考瑞大学毕业证硕士文凭证书学费发票原版一模一样
做(mqu毕业证书)麦考瑞大学毕业证硕士文凭证书学费发票原版一模一样
axoqas
 
Predicting Product Ad Campaign Performance: A Data Analysis Project Presentation
Predicting Product Ad Campaign Performance: A Data Analysis Project PresentationPredicting Product Ad Campaign Performance: A Data Analysis Project Presentation
Predicting Product Ad Campaign Performance: A Data Analysis Project Presentation
Boston Institute of Analytics
 
一比一原版(RUG毕业证)格罗宁根大学毕业证成绩单
一比一原版(RUG毕业证)格罗宁根大学毕业证成绩单一比一原版(RUG毕业证)格罗宁根大学毕业证成绩单
一比一原版(RUG毕业证)格罗宁根大学毕业证成绩单
vcaxypu
 
Levelwise PageRank with Loop-Based Dead End Handling Strategy : SHORT REPORT ...
Levelwise PageRank with Loop-Based Dead End Handling Strategy : SHORT REPORT ...Levelwise PageRank with Loop-Based Dead End Handling Strategy : SHORT REPORT ...
Levelwise PageRank with Loop-Based Dead End Handling Strategy : SHORT REPORT ...
Subhajit Sahu
 
Malana- Gimlet Market Analysis (Portfolio 2)
Malana- Gimlet Market Analysis (Portfolio 2)Malana- Gimlet Market Analysis (Portfolio 2)
Malana- Gimlet Market Analysis (Portfolio 2)
TravisMalana
 
Quantitative Data AnalysisReliability Analysis (Cronbach Alpha) Common Method...
Quantitative Data AnalysisReliability Analysis (Cronbach Alpha) Common Method...Quantitative Data AnalysisReliability Analysis (Cronbach Alpha) Common Method...
Quantitative Data AnalysisReliability Analysis (Cronbach Alpha) Common Method...
2023240532
 
一比一原版(UofM毕业证)明尼苏达大学毕业证成绩单
一比一原版(UofM毕业证)明尼苏达大学毕业证成绩单一比一原版(UofM毕业证)明尼苏达大学毕业证成绩单
一比一原版(UofM毕业证)明尼苏达大学毕业证成绩单
ewymefz
 
一比一原版(YU毕业证)约克大学毕业证成绩单
一比一原版(YU毕业证)约克大学毕业证成绩单一比一原版(YU毕业证)约克大学毕业证成绩单
一比一原版(YU毕业证)约克大学毕业证成绩单
enxupq
 
一比一原版(CBU毕业证)卡普顿大学毕业证成绩单
一比一原版(CBU毕业证)卡普顿大学毕业证成绩单一比一原版(CBU毕业证)卡普顿大学毕业证成绩单
一比一原版(CBU毕业证)卡普顿大学毕业证成绩单
nscud
 
06-04-2024 - NYC Tech Week - Discussion on Vector Databases, Unstructured Dat...
06-04-2024 - NYC Tech Week - Discussion on Vector Databases, Unstructured Dat...06-04-2024 - NYC Tech Week - Discussion on Vector Databases, Unstructured Dat...
06-04-2024 - NYC Tech Week - Discussion on Vector Databases, Unstructured Dat...
Timothy Spann
 
一比一原版(IIT毕业证)伊利诺伊理工大学毕业证成绩单
一比一原版(IIT毕业证)伊利诺伊理工大学毕业证成绩单一比一原版(IIT毕业证)伊利诺伊理工大学毕业证成绩单
一比一原版(IIT毕业证)伊利诺伊理工大学毕业证成绩单
ewymefz
 
Machine learning and optimization techniques for electrical drives.pptx
Machine learning and optimization techniques for electrical drives.pptxMachine learning and optimization techniques for electrical drives.pptx
Machine learning and optimization techniques for electrical drives.pptx
balafet
 
一比一原版(Deakin毕业证书)迪肯大学毕业证如何办理
一比一原版(Deakin毕业证书)迪肯大学毕业证如何办理一比一原版(Deakin毕业证书)迪肯大学毕业证如何办理
一比一原版(Deakin毕业证书)迪肯大学毕业证如何办理
oz8q3jxlp
 
一比一原版(爱大毕业证书)爱丁堡大学毕业证如何办理
一比一原版(爱大毕业证书)爱丁堡大学毕业证如何办理一比一原版(爱大毕业证书)爱丁堡大学毕业证如何办理
一比一原版(爱大毕业证书)爱丁堡大学毕业证如何办理
g4dpvqap0
 
My burning issue is homelessness K.C.M.O.
My burning issue is homelessness K.C.M.O.My burning issue is homelessness K.C.M.O.
My burning issue is homelessness K.C.M.O.
rwarrenll
 
【社内勉強会資料_Octo: An Open-Source Generalist Robot Policy】
【社内勉強会資料_Octo: An Open-Source Generalist Robot Policy】【社内勉強会資料_Octo: An Open-Source Generalist Robot Policy】
【社内勉強会資料_Octo: An Open-Source Generalist Robot Policy】
NABLAS株式会社
 

Recently uploaded (20)

一比一原版(UIUC毕业证)伊利诺伊大学|厄巴纳-香槟分校毕业证如何办理
一比一原版(UIUC毕业证)伊利诺伊大学|厄巴纳-香槟分校毕业证如何办理一比一原版(UIUC毕业证)伊利诺伊大学|厄巴纳-香槟分校毕业证如何办理
一比一原版(UIUC毕业证)伊利诺伊大学|厄巴纳-香槟分校毕业证如何办理
 
原版制作(Deakin毕业证书)迪肯大学毕业证学位证一模一样
原版制作(Deakin毕业证书)迪肯大学毕业证学位证一模一样原版制作(Deakin毕业证书)迪肯大学毕业证学位证一模一样
原版制作(Deakin毕业证书)迪肯大学毕业证学位证一模一样
 
一比一原版(Coventry毕业证书)考文垂大学毕业证如何办理
一比一原版(Coventry毕业证书)考文垂大学毕业证如何办理一比一原版(Coventry毕业证书)考文垂大学毕业证如何办理
一比一原版(Coventry毕业证书)考文垂大学毕业证如何办理
 
一比一原版(UVic毕业证)维多利亚大学毕业证成绩单
一比一原版(UVic毕业证)维多利亚大学毕业证成绩单一比一原版(UVic毕业证)维多利亚大学毕业证成绩单
一比一原版(UVic毕业证)维多利亚大学毕业证成绩单
 
做(mqu毕业证书)麦考瑞大学毕业证硕士文凭证书学费发票原版一模一样
做(mqu毕业证书)麦考瑞大学毕业证硕士文凭证书学费发票原版一模一样做(mqu毕业证书)麦考瑞大学毕业证硕士文凭证书学费发票原版一模一样
做(mqu毕业证书)麦考瑞大学毕业证硕士文凭证书学费发票原版一模一样
 
Predicting Product Ad Campaign Performance: A Data Analysis Project Presentation
Predicting Product Ad Campaign Performance: A Data Analysis Project PresentationPredicting Product Ad Campaign Performance: A Data Analysis Project Presentation
Predicting Product Ad Campaign Performance: A Data Analysis Project Presentation
 
一比一原版(RUG毕业证)格罗宁根大学毕业证成绩单
一比一原版(RUG毕业证)格罗宁根大学毕业证成绩单一比一原版(RUG毕业证)格罗宁根大学毕业证成绩单
一比一原版(RUG毕业证)格罗宁根大学毕业证成绩单
 
Levelwise PageRank with Loop-Based Dead End Handling Strategy : SHORT REPORT ...
Levelwise PageRank with Loop-Based Dead End Handling Strategy : SHORT REPORT ...Levelwise PageRank with Loop-Based Dead End Handling Strategy : SHORT REPORT ...
Levelwise PageRank with Loop-Based Dead End Handling Strategy : SHORT REPORT ...
 
Malana- Gimlet Market Analysis (Portfolio 2)
Malana- Gimlet Market Analysis (Portfolio 2)Malana- Gimlet Market Analysis (Portfolio 2)
Malana- Gimlet Market Analysis (Portfolio 2)
 
Quantitative Data AnalysisReliability Analysis (Cronbach Alpha) Common Method...
Quantitative Data AnalysisReliability Analysis (Cronbach Alpha) Common Method...Quantitative Data AnalysisReliability Analysis (Cronbach Alpha) Common Method...
Quantitative Data AnalysisReliability Analysis (Cronbach Alpha) Common Method...
 
一比一原版(UofM毕业证)明尼苏达大学毕业证成绩单
一比一原版(UofM毕业证)明尼苏达大学毕业证成绩单一比一原版(UofM毕业证)明尼苏达大学毕业证成绩单
一比一原版(UofM毕业证)明尼苏达大学毕业证成绩单
 
一比一原版(YU毕业证)约克大学毕业证成绩单
一比一原版(YU毕业证)约克大学毕业证成绩单一比一原版(YU毕业证)约克大学毕业证成绩单
一比一原版(YU毕业证)约克大学毕业证成绩单
 
一比一原版(CBU毕业证)卡普顿大学毕业证成绩单
一比一原版(CBU毕业证)卡普顿大学毕业证成绩单一比一原版(CBU毕业证)卡普顿大学毕业证成绩单
一比一原版(CBU毕业证)卡普顿大学毕业证成绩单
 
06-04-2024 - NYC Tech Week - Discussion on Vector Databases, Unstructured Dat...
06-04-2024 - NYC Tech Week - Discussion on Vector Databases, Unstructured Dat...06-04-2024 - NYC Tech Week - Discussion on Vector Databases, Unstructured Dat...
06-04-2024 - NYC Tech Week - Discussion on Vector Databases, Unstructured Dat...
 
一比一原版(IIT毕业证)伊利诺伊理工大学毕业证成绩单
一比一原版(IIT毕业证)伊利诺伊理工大学毕业证成绩单一比一原版(IIT毕业证)伊利诺伊理工大学毕业证成绩单
一比一原版(IIT毕业证)伊利诺伊理工大学毕业证成绩单
 
Machine learning and optimization techniques for electrical drives.pptx
Machine learning and optimization techniques for electrical drives.pptxMachine learning and optimization techniques for electrical drives.pptx
Machine learning and optimization techniques for electrical drives.pptx
 
一比一原版(Deakin毕业证书)迪肯大学毕业证如何办理
一比一原版(Deakin毕业证书)迪肯大学毕业证如何办理一比一原版(Deakin毕业证书)迪肯大学毕业证如何办理
一比一原版(Deakin毕业证书)迪肯大学毕业证如何办理
 
一比一原版(爱大毕业证书)爱丁堡大学毕业证如何办理
一比一原版(爱大毕业证书)爱丁堡大学毕业证如何办理一比一原版(爱大毕业证书)爱丁堡大学毕业证如何办理
一比一原版(爱大毕业证书)爱丁堡大学毕业证如何办理
 
My burning issue is homelessness K.C.M.O.
My burning issue is homelessness K.C.M.O.My burning issue is homelessness K.C.M.O.
My burning issue is homelessness K.C.M.O.
 
【社内勉強会資料_Octo: An Open-Source Generalist Robot Policy】
【社内勉強会資料_Octo: An Open-Source Generalist Robot Policy】【社内勉強会資料_Octo: An Open-Source Generalist Robot Policy】
【社内勉強会資料_Octo: An Open-Source Generalist Robot Policy】
 

Engineering Cost & Estimation .pptx

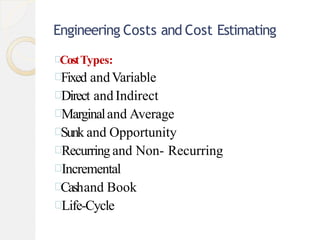
  • 1. Engineering Costs and Cost Estimating CostTypes: Fixed andVariable Direct and Indirect Marginaland Average Sunk and Opportunity Recurring and Non- Recurring Incremental Cashand Book Life-Cycle
  • 2. Engineering Costs and Cost Estimating Estimating Costs: Per-Unit Model WBS Model Cost Indices Estimating Benefits Cash Flow Diagrams
  • 4. Engineering Costs and Cost Estimating Engineering Costs: Value of the economic resources used in the production of goods and services. Examples: Land, labor, capital or initial investment, wages and salaries, material purchases, utilities Cost estimating: Approximating the cost of resources or activities Cost estimating is necessary for any economic analysis Key Question: Where do the numbers we use in an engineering economic analysis come from? When working in industry, you may need to consult with professional accountants to obtain such information
  • 5. Classification of Costs Fixed Costs: Costs that do not vary (i.e., constant and unchanging regardless of the level of the activity. Variable Costs: Costs that vary in total with the quantity of output or other measures of activity level. Total Cost is the sum of Fixed Cost and Variable Cost. Direct Costs: Cost that can be reasonably measured and allocated to a specific output or work activity. Indirect/Overhead Cost: Cost that it is difficult to attribute or allocate to a specific output or work activity.
  • 6. Example 2-1 Amin plans to charter a bus to take people to see some event show in the city. He categorized his costs at shown below: Which of the costs are fixed and which are variablecosts? How do we compute Amin’s total cost if he takes n people to City? Total Cost = Fixed cost + Variable cost =$225 + $20 n
  • 7. Average and Marginal Costs Average Cost: Computed as total cost divided by the number of units produced. Marginal Cost: The change in total cost that arises when the quantity produced changes by one unit; i.e. the cost to produce one more unit. Avg. Cost = TC/n = ($225+$20n)/n For n = 33, TC = $885 Avg. Cost = $885/30 = $29.50 Total cost can be calculated from an average cost value For n =35: ¨ TC ¹ 35*($29.50) = $ 1,032.50
  • 8. Example 2-2 Do we have enough information yet to decide how much money Amin will make on his venture? What else must we know? Amin needs to know his total revenue Amin knows that similar ventures in the past have charged $35 per person, so that is what he decides to charge Total Revenue = 35n (for n people) Total profit = Total Revenue – Total Cost 35n – (225 + 20n) = 15n – 225 Question: How many people does Amin need to break even? (not lose money on his venture) Solve: 15 n – 225 = 0 => n=15 more than 15, he makes money
  • 9. BreakevenAnalysis Where is the Loss Region? Where is the Profit Region? Where is the Breakeven Point? It is the point where total revenue received equals total costs associated with the sale of the product
  • 10. Profit and Loss Terms (non-linear cost and revenue) Total revenue = Unit price x units sold Breakeven: total revenue = total costs Just getting by Profitregion: total revenue > total costs Putting money in the bank Lossregion: total revenue < total costs Going into debt
  • 11. Sunk (Past) Costs A sunk cost is money already spent due to a pastdecision. As engineering economists we deal with present and future opportunities We must be careful not to be influenced by the past Disregard sunk costs in engineering economic analysis Example: Suppose that three years ago you bought a laptop PC for $2,000. How likely is it that you can sell it today for what it cost? Suppose you can sell the laptop today for $400. Does the $2000 purchase cost have any effect on the selling price today? The $2,000 is a sunk cost. It has no influence on the present opportunity to sell the laptop for $400.
  • 12. Opportunity (Future) Cost An opportunity cost is a benefit that is foregone by engaging a business resource in a chosen activity instead of engaging that same resource in the foregone activity. Example: Suppose your wealthy uncle gives you $75,000 when you graduate from high school. It is enough to put you through college (5 years at $15,000 per year). It is also enough for you to open a business making web pages for small companies instead of going to college. You estimate you would make $20,000 per year with this business. If you decide to go to college you give up the opportunity to make $20,000 per year Your opportunity cost is $20,000 Your total cost per year is $35,000
  • 13. Recurring and Non-Recurring Costs Recurring costs are those expenses that are known, anticipated, and occur at regular intervals. These costs can be modeled as cash flows. Non-recurring costs are one-of-a-kind (one-time) event that occurs at irregular intervals. They are difficult to plan for or anticipate. Example: A company decided to landscape a lot of ground and then care for it. Which are recurring and which are non-recurring costs the company incur? Remove existing trees, vegetation Have land graded with bulldozer Have yard planted with grass Plant shrubs, trees Mow grass Fertilize grass, shrubs Water grass, shrubs
  • 14. Incremental Cost Incremental Cost is the additional cost that results from selecting one alternative over another. It is the difference in cost between two alternative investments or activities.
  • 16. Solution Let's look more closely at each of the data items. Distributor's purchase price 3 years ago: This is a sunk cost that should not be considered in setting the price today. Distributor's storage costs to date: The storage costs for keeping the pumps in inventory are sunk costs; that is, they have been paid. Hence they should not influence the pricing decision.
  • 17. Solution Distributor's list price 3 years ago: If there have been no willing buyers in the past 3 years at this price, it is unlikely that a buyer will emerge in the future. This past list price should have no influence on the current pricing decision. Current list price of newer pumps: Newer pumps now include technology and features that have made the older pumps less valuable. Directly comparing the older pumps to those with new technology is misleading. However, the price of the new pumps and the value of the new features help determine the market value of the old pumps.
  • 18. Solution Amount offered from a buyer 2 years ago: This is a forgone opportunity. At the time of the offer, the company chose to keep the lot and thus the $5000 offered became an opportunity cost for keeping the pumps. This amount should not influence the current pricing decision. Current price the lot could bring: The price a willing buyer in the marketplace offers is called the asset's market value. The lot of old pumps in question is believed to have a current market value of $3000.
  • 19. Cash Costs vs. Book Costs Cash Costs: require the cash transaction of dollars out of one person’s pocket into the pocket of someone else. Book Costs: cost of a past transaction that is recorded in a book (accounting book) of a firm. Do not represent cash flows Not included in engineering economic analysis One exception is for asset depreciation (used for tax purposes) Example: You got offers to sell your car for $6,000 (i.e., the book value of your car is $6,000). The book value can be thought of as the book cost. If you actually sell the car to a friend for $5,500, then the cash cost to your friend is $5,500.
  • 20. Life-Cycle Costs Life-cycle Costs are the summation of all costs, both recurring and nonrecurring, related to a product, structure, system, or service during its lifetime. Products go through a life cycle in phases: 1. Assessment & Justification 2. Conceptual or Preliminary Design 3. Detailed Design 4. Production or Construction 5. Operational Use 6. Decline and Retirement Engineers should consider all life-cycle costs when designing products and the systems that produce them. About 70-90% of all costs are set during the design phases when only 10-30% of cumulative life-cycle costs have been spent.
  • 22. Cost Estimating Engineering economic analysis is future based. Future consequences (costs and benefits) of current decisions and require estimating. Estimated costs and benefits are not known with certainty. The more accurate the estimate, the more reliable the decision. Difficulties arise due to an uncertain future. Types of estimates: Rough: gut level; Inaccurate; -30% to +60%. Semi-detailed: based on historical records; Reasonably sophisticated and accurate; -15% to +20%. Detailed: based on specifications and cost models; Very accurate; -3% to +5%. One-of-a-kind or first time projects: Few such projects in engineering economic analysis. Estimator experience and knowledge è better quality (and more reliable) estimates.
  • 23. Estimating Cost Using Per-Unit Cost Uses ―per unit factor to develop estimate Very simple yet useful technique for rough estimates Commonly used in construction industry Examples: Service cost per costumer Safetyper employee Gasoline cost per mile Maintenance cost per window Mileage cost per vehicle Utility cost per square foot of floor space Example: A contractor gave you a quote to build you a house for $250 per square meter. What’s your cost to build a 200 sq. meter-house? Ans. Cost = 250 x 200 = $50,000
  • 24. (Estimating Cost Using WBS Cost (Segmenting Model Work Breakdown Structure (WBS) is a graphical tool widely used in the project planning process. It organizes all of the project work by placing elements of work into logical groupings; thus, providing a convenient and logical structure for estimating the cost of each activity.
  • 25. Cost Estimating Using Cost Indices Governments usually publish cost index data for labor, construction, and materials. The best-known example is the consumer price index (CPI), a measure of inflation. The measure is scaled, so it is only the relative values of any two measures that are meaningful. For example, in 1920, the measure was about 20; in 1997 it was about 160. The conclusion is that one would have to spend 160/20, or 8 times as much in 1997 as in 1920 for the same consumables. Cost indices work in the same way as price indices. Cost indices are dimensionless.
  • 26. Cost Estimating Using Cost Indices Example 2-7:Miriam needs to estimate annual labor cost for a new plant. For a similar facility built 3 yrs ago, annual labor cost was $2,455,000. CPI was at 544 3 yrs ago but it is 715 today.
  • 27. Estimating Benefits For the most part, we can use exactly the same app roach to estimate benefits as to estimate costs: Fixed and variable benefits Recurring and non-recurring benefits Incremental benefits Life-cycle benefits Rough, semi-detailed, and detailed benefit estimates Difficulties in estimation Segmentation and index models Major differences between benefit and cost estimation: Costs are more likely to be underestimated Benefits are most likely to be overestimated Benefits tend to occur further in the future than costs
  • 29. Cash Flow Diagrams A Cash Flow Diagram (CFD) summarizes the costs and benefits of a project It illustrates the size, sign, and timing of individual cash flows The time line is a horizontal line divided into equal periods such as days, months, or years. The end of one period is the beginning of the next one. Each cash flow, such as a payment or receipt, is plotted along this line at the beginning or end of the period in which it occurs. Arrows: usual interpretation is positive (upward) for cash inflows (revenues) and negative (Downward) for cash outflows (expenses). Length of the arrow represents the magnitude ($) of the cash flow. It is essential to use only one perspective in any CFD. One person’s payment (cash outflow with – sign) is another person’s receipt (cash inflow with + sign)
  • 31. Categories of Cash Flows 1. First cost ≡ construction, purchase, or installation expense. 2. Operations and maintenance ≡ annual expense. 3. Salvage value ≡ receipt at project termination. 4. Revenues ≡ annual receipts due to sale of products. 5. Overhaul ≡ major capital expenditure occurring during life of asset.
  • 32. A concrete aggregate mix is required to contain at least 31% sand by volume for proper batching. One source of material, which has 25% sand and 75% coarse aggregate, sells for $3 per cubic meter (m3). Another source, which has 40% sand and 60% coarse aggregate, sells for $4.4/m3. Determine the least cost per cubic meter of blended aggregates. Example:
  • 33. The least cost of blended aggregates will result from maximum use of the lower-cost material. The higher-cost material will be used to increase the proportion of sand up to the minimum level (31%) specified. .. Let x = Portion of blended aggregates from $3.00/m3 source 1 - x =Portion of blended aggregates from $4.40/m3 source Sand Balance x(0.25) + (1 -x) (0.40) = 0.31 0.25x + 0.40- 0.04x =0.31 =0.60 Thus the blended aggregates will contain 60% of $3.00/m3 material 40% of $4.40/m3 material Solution
  • 34. The least cost per cubic meter of blended.aggregates.is 0.60($3.00) + 0.40($4.40) = 1.8+1.76 =$3.56/m3 Solution
  • 35. A machine part is manufactured at a unit cost of 0.4$ for material and 0.15$ for direct labor. An investment of $500,000 in tooling is required. The order calls for 3 million pieces. Halfway through the order, a new method of manufacture can be put into effect that wi11 reduce the unit costs to 0.34$ for material and 0.1$ for direct labor but it will require 100,000$ for additional tooling. This tooling will not be useful for future orders. Other costs are allocated at 2.5 times the direct labor cost. What if anything, should be done? Example:
  • 36. Since there is only one way to handle first 1.5 million pieces, our problem concerns only the second half of the order. Alternative A: Continue with Present Method Cost for remaining 1,500,000 pieces = $1,387,500 Solution Material cost 1,500,000pieces x 0.4= $600,000 Direct labor cost 1,500,000pieces x 0.15= $225,000 Other costs 2.50 x direct labor cost = $562,500
  • 37. Alternative B: Change the ManufacturingMethod Cost for remaining 1,500,000 pieces = $1,135,000 Before making a final decision, one should closely examine the Other costs to see that they do, in fact, vary as the Direct labor cost varies. Assuming they do, the decision would be to change the manufacturing method. Solution Additional tooling $100,000 cost Material cost 1,500,000pieces x 0.34= $510,000 Direct labor cost 1,500,000pieces x 0.1= $150,000 Other costs 2.50 x direct labor cost = $375,000
  • 38. Next Class Read Chapter 2 of textbook Try to do some of the problems at end of Chapter 2 Next time we’ll start the mathematical part!