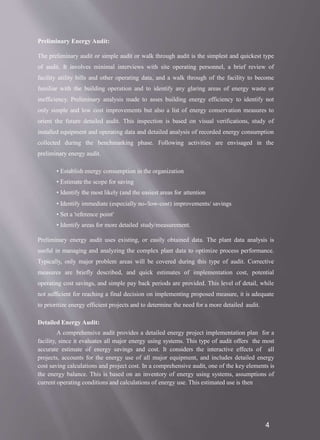
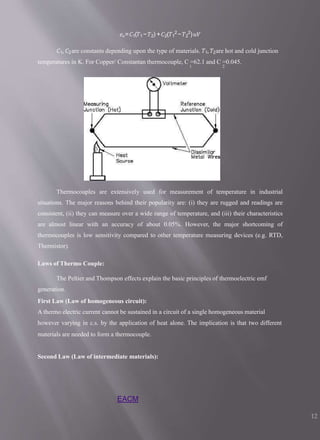
The document provides an extensive overview of energy audits, defining it as a systematic approach to energy management that assesses current energy consumption in facilities, identifies inefficiencies, and recommends improvements. It outlines the objectives, types (preliminary and detailed audits), methodologies, and phases of conducting an audit, emphasizing the importance of energy conservation for operational cost reduction. The document also discusses energy indices and conservation strategies, categorizing them into short-term, medium-term, and long-term schemes for effective energy management.


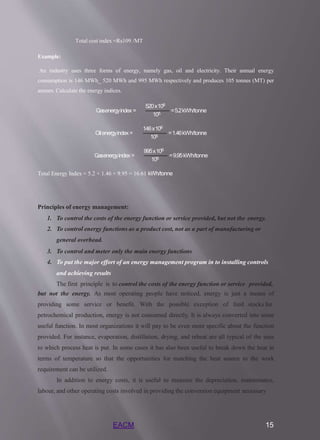


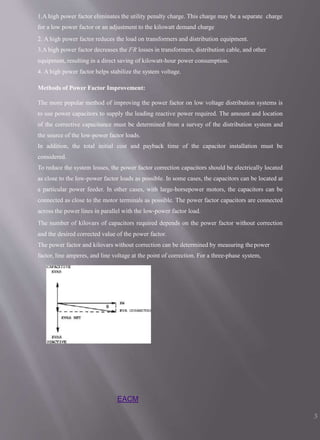


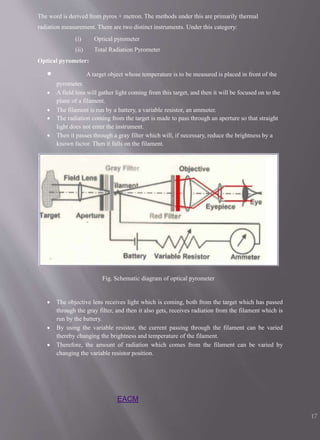


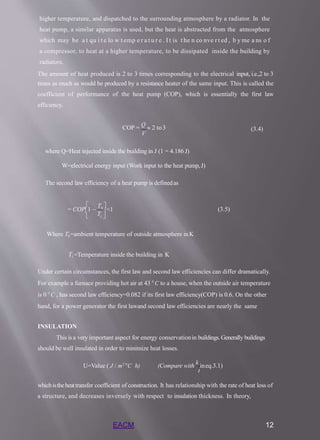

![made over the same life span, then the cost alternative having shorter life span will result in
lower equivalent present worth i.e. lower cost than the cost alternative having longer life span.
The two approaches used for economic comparison of different life span alternatives are
as follows;
i) Comparison of mutually exclusive alternatives over a time period that is equal to least
common multiple (LCM) of the individual life spans
Comparison of mutually exclusive alternatives over a study period which is not
necessarily equal to the life span of any of thealternatives.
ii)
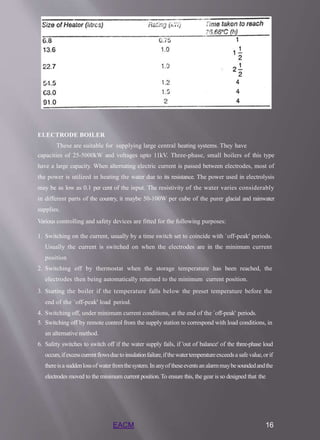
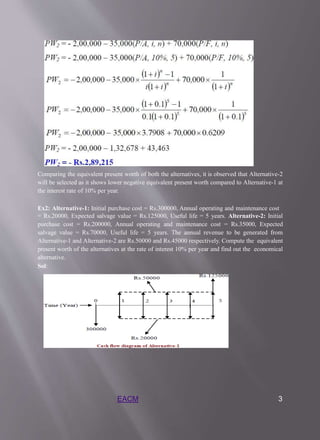
Ex3: The alternatives are from two different manufacturing companies for purchasing a machine.
The cash flow details of the alternatives are as follows; Alternative-1: Initial purchase price =
Rs.1000000, Annual operating cost = Rs.10000, Expected annual income = Rs.175000, Expected
salvage value = Rs.200000, Useful life = 10 years. Alternative-2: Initial purchase price =
Rs.700000, Annual operating cost = Rs.15000, Expected annual income = Rs.165000, Expected
salvage value = Rs.250000, Useful life = 5 years. Using present worth method, find out the most
economical alternative at the interest rate of 10% per year.
Sol: The alternatives have different life spans i.e. 10 years and 5 years. Thus the comparison will
be made over a time period equal to the least common multiple of the life spans of the
alternatives. In this case the least common multiple of the life spans is 10 years. Thus the cash
flow of Alternative-1 will be analyzed for one cycle (duration of 10 years) whereas the cash flow
of Alternative-2 will be analyzed for two cycles (duration of 5 years for each cycle). The cash
flow of the Alternative-2 for the second cycle will be exactly same as that in the first cycle.
𝑃𝑊1 =−1000000+(175000−10000)[
(1 +𝑖)𝑛−1
𝑖(1+𝑖)𝑛
1
] +200000[(1 +𝑖)𝑛]
EACM 5](https://image.slidesharecdn.com/eacmnotes-210924041811/85/Energy-audit-107-320.jpg)
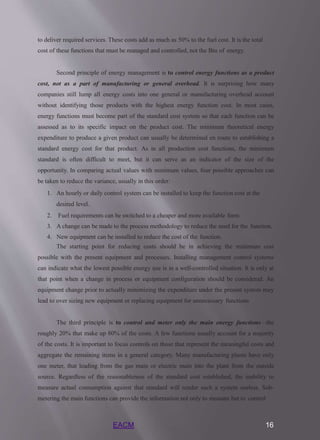
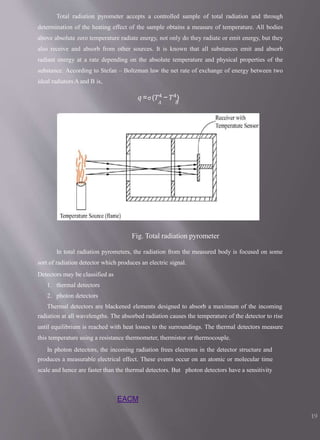
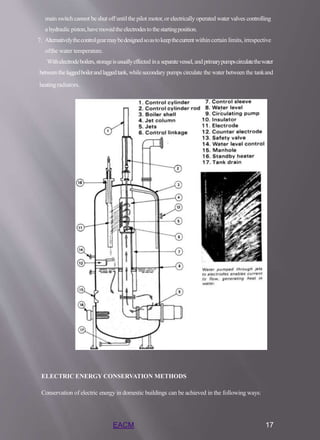
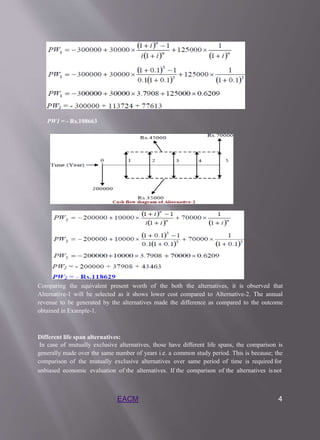
![𝑷 𝑾𝟐 =−𝟕𝟎𝟎𝟎𝟎𝟎+(𝟏𝟔𝟓𝟎𝟎𝟎−𝟏𝟓𝟎𝟎𝟎)[
(1 +𝑖)𝑛−1
𝑖(1+𝑖)𝑛
1
] +(700000−250000)[(1+𝑖)5]
1
+250000[(1+𝑖)10]
Thus from the comparison of equivalent present worth of the alternatives, it is evident that
Alternative-1 will be selected for purchase of the compression testing machine as it shows the
higher positive equivalent present worth.
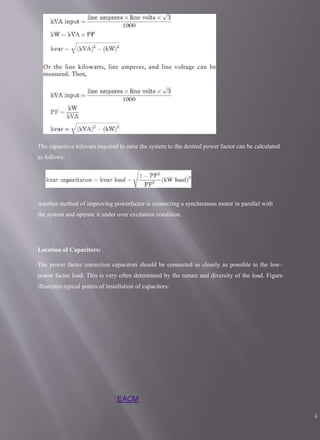
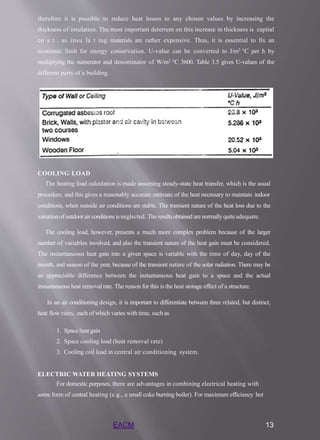
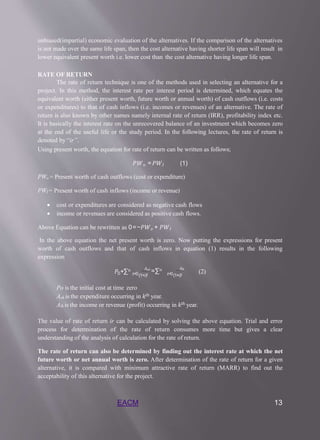
RETURN ON INVESTMENT
Return on investment (ROI) is a measure that investigates the amount of additional
profits produced due to a certain investment. Businesses use this calculation to compare different
scenarios for investments to see which would produce the greatest profit and benefit for the
company.
However, this calculation can also be used to analyze the best scenario for other forms of
investment, such as if someone wishes to purchase a car, buy a computer, pay for college, etc.
The simplest form of the formula for ROI involves only two values: the cost of the investment
and the gain from the investment. The formula is as follows:
𝑅𝑂𝐼 (%) =Gain from Investment −Cost ofInvestment
×100
Cost of Investment
The ratio is multiplied by 100, making it a percent. This way, a person is able to see what
percentage of their investment has been gained back after a period of time. Some, however, prefer
to leave it in decimal form, or ratio form.
EACM 6](https://image.slidesharecdn.com/eacmnotes-210924041811/85/Energy-audit-108-320.jpg)


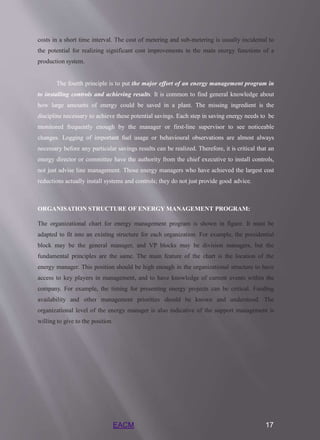
![In this method it is assumed that money is deposited in a sinking fund over the useful life that
will enable to replace the asset at the end of its useful life. For this purpose, a fixed amount is set
aside every year/month from the revenue generated (profit obtained) and this fixed sum is
considered to earn interest at an interest rate compounded annually over the useful life of the
asset, so that the total amount accumulated at the end of useful life is equal to the total
depreciation amount (initial cost less salvage value of the asset).
Thus the annual depreciation in any year has two components.
1. fixed sum that is deposited into the sinking fund
2. the interest earned on the amount accumulated in sinking fund till the beginning of that
year.
For this purpose, first the uniform depreciation amount (i.e. fixed amount deposited in sinking
fund) at the end of each year is calculated by multiplying the total depreciation amount (i.e.
initial cost less salvage value) over the useful life by sinking fund factor.
𝑖
𝐴𝑛𝑛𝑢𝑎𝑙 𝑑𝑒𝑝𝑟𝑒𝑐𝑖𝑎𝑡𝑖𝑜𝑛=(𝑑𝑒𝑝𝑟𝑒𝑐𝑖𝑎𝑏𝑙𝑒𝑐𝑜𝑠𝑡)
(1 +𝑖)𝑛
Where i = interest rate per year
Depreciation amount for mth year = A(1 +𝑖)𝑚
After that the interest earned on the accumulated amount is calculated. The calculations are
shown below.
EACM 6
𝑘=0
Book Value after m years = 𝑃 −𝐴[∑𝑚 ((1 +𝑖)𝑘]
TIME VALUE OF MONEY
Time value of money quantifies the value of a rupee through time
Money has time value because of the following reasons:
1. Risk and Uncertainty: Future is always uncertain and risky. Outflow of cash is in our control as payments
are made by us. There is no certainty for future cash inflows. Cash inflow is dependent on our Creditor,
Bank etc. As an individual or firm is not certain about future cash receipts, it prefers receiving cash now.
2. Inflation: In an inflationary economy, the money received today, has more purchasing power than the
money to be received in future. In other words, a rupee today represents a greater real purchasing power
than a rupee a year hence.
3. Consumption: Individuals generally prefer current consumption to future consumption.
4. Investment opportunities: An investor can profitably employ a rupee received today, to give him a higher
value to be received tomorrow or after a certain period of time.
A rupee received today is worth more than a rupee receivedtomorrow
This is because a rupee received today can be invested to earninterest
The amount of interest earned depends on the rate of return that can be earned on the investment](https://image.slidesharecdn.com/eacmnotes-210924041811/85/Energy-audit-115-320.jpg)

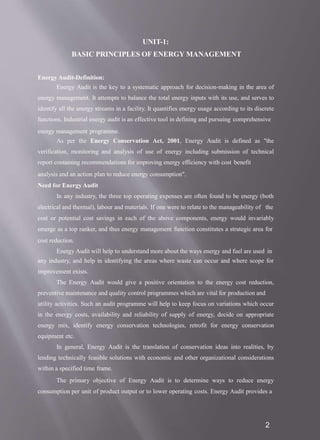
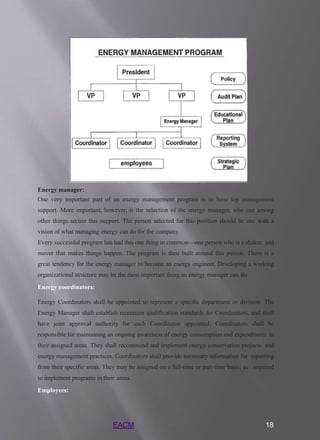
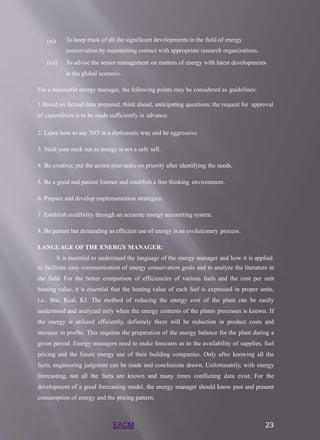
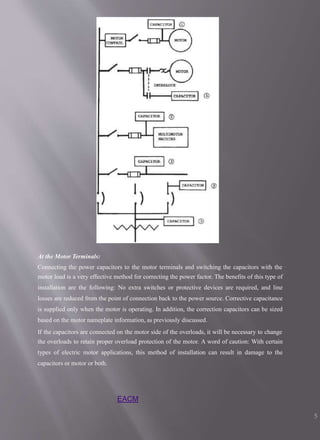
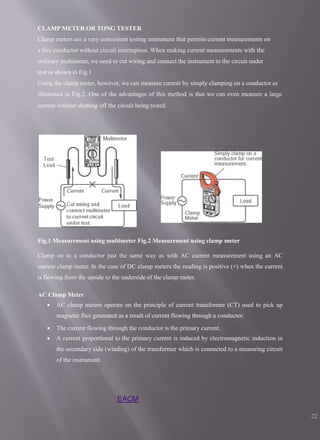
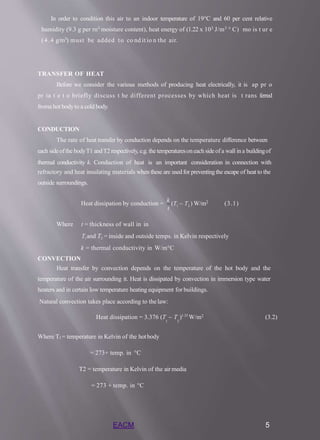
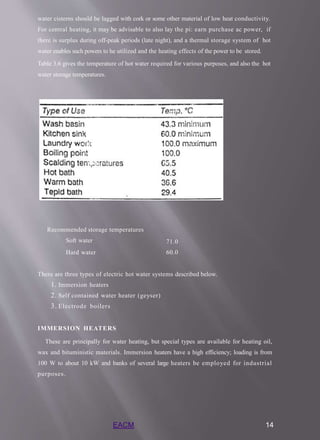
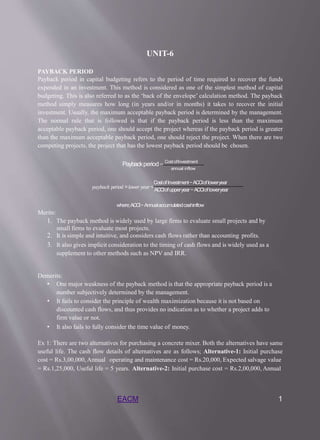
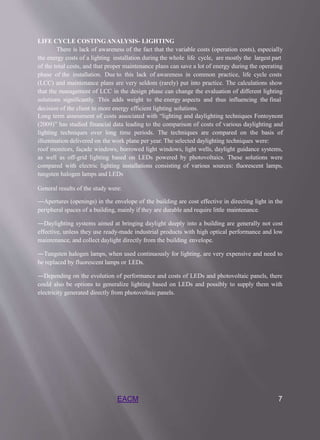
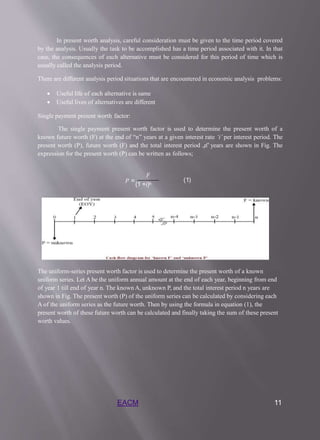
![The arrow represents the flow of money and the numbers under the timeline represent the time period. Note
that time period zero is today.
PV = CFt / (1+r)t
PV = 100 / (1 + .1)5
PV = Rs62.09
2. Future value of a lump sum:
The future value as the opposite of present value
Future value determines the amount that a sum of money invested today will grow to in a given period
of time
The process of finding a future value is called “compounding” (hint: it gets larger)
FVt = PV * (1+r)t
P) How much money will you have in 5 years if you invest Rs100 today at a 10% rate of return?
Draw a timeline
FVt = CF0 * (1+r)t
FV = Rs100 * (1+.1)5
FV = Rs161.05
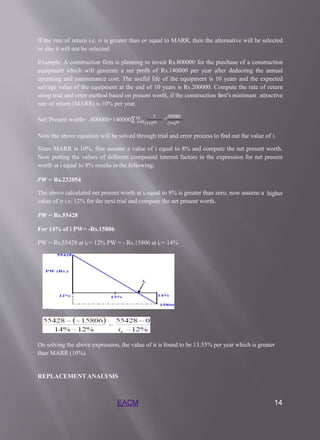
3. Present value of a cash flow stream:
A cash flow stream is a finite set of payments that an investor will receive or invest over time.
The PV of the cash flow stream is equal to the sum of the present value of each of the individual cash
flows in the stream.
The PV of a cash flow stream can also be found by taking the FV of the cash flow stream and
discounting the lump sum at the appropriate discount rate for the appropriate number of periods.
n
PV= Σ [CFt / (1+r)t ]
t=1
Where CF = Cash flow (the subscripts t and 0 mean at time t and at time zero,respectively)
EACM 8](https://image.slidesharecdn.com/eacmnotes-210924041811/85/Energy-audit-117-320.jpg)
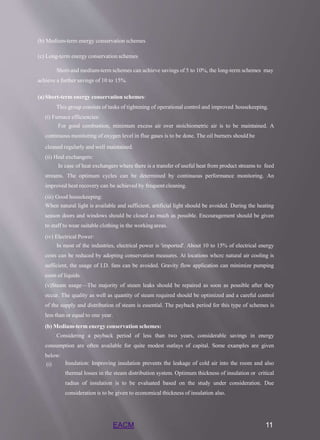
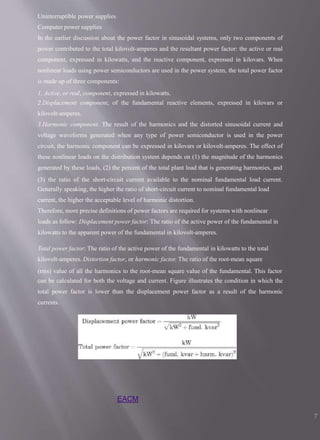
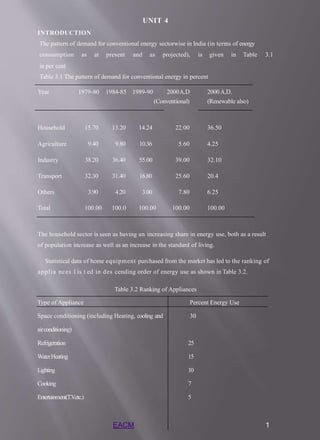
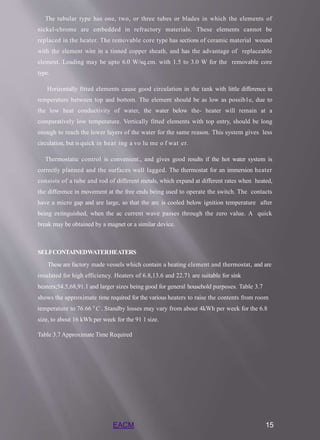
![EACM 9
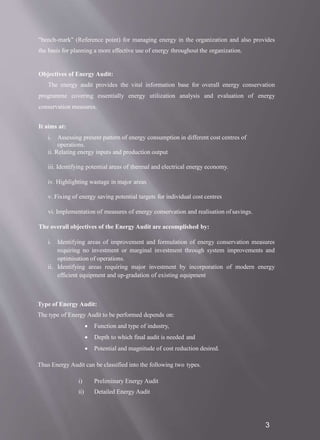
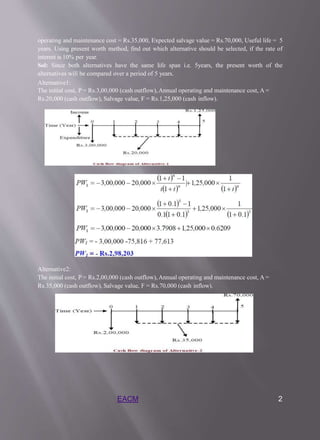
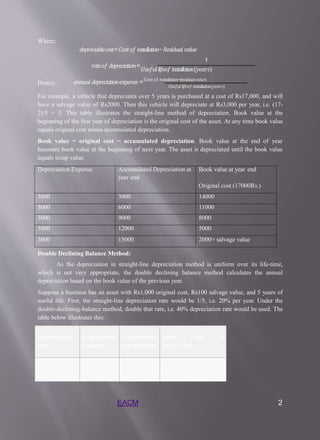
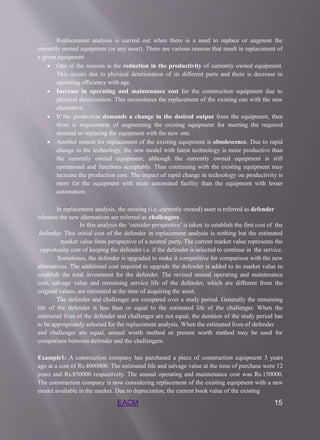
P) Joe made an investment that will pay Rs100 the first year, Rs300 the second year, Rs500 the third year and
Rs1000 the fourth year. If the interest rate is ten percent, what is the present value of this cash flow stream?
Draw a timeline:
PV = [CF1/(1+r)1]+[CF2/(1+r)2]+[CF3/(1+r)3]+[CF4/(1+r)4]
PV = [100/(1+.1)1]+[Rs300/(1+.1)2]+[500/(1+.1)3]+[1000/(1.1)4]
PV = Rs90.91 + Rs247.93 + Rs375.66 + Rs683.01
PV = Rs1397.51
4. Future value of a cash flow stream:
The future value of a cash flow stream is equal to the sum of the future values of the individual cash
flows.
The FV of a cash flow stream can also be found by taking the PV of that same stream and findingthe
FV of that lump sum using the appropriate rate of return for the appropriate number of periods.
n
Σ [CFt * (1+r)n-t]
t=1
FV =
Assume Joe has the same cash flow stream from his investment but wants to know what it will be worth at the
end of the fourth year
Draw a timeline:
FV = [CF1*(1+r)n-1]+[CF2*(1+r)n-2]+[CF3*(1+r)n-3]+[CF4*(1+r)n-4]
FV = [Rs100*(1+.1)4-1]+[Rs300*(1+.1)4-2]+[Rs500*(1+.1)4-3] +[Rs1000*(1+.1)4-4]
FV = Rs133.10 + Rs363.00 + Rs550.00 + Rs1000
FV = Rs2046.10
5. Present value of an annuity: PVA = payment * {[1-(1+r)-t]/r}
An annuity is a cash flow stream in which the cash flows are all equal and occur at regular
intervals.](https://image.slidesharecdn.com/eacmnotes-210924041811/85/Energy-audit-118-320.jpg)
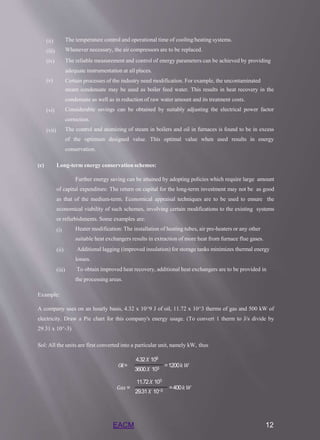
![EACM 10
Note that annuities can be a fixed amount, an amount that grows at a constant rate over time, or an
amount that grows at various rates of growth over time. We will focus on fixed amounts.
P) Assume that Sally owns an investment that will pay her Rs100 each year for 20 years. The current interest
rate is 15%. What is the PV of this annuity?
Draw a timeline
PVAt = payment *{[1-(1+r)-t]/r}
PVA = Rs100 * {[1-(1+.15)-20]/.15}
PVA = Rs100 * 6.2593
PVA = Rs625.93
6. Future value of an annuity:
FVAt = payment * {[(1+r)t –1]/r}
P) Assume that Sally owns an investment that will pay her Rs100 each year for 20 years. The current interest
rate is 15%. What is the FV of this annuity?
Draw a timeline
FVAt = PMT * {[(1+r)t –1]/r}
FVA20 = Rs100 * {[(1+.15)20 –1]/.15
FVA20 = Rs100 *102.4436
FVA20 = Rs10,244.36
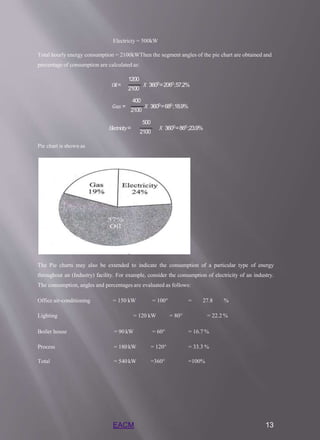
PRESENT WORTH ANALYSIS
One of the easiest ways to compare mutually exclusive alternatives is to resolve their
consequences to the present time. Present worth analysis is most frequently used to determine the
present value of future money receipts and disbursements. It would help us, for example to
determine a present worth of income producing property, like an oil well or an apartment house.
If the future income and cost are known, then using a suitable interest rate, the present worth of
the property may be calculated. This should provide a good estimate of the price at which the
property could be bought or sold.](https://image.slidesharecdn.com/eacmnotes-210924041811/85/Energy-audit-119-320.jpg)
![(2)
(3)
The expression in the bracket is a geometric sequence with first term equal to (1 + i)−1 and
common ratio equal to(1 + i)−1. Then the present worth (P) is calculated by taking the sum of the
first n terms of the geometric sequence (at i ≠ 0) and is given by;
(4)
The simplification of equation (4) results in the following the expression;
(1 +𝑖)𝑛−1
𝑖(1+𝑖)𝑛
𝑃 =𝐴 [ ] (5)
Thus if the value of A in the uniform series is known, then the present worth P at interest rate of
i(per year) can be calculated by equation (5).
Equal life span alternatives:
The comparison of mutually exclusive alternatives having equal life spans by present
worth method is simpler than those having different life spans. In case of equal life span
mutually exclusive alternatives, the future amounts are converted into the equivalent present
worth values and are added to the present worth occurring at time zero. Then the alternative that
exhibits maximum positive equivalent present worth or minimum negative equivalent present
worth is selected from the available alternatives.
Different life span alternatives:
In case of mutually exclusive alternatives that have different life spans, the comparison is
generally made over the same number of years i.e. a common study period. This is because; the
comparison of the mutually exclusive alternatives over same period of time is required for
EACM 12](https://image.slidesharecdn.com/eacmnotes-210924041811/85/Energy-audit-121-320.jpg)
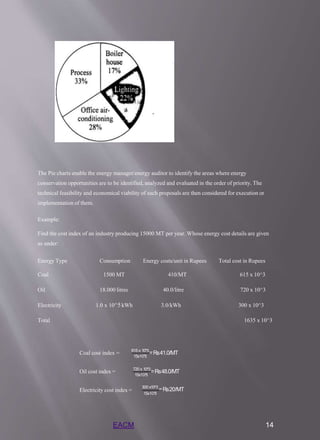
![equipment is Rs.3055000. The current market value of the existing equipment is Rs.2950000. The
revised estimate of salvage value and remaining life are Rs.650000 and 8 years respectively. The
annual operating and maintenance cost is same as earlier i.e. Rs.150000. The initial cost of the
new model is Rs.3500000. The estimated life, salvage value and annual operating and
maintenance cost are 8 years, Rs.900000 and Rs.125000 respectively. Company’s MARR is 10%
per year. Find out whether the construction company should retain the ownership of the existing
equipment or replace it with the new model, if study period is taken as 8 years (considering equal
life of both defender and challenger).
Sol: For the replacement analysis the current revised estimates of the existing equipment will be
used.
For existing equipment (defender),
Current market value (P) = Rs.2950000, Salvage value (F) = Rs.650000, Annual operating and
maintenance cost (A) = Rs.150000, Study period (n) = 8 years.
For new model (challenger),
Initial cost (P) = Rs.3500000, Salvage value (F) = Rs.900000, Annual operating and maintenance
cost (A) = Rs.125000, Study period (n) = 8 years.
Now the equivalent uniform annual worth of both defender (i.e. the existing equipment) and
challenger (i.e. the new model) at MARR of 10% (i.e. i = 10%) are calculated as follows;
𝑷𝑾𝒅𝒆𝒇 =−𝟐𝟗𝟓𝟎𝟎𝟎𝟎 −𝟏𝟓𝟎𝟎𝟎𝟎[
𝑖(1+𝑖)𝑛
(1 +𝑖)𝑛 −1 1
] +650000
(1+𝑖)𝑛
𝑷𝑾𝒅𝒆𝒇 =−𝟐𝟗𝟓𝟎𝟎𝟎𝟎 −𝟏𝟓𝟎𝟎𝟎𝟎[
(1 +𝑖)8−1
𝑖(1+𝑖)8
1
] +650000
(1+𝑖)8
𝑷𝑾𝒅𝒆𝒇 =−𝟐𝟗𝟓𝟎𝟎𝟎𝟎 −𝟏𝟓𝟎𝟎𝟎𝟎[5.334] +650000[0.4665]
𝑷𝑾𝒅𝒆𝒇 = −𝟑𝟒𝟒𝟔𝟖𝟕𝟓
𝑷𝑾𝒄𝒉𝒂𝒍𝒍 =−𝟑𝟓𝟎𝟎𝟎𝟎𝟎 −𝟏𝟐𝟓𝟎𝟎𝟎[
(1 +𝑖)𝑛−1
𝑖(1+𝑖)𝑛
1
]+900000
(1+𝑖)𝑛
𝑷𝑾𝒄𝒉𝒂𝒍𝒍 =−𝟑𝟓𝟎𝟎𝟎𝟎𝟎 −𝟏𝟐𝟓𝟎𝟎𝟎[
(1 +𝑖)8−1
𝑖(1+𝑖)8
1
] +900000[
(1+𝑖)8]
EACM 16
𝑷𝑾𝒄𝒉𝒂𝒍𝒍 =−𝟑𝟓𝟎𝟎𝟎𝟎𝟎 −𝟏𝟐𝟓𝟎𝟎𝟎[5.334] +900000[0.4665]](https://image.slidesharecdn.com/eacmnotes-210924041811/85/Energy-audit-125-320.jpg)