Downloaded 103 times
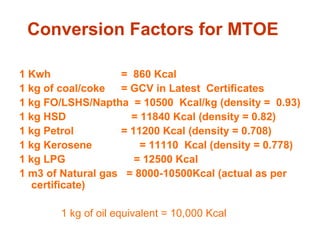

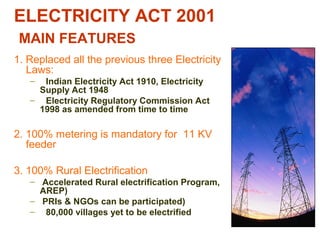
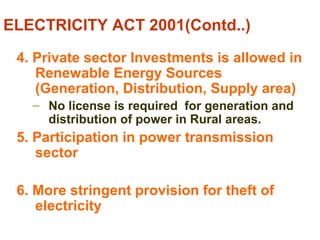


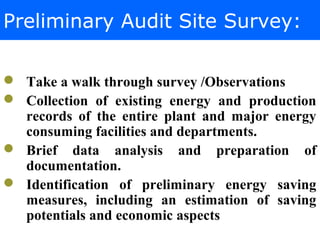
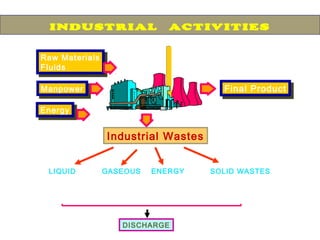


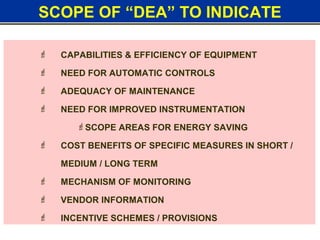
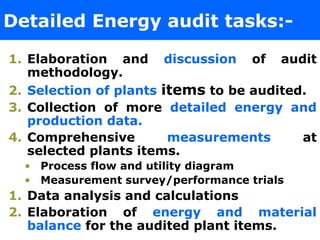


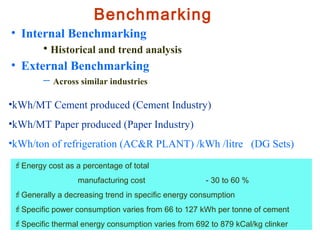
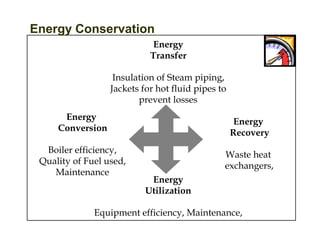


This document discusses energy audits and provides information on related topics. It defines an energy audit, describes the objectives and types of energy audits. It also discusses benchmarking, energy conservation opportunities, and instruments used in energy audits. Conversion factors and the Energy Conservation Act are outlined. Methodology, steps, and components of preliminary and detailed energy audits are summarized.


