Downloaded 168 times


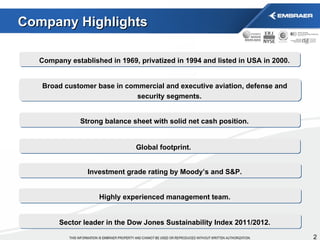
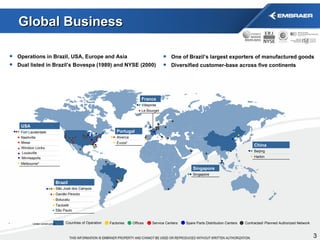
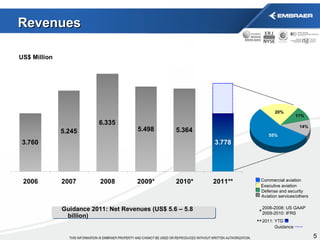
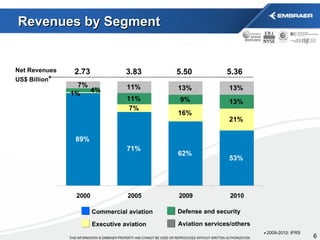
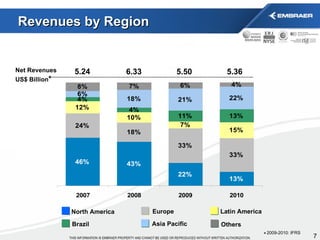

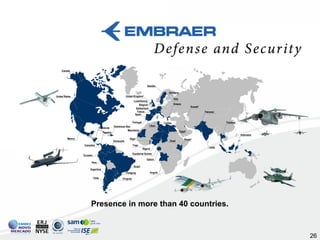


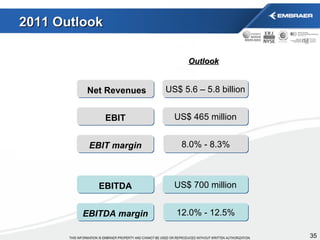

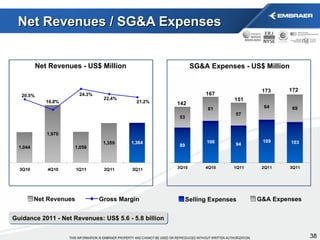


- The company is an investment grade-rated global aerospace company established in 1969 and headquartered in Brazil. - It has a strong balance sheet and is a leader in commercial, executive and defense aviation with aircraft, services and systems. - The company has a global footprint with operations in Brazil, USA, Europe and Asia and is forecasting 2011 revenues between $5.6-5.8 billion.


