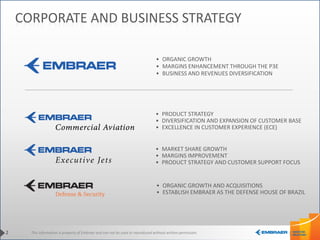
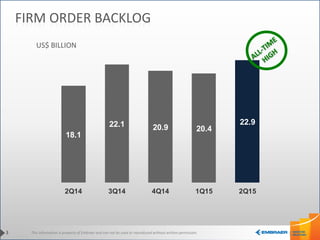
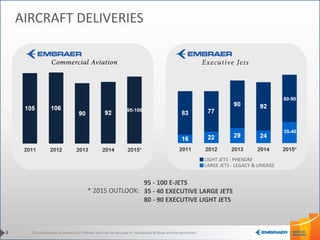
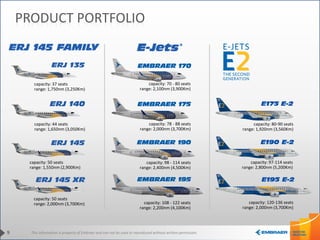
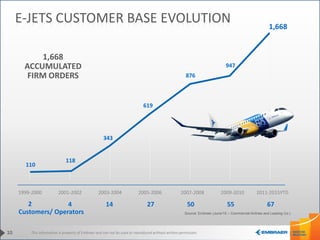
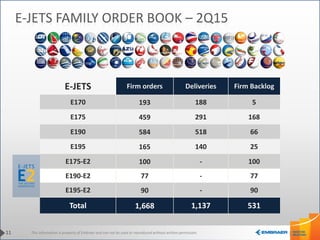
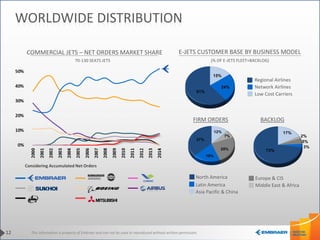
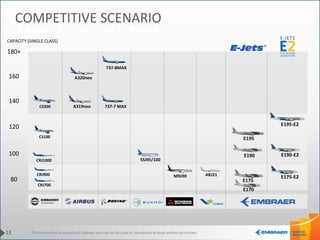
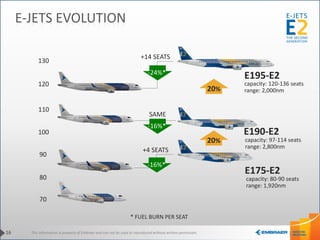
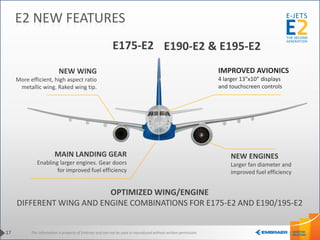
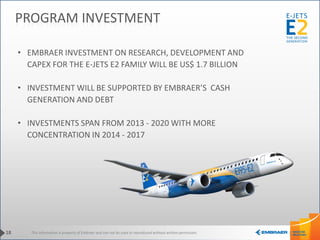
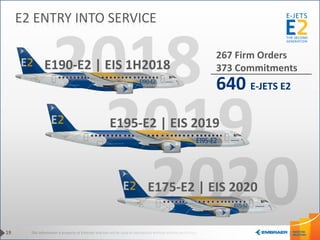
This information is property of Embraer and can not be used or reproduced without written permission.AUGUST 2015
+55 12 3927 4404 | investor.relations@embraer.com.br | www.embraer.com
This information is property of Embraer and can not be used or reproduced without written permission.
CORPORATE AND BUSINESS STRATEGY
• ORGANIC GROWTH
• MARGINS ENHANCEMENT THROUGH THE P3E
• BUSINESS AND REVENUES DIVERSIFICATION
• ORGANIC GROWTH AND ACQUISITIONS
• ESTABLISH EMBRAER AS THE DEFENSE HOUSE OF BRAZIL
• PRODUCT STRATEGY
• DIVERSIFICATION AND EXPANSION OF CUSTOMER BASE
• EXCELLENCE IN CUSTOMER EXPERIENCE (ECE)
• MARKET SHARE GROWTH
• MARGINS IMPROVEMENT
• PRODUCT STRATEGY AND CUSTOMER SUPPORT FOCUS
2
This information is property of Embraer and can not be used or reproduced without written permission.
18.1
22.1 20.9 20.4
22.9
2Q14 3Q14 4Q14 1Q15 2Q15
FIRM ORDER BACKLOG
3
US$ BILLION
This information is property of Embraer and can not be used or reproduced without written permission.
LARGE JETS - LEGACY & LINEAGE
LIGHT JETS - PHENOM
AIRCRAFT DELIVERIES
4
95 - 100 E-JETS
35 - 40 EXECUTIVE LARGE JETS
80 - 90 EXECUTIVE LIGHT JETS
95-100
80-90
35-40
* 2015 OUTLOOK:
This information is property of Embraer and can not be used or reproduced without written permission.
5,791 6,167 6,235 6,289
2011 2012 2013 2014 2015*
5
NET REVENUES
US$ MILLION
5,800-6,300
54%
15%
2%
* 2015 OUTLOOK: US$ 5.8 – 6.3 BILLION
29%
OTHERS
This information is property of Embraer and can not be used or reproduced without written permission.
24% 29%
48%
31% 22%
14%
14% 21%
21%3%
8%
3%
14%
6%
4%5% 9% 4%
9% 5% 6%
2012 2013 2014
61%
53% 50%
21%
27%
26%
17% 19% 23%
1% 1% 1%
2012 2013 2014
REVENUES BREAKDOWN
NET REVENUES BY SEGMENT NET REVENUES BY REGION
OTHERS
Revenues
US$ Billion 6.17 6.24 6.29
Revenues
US$ Billion6.17 6.24 6.29
NORTH AMERICA BRAZIL
EUROPE
ASIA PACIFIC
SOUTH & CENTRAL
AMERICA
AFRICA &
MIDDLE EAST
CHINA
6
This information is property of Embraer and can not be used or reproduced without written permission.
OVER 90 AIRLINES IN MORE THAN 60 COUNTRIES
8
This information is property of Embraer and can not be used or reproduced without written permission.
capacity: 70 - 80 seats
range: 2,100nm (3,900Km)
capacity: 78 - 88 seats
range: 2,000nm (3,700Km)
capacity: 98 - 114 seats
range: 2,400nm (4,500Km)
capacity: 108 - 122 seats
range: 2,200nm (4,100Km)
PRODUCT PORTFOLIO
capacity: 37 seats
range: 1,750nm (3,250Km)
capacity: 44 seats
range: 1,650nm (3,050Km)
capacity: 50 seats
range: 1,550nm (2,900Km)
capacity: 50 seats
range: 2,000nm (3,700Km)
9
capacity: 120-136 seats
range: 2,000nm (3,700Km)
capacity: 97-114 seats
range: 2,800nm (5,200Km)
capacity: 80-90 seats
range: 1,920nm (3,560Km)
This information is property of Embraer and can not be used or reproduced without written permission.
E-JETS CUSTOMER BASE EVOLUTION
1999-2000 2001-2002 2003-2004 2005-2006 2007-2008 2009-2010 2011-2015YTD
2 4 14 27 50 55 67
Customers/ Operators
110
118
343
619
876
947
1,668
1,668
ACCUMULATED
FIRM ORDERS
10
Source: Embraer (June/15 – Commercial Airlines and Leasing Co.)
This information is property of Embraer and can not be used or reproduced without written permission.
E-JETS Firm orders Deliveries Firm Backlog
E170 193 188 5
E175 459 291 168
E190 584 518 66
E195 165 140 25
E175-E2 100 - 100
E190-E2 77 - 77
E195-E2 90 - 90
Total 1,668 1,137 531
11
E-JETS FAMILY ORDER BOOK – 2Q15
This information is property of Embraer and can not be used or reproduced without written permission.
15%
24%
61%
Latin America
Asia Pacific & China
E-JETS CUSTOMER BASE BY BUSINESS MODEL
FIRM ORDERS
COMMERCIAL JETS – NET ORDERS MARKET SHARE
Considering Accumulated Net Orders
70-130 SEATS JETS
BACKLOG
North America
Regional Airlines
Network Airlines
Low Cost Carriers
12%
7%
25%
19%
37%
17%
2%
5%
3%
73%
12
WORLDWIDE DISTRIBUTION
(% OF E-JETS FLEET+BACKLOG)
Europe & CIS
Middle East & Africa
This information is property of Embraer and can not be used or reproduced without written permission.13
COMPETITIVE SCENARIO
180+
160
140
120
100
80
SSJ95/100
MRJ90 ARJ21CRJ900
CRJ1000
CRJ700
CAPACITY (SINGLE CLASS)
737-7 MAXA319neo
A320neo
737-8MAX
CS100
CS300
E175-E2
E190-E2
E195-E2
E195
E190
E170
E175
This information is property of Embraer and can not be used or reproduced without written permission.
• REPLACEMENT OF OLD/INEFFICIENT JETS
• RIGHT-SIZING OF NARROW-BODY OPERATIONS
• HUB FEEDER AND POINT-POINT OPERATION IN LOW AND MID-DENSITY MARKETS
• REGIONAL AVIATION DEVELOPMENT
AROUND 6,350 JET DELIVERIES (70-130 SEATS) IN THE NEXT 20 YEARS (US$ 300 BI)
14
PROJECTED JETS DELIVERIES
MARKET SEGMENT
(SEATS)
2015 – 2034
DELIVERIES
70 - 90 2,250
90 - 130 4,100
70 -130 6,350
EMBRAER MARKET FORECAST (2015 – 2034)
NORTH
AMERICA
2,060
32%
LATIN
AMERICA
720
11%
AFRICA
220
4%
EUROPE
1,160
18%
MIDDLE
EAST
240
4%
CIS
380
6%
CHINA
1,020
16%
ASIA
PACIFIC
550
9%
For more information: http://www.embraermarketoutlook.com
This information is property of Embraer and can not be used or reproduced without written permission.
E-JETS EVOLUTION
70
80
90
100
110
120
130
+4 SEATS
SAME
+14 SEATS
20%
20%
E190-E2
E195-E2
E175-E2
16
capacity: 120-136 seats
range: 2,000nm
capacity: 97-114 seats
range: 2,800nm
capacity: 80-90 seats
range: 1,920nm
* FUEL BURN PER SEAT
-16%*
-24%*
-16%*
This information is property of Embraer and can not be used or reproduced without written permission.
E175-E2
NEW WING
More efficient, high aspect ratio
metallic wing. Raked wing tip.
IMPROVED AVIONICS
4 larger 13”x10” displays
and touchscreen controls
MAIN LANDING GEAR
Enabling larger engines. Gear doors
for improved fuel efficiency
OPTIMIZED WING/ENGINE
DIFFERENT WING AND ENGINE COMBINATIONS FOR E175-E2 AND E190/195-E2
NEW ENGINES
Larger fan diameter and
improved fuel efficiency
17
E2 NEW FEATURES
E190-E2 & E195-E2
This information is property of Embraer and can not be used or reproduced without written permission.
• EMBRAER INVESTMENT ON RESEARCH, DEVELOPMENT AND
CAPEX FOR THE E-JETS E2 FAMILY WILL BE US$ 1.7 BILLION
• INVESTMENT WILL BE SUPPORTED BY EMBRAER’S CASH
GENERATION AND DEBT
• INVESTMENTS SPAN FROM 2013 - 2020 WITH MORE
CONCENTRATION IN 2014 - 2017
18
PROGRAM INVESTMENT
This information is property of Embraer and can not be used or reproduced without written permission.
E195-E2 | EIS 2019
E190-E2 | EIS 1H2018
E175-E2 | EIS 2020
267 Firm Orders
373 Commitments
19
E2 ENTRY INTO SERVICE
640 E-JETS E2
This information is property of Embraer and can not be used or reproduced without written permission.
NEARLY 850 JETS IN SERVICE IN MORE THAN 60 COUNTRIES
21
This information is property of Embraer and can not be used or reproduced without written permission.22
PRODUCT PORTFOLIO
LARGE
AIRCRAFT MODEL SEATS /RANGE
up to 8 occupants/
1,178 nm
up to 11 occupants/
1,971 nm
7 to 9 passengers/
2,300 nm
8 to 12 passengers/
3,000 nm
13 to 14 passengers/
3,400 nm
13 to 19 passengers/
4,500 nm
ENTRY
LIGHT
MID-LIGHT
MID-SIZE
ULTRA-LARGE
SUPER MID-SIZE
Certified: 2008
Certified: 2009
Certified: 2001
Certified: 2008
ULTRA-LONG RANGE
COMPETITORS
• Cessna - Mustang/M2
• HondaJet
• Cessna - CJ2+/CJ3/CJ4
• Bombardier - Learjet 40XR/70
• Bombardier - Learjet 45XR/75
• Cessna - XLS+/Latitude
• Bombardier - Learjet 85
• Cessna - Sovereign
• Gulfstream - G150
• Bombardier - CL605/GL5000
• Dassault - Falcon 2000LXS/
900LX
• Gulfstream - G350/G450
• Airbus - ACJ 318/319/320
• Boeing - BBJ/BBJ2/BBJ3
13 to 14 passengers/
3,900 nm
Certified: 2010
• Bombardier - GL6000/GL7000/
GL8000
• Gulfstream - G500/G550/G650/
650ER
• Dassault - Falcon 7X/8X
• Bombardier - CL300/CL850
• Cessna - X/Longitude
• Dassault - Falcon 2000S
• Gulfstream - G280
Certified: 2014
Certified: 2015
This information is property of Embraer and can not be used or reproduced without written permission.
DELIVERIES SHARE (UNITS)REVENUES SHARE (US$ BI | B&CA LIST PRICES)
MARKET DELIVERIES 2014: 705 UNITS
EMBRAER DELIVERIES: 116 UNITS
BOMBARDIER
MARKET REVENUES 2014: US$ 21.9 BILLION
EMBRAER REVENUES: US$ 1.6 BILLION
23
MARKET SHARE
HAWKER-BEECH DASSAULT
CESSNAGULFSTREAMOTHERS
This information is property of Embraer and can not be used or reproduced without written permission.
0%
4%
8%
12%
16%
20%
24%
28%
0
500
1.000
1.500
2.000
2.500
3.000
3.500
Q1Q2Q3Q4Q1Q2Q3Q4Q1Q2Q3Q4Q1Q2Q3Q4Q1Q2Q3Q4Q1Q2Q3Q4Q1Q2Q3Q4Q1Q2Q3Q4Q1Q2Q3Q4Q1Q2Q3Q4Q1Q2Q3Q4Q1Q2Q3Q4Q1Q2Q3Q4Q1Q2Q3Q4Q1Q2Q3Q4Q1Q2
2000 2001 2002 2003 2004 2005 2006 2007 2008 2009 2010 2011 2012 2013 2014 2015
%ofactivefleet
Units
Fleet older than 10 yrs Fleet from 6 to 10 yrs
Fleet up to 5 yrs Positions
Fleet up to 5 yrs and positions Total fleet % for sale
Up to 10 yrs % for sale
24
BUSINESS JETS PRE-OWNED MARKET INVENTORY
Source: Jetnet and Embraer analysis, April 2015
10.8%
2,179 jets
7.5%
616 jets
This information is property of Embraer and can not be used or reproduced without written permission.
IMPROVED ECONOMIC ENVIRONMENT IN US MAY DRIVE MARKET TURNAROUND
25
MARKET RECOVERY IN SLOW MOTION
US 2015 GDP EXPECTED ABOVE 3.0%
LOW OIL PRICE GENERATING OPPORTUNITIES
US CORPORATE PROFITS AND HNWI AT RECORD LEVELS
NEW PRODUCTS ENTERING INTO SERVICE
TRAFFIC RECOVERY ON TRACK IN US BUT SLOWER THAN EXPECTED IN EU
PRE-OWNED AIRCRAFT PRICES STABILIZED
EUROPEAN MARKETS CONTINUE AT RISK; SOFTENING EMERGING MARKETS DEMAND
This information is property of Embraer and can not be used or reproduced without written permission.
0
200
400
600
800
1000
1200
2008
2009
2010
2011
2012
2013
2014
2015
2016
2017
2018
2019
2020
2021
2022
2023
2024
Deliveries Forecast (units)
9,250 JETS AND US$ 265 BI IN THE NEXT 10 YEARS
26
2015-2024 MARKET FORECAST
Units US$
1.057
5
1.688
15
1.000
15
854
18
1.231
32
1.626
66
1.616
101
170
12
Deliveries Revenue
N15YF
Ultra Long Range
Large
Supermid
Midsize
Midlight
Light
Entry
Ultra Large
This information is property of Embraer and can not be used or reproduced without written permission.
NORTH AMERICA
4,620 a/c (50%)
US$ 120 Bi (45%)
EUROPE, MIDDLE EAST & AFRICA
2,360 a/c (26%)
US$ 77 Bi (29%)
ASIA PACIFIC
570 a/c (6%)
US$ 19 Bi (7%)
LATIN AMERICA
850 a/c (9%)
US$ 16 Bi (6%)
CHINA
835 a/c (9%)
US$ 33 Bi (12%)
WORLDWIDE
9,250 units
US$ 265 Bi
27
2015-2024 MARKET FORECAST BY REGION
Note: sum of regional numbers might differ from total numbers due to rounding
Source: Embraer Analysis
This information is property of Embraer and can not be used or reproduced without written permission.
OVER 50 ARMED FORCES
29
This information is property of Embraer and can not be used or reproduced without written permission.
SATELLITE
INTEGRATED PORTFOLIO
LIGHT ATTACK AND
ADVANCED TRAINING
TACTICAL MILITARY
TRANSPORT
ISR (INTELLIGENCE,
SURVEILLANCE AND
RECONNAISSANCE)
UAVs RADARC4I LAND SYSTEMS SERVICES
30
TRANSPORT AIRCRAFTMODERNIZATION
PROGRAMS
• C2 & C4I SYSTEMS
• AIRBORNE SYSTEMS
• SIMULATION
• CONTROL SYSTEMS
• AIR TRAFFIC SYSTEM
• UAVS
• SIMULATORS
• AVIONICS
MODERNIZATION
• LAND DEFENSE
SYSTEMS
INTEGRATION
• SISFRON
IMPLEMENTATION
• MRO
• AEROSTRUCTURES
• REMOTE SENSING
• AERIAL
SURVEILLANCE
RADAR
• SATELLITE
GEOSTATIONARY OF
DEFENSE AND
COMMUNICATIONS
(SGDC)
100% 51% 65%90% 100%51%
PARTNERSHIPS
This information is property of Embraer and can not be used or reproduced without written permission.
REVENUES EVOLUTION (US$ MILLION) BACKLOG EVOLUTION (US$ BILLION)
31
EMBRAER DEFENSE & SECURITY RESULTS
REVENUES PARTICIPATION (%)
This information is property of Embraer and can not be used or reproduced without written permission.
BRAZIL: 99
COLOMBIA: 25
DOMINICAN REPUBLIC: 8
CHILE: 12
ECUADOR: 18
INDONESIA: 16
GREYSTONE (TACAIR): 1
MAURITANIA: 2
BURKINA FASO: 3
ANGOLA: 6
USA: 20
MALI: 6
GHANA: 5
TOTAL MARKET FORECAST:
300 AIRCRAFT / US$ 3.5 BILLION
800
2,000
700
MEDIUM-TERM
LONG-TERM
SHORT-TERM
ADDRESSABLE MARKET FORECAST 2020
(US$ MILLION)
PARTNERSHIP WITH BOEING TO PROVIDE WEAPONS INTEGRATION, INCREASING CAPABILITIES OF THE AIRCRAFT.
• FIRM ORDERS: MORE THAN 220 AIRCRAFT
• OVER 190 AIRCRAFT DELIVERED
32
SUPER TUCANO
This information is property of Embraer and can not be used or reproduced without written permission.
• A NEW TACTICAL MILITARY TRANSPORT AND TANKER AIRCRAFT
• PARTNERSHIP WITH BOEING TO SHARE TECHNICAL KNOWLEDGE AND TO MARKET AND SELL THE KC-390
IN CERTAIN MARKETS
• SIX COUNTRIES LETTERS OF INTENT, TOTALIZING 60 AIRCRAFT
• FAB AND EMBRAER SIGNED THE SERIES PRODUCTION CONTRACT FOR 28 KC-390
• FIRST FLIGHT IN FEBRUARY 2015
TOTAL MARKET FORECAST 2025:
700 AIRCRAFT / US$ 50+ BI
33
EMBRAER KC-390
BRAZIL: 28
COLOMBIA: 12
ARGENTINA: 6
CHILE: 6
PORTUGAL: 6
CZECH REP.: 2
This information is property of Embraer and can not be used or reproduced without written permission.
SISFRON
INTEGRATED BORDERS MONITORING SYSTEM
FIRST PHASE: US$ 420 MILLION
TOTAL ESTIMATE: US$ 4 BILLION
COMPRISING RADARS, COMMUNICATION NETWORKS, C4I,
UNMANNED AIR VEHICLES (UAV) AND ARMORED VEHICLES
SATELLITE
ESTIMATE: US$ 400 MILLION
PARTICIPATION IN THE FIRST BRAZILIAN GEOSTATIONARY SATELLITE
34
BRAZILIAN ARMY PRIORITIES
This information is property of Embraer and can not be used or reproduced without written permission.
F-X2
• BRAZILIAN GOVERNMENT CONTRACTED SAAB TO SUPPLY 36 GRIPEN NG FIGHTER JET.
• EMBRAER AND SAAB ESTABLISHED PARTNERSHIP FOR JOINT PROGRAMME
MANAGEMENT FOR BRAZIL’S F-X2 PROJECT.
35
This information is property of Embraer and can not be used or reproduced without written permission.
FINANCIAL RESULTS
This information is property of Embraer and can not be used or reproduced without written permission.
115
99
113
86
100
53
52
55
43
47
2Q14 3Q14 4Q14 1Q15 2Q15
1,761
1,240
2,046
1,056
1,513
2Q14 3Q14 4Q14 1Q15 2Q15
NET REVENUES - US$ MILLION SG&A EXPENSES - US$ MILLION
37
NET REVENUES | SG&A EXPENSES
SELLING EXPENSESG&A EXPENSES
2015 OUTLOOK: US$ 5.8 – 6.3 BILLION
YTD: 2,569
151
168168
147
129
YTD: 276
This information is property of Embraer and can not be used or reproduced without written permission.
357 346 359
213 216
2Q14 3Q14 4Q14 1Q15 2Q15
421
213
690
167
404
2Q14 3Q14 4Q14 1Q15 2Q15
972
661
975
662
883
2Q14 3Q14 4Q14 1Q15 2Q15
1,761
1,240
2,045
1,056
1,513
2Q14 3Q14 4Q14 1Q15 2Q15
NET REVENUES BY SEGMENT
OUTLOOK: US$ 1.70 – 1.85 BILLION OUTLOOK: US$ 0.80 – 0.95 BILLION
OUTLOOK: US$ 3.20 – 3.40 BILLIONOUTLOOK: US$ 5.80 – 6.30 BILLION
38
YTD: 2.57 BILLION YTD: 1.54 BILLION
YTD: 0.57 BILLION YTD: 0.43 BILLION
This information is property of Embraer and can not be used or reproduced without written permission.
261
136
281
149
178
14.8%
11.0%
13.8% 14.1%
11.7%
2Q14 3Q14 4Q14 1Q15 2Q15
187
68
196
80
102
10.6%
5.5%
9.6%
7.5% 6.8%
2Q14 3Q14 4Q14 1Q15 2Q15
39
INCOME FROM OPERATIONS (EBIT) | EBITDA
EBIT - US$ MILLION EBITDA - US$ MILLION
EBIT EBIT MARGIN EBITDA EBITDA MARGIN
2015 OUTLOOK:
US$ 490 – 560 MILLION | 8.5% – 9.0%
2015 OUTLOOK:
US$ 730 – 860 MILLION | 12.6% – 13.6%
YTD: 182 | 7.1% YTD: 327 | 12.7%
This information is property of Embraer and can not be used or reproduced without written permission.
13 49
507
(291)
245
(60) (89) (87)
(57)
(74)
(103) (97) (132)
(91)
(98)
(150) (138)
288
(440)
73
2Q14 3Q14 4Q14 1Q15 2Q15
143
(11)
91
(62)
129
8.1%
-0.9%
4.5%
-5.8%
8.5%
2Q14 3Q14 4Q14 1Q15 2Q15
NET INCOME - US$ MILLION FREE CASH FLOW - US$ MILLION
FREE CASH FLOW
NET ADDITIONS TO PP&E
NET CASH GENERATED (USED) BY OPERATING ACTIVITIES*
ADDITIONS TO INTANGIBLE
* Net of Financial assets adjustment
40
NET INCOME | FREE CASH FLOW
NET MARGINNET INCOME
2015 OUTLOOK: FCF > (US$ 100) MILLION
YTD: 68 | 2.6% YTD: (367)
This information is property of Embraer and can not be used or reproduced without written permission.
2,439
2,767
2,405
2,696 2,640
2Q14 3Q14 4Q14 1Q15 2Q15
41
INVENTORIES
US$ MILLION
This information is property of Embraer and can not be used or reproduced without written permission.
18
84 94
50
300 300
RESEARCH DEVELOPMENT CAPEX
42
INVESTMENTS
YTD: 196
2015 OUTLOOK: US$ 650 MILLION
2015 OUTLOOK2015 YTD
US$ MILLION
This information is property of Embraer and can not be used or reproduced without written permission.
(114)
(327)
(85)
(581)
(511)
2Q14 3Q14 4Q14 1Q15 2Q15
96% 96% 96% 89% 90%
4% 4% 4% 11% 10%
5.7 5.6 5.4 5.3
6.5
2Q14 3Q14 4Q14 1Q15 2Q15
43
INDEBTEDNESS PROFILE | NET CASH
INDEBTEDNESS MATURITY NET CASH (DEBT) - US$ MILLION
LONG-TERM SHORT-TERM
LOANS AVERAGE MATURITY (YEARS)
TOTAL DEBT 2Q15: US$ 3.53 BILLION TOTAL CASH 2Q15: US$ 3.02 BILLION
This information is property of Embraer and can not be used or reproduced without written permission.
USD Debt
2,697 77%
BRL Debt
756 21%
EUR Debt
76 2%
1,086
1,933
41
365 437
92
75 205 79
549 539
1,122
44
INDEBTEDNESS PRINCIPAL MATURITIESCASHLOCALCASHABROAD
PRINCIPAL MATURITIES = US$ 3.5 BILLION
3,019
This information is property of Embraer and can not be used or reproduced without written permission.
1.83
0.62
1.92 1.88 1.82
34%
116%
26% 26% 27%
2010 2011 2012 2013 2014
45
EPADS AND PAY OUT
EPADS PAY OUT
US$
This information is property of Embraer and can not be used or reproduced without written permission.
736,049,762 VOTING SHARES
46
OWNERSHIP STRUCTURE – 2Q15
This information is property of Embraer and can not be used or reproduced without written permission.
2015 OUTLOOK
This information is property of Embraer and can not be used or reproduced without written permission.
NET REVENUES US$ 5.8 – 6.3 BILLION
48
2015 CONSOLIDATED OUTLOOK
15% OF NET REVENUES
2% OF NET REVENUES
29% OF NET REVENUES
54% OF NET REVENUES
DELIVERIES: 95 TO 100 E-JETS
US$ 100 MILLION
US$ 1.70 – 1.85 BILLION
US$ 0.80 – 0.95 BILLION
OTHER REVENUES
US$ 3.20 – 3.40 BILLION
DELIVERIES: 80 TO 90 LIGHT JETS
35 TO 40 LARGE JETS
This information is property of Embraer and can not be used or reproduced without written permission.
EBITDA MARGIN 12.6% – 13.6%
EBITDA US$ 730 – 860 MILLION
EBIT MARGIN 8.5% – 9.0%
EBIT US$ 490 – 560 MILLION
FCF > (US$ 100) MILLION*
49
2015 CONSOLIDATED OUTLOOK
* FCF USE OF LESS THAN US$ 100 MILLION.
RESEARCH US$ 50 MILLION
DEVELOPMENT US$ 300 MILLION
CAPEX US$ 300 MILLION
TOTAL INVESTMENTS: US$ 650 MILLION
This information is property of Embraer and can not be used or reproduced without written permission.
BRAZILIAN ALLIANCE FOR BIO-FUEL
ISO 14001 AND OHSAS
18001 CERTIFICATIONS
1ST ETHANOL POWERED
AIRCRAFT IN THE WORLD
GREENER
TECHNOLOGY
SOCIAL ACTIVITIES
50
SUSTAINABILITY INITIATIVES
REFORESTATION PROJECTS
RECYCLING
CORPORATE VALUES
This information is property of Embraer and can not be used or reproduced without written permission.
INVESTOR RELATIONS
PHONE: +55 12 3927 4404
INVESTOR.RELATIONS@EMBRAER.COM.BR
WWW.EMBRAER.COM
This information is property of Embraer and can not be used or reproduced without written permission.
This presentation may contain forward-looking statements, projections and estimates regarding circumstances
or events yet to take place, including, but not limited to, those statements relating to guidance. These forward-
looking statements are based largely on current expectations, forecasts of future events and industry and
financial trends that affect Embraer’s businesses. These statements are subject to risks, uncertainties and
assumptions that include, among others: general economic, political and trade conditions, both in Brazil and in
those markets where Embraer does business; management’s expectations and estimates concerning the
company’s future financial performance; plans and objectives of our management; financing plans and
programs, and the effects of competition; industry trends and growth opportunities; inflation and fluctuations
in exchange rates; the company’s investment plans; Embraer’s operating efficiencies and synergies and its
capacity to develop and deliver products on the dates previously agreed upon; results of operation; business
strategies; benefits of new technologies and existing and future governmental regulations. To obtain further
information on factors that may lead to results different from those forecast by Embraer, please consult the
reports Embraer files with the U.S. Securities and Exchange Commission (SEC) and the Brazilian Comissão de
Valores Mobiliários (CVM) and in particular the factors discussed under “Forward-Looking Statements” and
“Risk Factors” in Embraer’s annual report on Form 20−F. The words “believe”, “may”, “will”, “estimate”,
“intend”, “continue”, “anticipate”, “expect” and other similar terms are intended to identify forward-looking
statements. Embraer does not undertake any obligation to publish updates or to revise any forward-looking
statements due to new information, future events or any other factors. In view of the inherent risks and
uncertainties, such estimates, events and circumstances may not occur. The actual results and performance of
Embraer could therefore differ substantially from those anticipated in Embraer's forward-looking statements.
52
FORWARD LOOKING STATEMENT

Embraer august 2015 book ri

  • 1.
    This information isproperty of Embraer and can not be used or reproduced without written permission.AUGUST 2015 +55 12 3927 4404 | investor.relations@embraer.com.br | www.embraer.com
  • 2.
    This information isproperty of Embraer and can not be used or reproduced without written permission. CORPORATE AND BUSINESS STRATEGY • ORGANIC GROWTH • MARGINS ENHANCEMENT THROUGH THE P3E • BUSINESS AND REVENUES DIVERSIFICATION • ORGANIC GROWTH AND ACQUISITIONS • ESTABLISH EMBRAER AS THE DEFENSE HOUSE OF BRAZIL • PRODUCT STRATEGY • DIVERSIFICATION AND EXPANSION OF CUSTOMER BASE • EXCELLENCE IN CUSTOMER EXPERIENCE (ECE) • MARKET SHARE GROWTH • MARGINS IMPROVEMENT • PRODUCT STRATEGY AND CUSTOMER SUPPORT FOCUS 2
  • 3.
    This information isproperty of Embraer and can not be used or reproduced without written permission. 18.1 22.1 20.9 20.4 22.9 2Q14 3Q14 4Q14 1Q15 2Q15 FIRM ORDER BACKLOG 3 US$ BILLION
  • 4.
    This information isproperty of Embraer and can not be used or reproduced without written permission. LARGE JETS - LEGACY & LINEAGE LIGHT JETS - PHENOM AIRCRAFT DELIVERIES 4 95 - 100 E-JETS 35 - 40 EXECUTIVE LARGE JETS 80 - 90 EXECUTIVE LIGHT JETS 95-100 80-90 35-40 * 2015 OUTLOOK:
  • 5.
    This information isproperty of Embraer and can not be used or reproduced without written permission. 5,791 6,167 6,235 6,289 2011 2012 2013 2014 2015* 5 NET REVENUES US$ MILLION 5,800-6,300 54% 15% 2% * 2015 OUTLOOK: US$ 5.8 – 6.3 BILLION 29% OTHERS
  • 6.
    This information isproperty of Embraer and can not be used or reproduced without written permission. 24% 29% 48% 31% 22% 14% 14% 21% 21%3% 8% 3% 14% 6% 4%5% 9% 4% 9% 5% 6% 2012 2013 2014 61% 53% 50% 21% 27% 26% 17% 19% 23% 1% 1% 1% 2012 2013 2014 REVENUES BREAKDOWN NET REVENUES BY SEGMENT NET REVENUES BY REGION OTHERS Revenues US$ Billion 6.17 6.24 6.29 Revenues US$ Billion6.17 6.24 6.29 NORTH AMERICA BRAZIL EUROPE ASIA PACIFIC SOUTH & CENTRAL AMERICA AFRICA & MIDDLE EAST CHINA 6
  • 7.
    This information isproperty of Embraer and can not be used or reproduced without written permission.
  • 8.
    This information isproperty of Embraer and can not be used or reproduced without written permission. OVER 90 AIRLINES IN MORE THAN 60 COUNTRIES 8
  • 9.
    This information isproperty of Embraer and can not be used or reproduced without written permission. capacity: 70 - 80 seats range: 2,100nm (3,900Km) capacity: 78 - 88 seats range: 2,000nm (3,700Km) capacity: 98 - 114 seats range: 2,400nm (4,500Km) capacity: 108 - 122 seats range: 2,200nm (4,100Km) PRODUCT PORTFOLIO capacity: 37 seats range: 1,750nm (3,250Km) capacity: 44 seats range: 1,650nm (3,050Km) capacity: 50 seats range: 1,550nm (2,900Km) capacity: 50 seats range: 2,000nm (3,700Km) 9 capacity: 120-136 seats range: 2,000nm (3,700Km) capacity: 97-114 seats range: 2,800nm (5,200Km) capacity: 80-90 seats range: 1,920nm (3,560Km)
  • 10.
    This information isproperty of Embraer and can not be used or reproduced without written permission. E-JETS CUSTOMER BASE EVOLUTION 1999-2000 2001-2002 2003-2004 2005-2006 2007-2008 2009-2010 2011-2015YTD 2 4 14 27 50 55 67 Customers/ Operators 110 118 343 619 876 947 1,668 1,668 ACCUMULATED FIRM ORDERS 10 Source: Embraer (June/15 – Commercial Airlines and Leasing Co.)
  • 11.
    This information isproperty of Embraer and can not be used or reproduced without written permission. E-JETS Firm orders Deliveries Firm Backlog E170 193 188 5 E175 459 291 168 E190 584 518 66 E195 165 140 25 E175-E2 100 - 100 E190-E2 77 - 77 E195-E2 90 - 90 Total 1,668 1,137 531 11 E-JETS FAMILY ORDER BOOK – 2Q15
  • 12.
    This information isproperty of Embraer and can not be used or reproduced without written permission. 15% 24% 61% Latin America Asia Pacific & China E-JETS CUSTOMER BASE BY BUSINESS MODEL FIRM ORDERS COMMERCIAL JETS – NET ORDERS MARKET SHARE Considering Accumulated Net Orders 70-130 SEATS JETS BACKLOG North America Regional Airlines Network Airlines Low Cost Carriers 12% 7% 25% 19% 37% 17% 2% 5% 3% 73% 12 WORLDWIDE DISTRIBUTION (% OF E-JETS FLEET+BACKLOG) Europe & CIS Middle East & Africa
  • 13.
    This information isproperty of Embraer and can not be used or reproduced without written permission.13 COMPETITIVE SCENARIO 180+ 160 140 120 100 80 SSJ95/100 MRJ90 ARJ21CRJ900 CRJ1000 CRJ700 CAPACITY (SINGLE CLASS) 737-7 MAXA319neo A320neo 737-8MAX CS100 CS300 E175-E2 E190-E2 E195-E2 E195 E190 E170 E175
  • 14.
    This information isproperty of Embraer and can not be used or reproduced without written permission. • REPLACEMENT OF OLD/INEFFICIENT JETS • RIGHT-SIZING OF NARROW-BODY OPERATIONS • HUB FEEDER AND POINT-POINT OPERATION IN LOW AND MID-DENSITY MARKETS • REGIONAL AVIATION DEVELOPMENT AROUND 6,350 JET DELIVERIES (70-130 SEATS) IN THE NEXT 20 YEARS (US$ 300 BI) 14 PROJECTED JETS DELIVERIES MARKET SEGMENT (SEATS) 2015 – 2034 DELIVERIES 70 - 90 2,250 90 - 130 4,100 70 -130 6,350 EMBRAER MARKET FORECAST (2015 – 2034) NORTH AMERICA 2,060 32% LATIN AMERICA 720 11% AFRICA 220 4% EUROPE 1,160 18% MIDDLE EAST 240 4% CIS 380 6% CHINA 1,020 16% ASIA PACIFIC 550 9% For more information: http://www.embraermarketoutlook.com
  • 15.
    This information isproperty of Embraer and can not be used or reproduced without written permission.
  • 16.
    This information isproperty of Embraer and can not be used or reproduced without written permission. E-JETS EVOLUTION 70 80 90 100 110 120 130 +4 SEATS SAME +14 SEATS 20% 20% E190-E2 E195-E2 E175-E2 16 capacity: 120-136 seats range: 2,000nm capacity: 97-114 seats range: 2,800nm capacity: 80-90 seats range: 1,920nm * FUEL BURN PER SEAT -16%* -24%* -16%*
  • 17.
    This information isproperty of Embraer and can not be used or reproduced without written permission. E175-E2 NEW WING More efficient, high aspect ratio metallic wing. Raked wing tip. IMPROVED AVIONICS 4 larger 13”x10” displays and touchscreen controls MAIN LANDING GEAR Enabling larger engines. Gear doors for improved fuel efficiency OPTIMIZED WING/ENGINE DIFFERENT WING AND ENGINE COMBINATIONS FOR E175-E2 AND E190/195-E2 NEW ENGINES Larger fan diameter and improved fuel efficiency 17 E2 NEW FEATURES E190-E2 & E195-E2
  • 18.
    This information isproperty of Embraer and can not be used or reproduced without written permission. • EMBRAER INVESTMENT ON RESEARCH, DEVELOPMENT AND CAPEX FOR THE E-JETS E2 FAMILY WILL BE US$ 1.7 BILLION • INVESTMENT WILL BE SUPPORTED BY EMBRAER’S CASH GENERATION AND DEBT • INVESTMENTS SPAN FROM 2013 - 2020 WITH MORE CONCENTRATION IN 2014 - 2017 18 PROGRAM INVESTMENT
  • 19.
    This information isproperty of Embraer and can not be used or reproduced without written permission. E195-E2 | EIS 2019 E190-E2 | EIS 1H2018 E175-E2 | EIS 2020 267 Firm Orders 373 Commitments 19 E2 ENTRY INTO SERVICE 640 E-JETS E2
  • 20.
    This information isproperty of Embraer and can not be used or reproduced without written permission.
  • 21.
    This information isproperty of Embraer and can not be used or reproduced without written permission. NEARLY 850 JETS IN SERVICE IN MORE THAN 60 COUNTRIES 21
  • 22.
    This information isproperty of Embraer and can not be used or reproduced without written permission.22 PRODUCT PORTFOLIO LARGE AIRCRAFT MODEL SEATS /RANGE up to 8 occupants/ 1,178 nm up to 11 occupants/ 1,971 nm 7 to 9 passengers/ 2,300 nm 8 to 12 passengers/ 3,000 nm 13 to 14 passengers/ 3,400 nm 13 to 19 passengers/ 4,500 nm ENTRY LIGHT MID-LIGHT MID-SIZE ULTRA-LARGE SUPER MID-SIZE Certified: 2008 Certified: 2009 Certified: 2001 Certified: 2008 ULTRA-LONG RANGE COMPETITORS • Cessna - Mustang/M2 • HondaJet • Cessna - CJ2+/CJ3/CJ4 • Bombardier - Learjet 40XR/70 • Bombardier - Learjet 45XR/75 • Cessna - XLS+/Latitude • Bombardier - Learjet 85 • Cessna - Sovereign • Gulfstream - G150 • Bombardier - CL605/GL5000 • Dassault - Falcon 2000LXS/ 900LX • Gulfstream - G350/G450 • Airbus - ACJ 318/319/320 • Boeing - BBJ/BBJ2/BBJ3 13 to 14 passengers/ 3,900 nm Certified: 2010 • Bombardier - GL6000/GL7000/ GL8000 • Gulfstream - G500/G550/G650/ 650ER • Dassault - Falcon 7X/8X • Bombardier - CL300/CL850 • Cessna - X/Longitude • Dassault - Falcon 2000S • Gulfstream - G280 Certified: 2014 Certified: 2015
  • 23.
    This information isproperty of Embraer and can not be used or reproduced without written permission. DELIVERIES SHARE (UNITS)REVENUES SHARE (US$ BI | B&CA LIST PRICES) MARKET DELIVERIES 2014: 705 UNITS EMBRAER DELIVERIES: 116 UNITS BOMBARDIER MARKET REVENUES 2014: US$ 21.9 BILLION EMBRAER REVENUES: US$ 1.6 BILLION 23 MARKET SHARE HAWKER-BEECH DASSAULT CESSNAGULFSTREAMOTHERS
  • 24.
    This information isproperty of Embraer and can not be used or reproduced without written permission. 0% 4% 8% 12% 16% 20% 24% 28% 0 500 1.000 1.500 2.000 2.500 3.000 3.500 Q1Q2Q3Q4Q1Q2Q3Q4Q1Q2Q3Q4Q1Q2Q3Q4Q1Q2Q3Q4Q1Q2Q3Q4Q1Q2Q3Q4Q1Q2Q3Q4Q1Q2Q3Q4Q1Q2Q3Q4Q1Q2Q3Q4Q1Q2Q3Q4Q1Q2Q3Q4Q1Q2Q3Q4Q1Q2Q3Q4Q1Q2 2000 2001 2002 2003 2004 2005 2006 2007 2008 2009 2010 2011 2012 2013 2014 2015 %ofactivefleet Units Fleet older than 10 yrs Fleet from 6 to 10 yrs Fleet up to 5 yrs Positions Fleet up to 5 yrs and positions Total fleet % for sale Up to 10 yrs % for sale 24 BUSINESS JETS PRE-OWNED MARKET INVENTORY Source: Jetnet and Embraer analysis, April 2015 10.8% 2,179 jets 7.5% 616 jets
  • 25.
    This information isproperty of Embraer and can not be used or reproduced without written permission. IMPROVED ECONOMIC ENVIRONMENT IN US MAY DRIVE MARKET TURNAROUND 25 MARKET RECOVERY IN SLOW MOTION US 2015 GDP EXPECTED ABOVE 3.0% LOW OIL PRICE GENERATING OPPORTUNITIES US CORPORATE PROFITS AND HNWI AT RECORD LEVELS NEW PRODUCTS ENTERING INTO SERVICE TRAFFIC RECOVERY ON TRACK IN US BUT SLOWER THAN EXPECTED IN EU PRE-OWNED AIRCRAFT PRICES STABILIZED EUROPEAN MARKETS CONTINUE AT RISK; SOFTENING EMERGING MARKETS DEMAND
  • 26.
    This information isproperty of Embraer and can not be used or reproduced without written permission. 0 200 400 600 800 1000 1200 2008 2009 2010 2011 2012 2013 2014 2015 2016 2017 2018 2019 2020 2021 2022 2023 2024 Deliveries Forecast (units) 9,250 JETS AND US$ 265 BI IN THE NEXT 10 YEARS 26 2015-2024 MARKET FORECAST Units US$ 1.057 5 1.688 15 1.000 15 854 18 1.231 32 1.626 66 1.616 101 170 12 Deliveries Revenue N15YF Ultra Long Range Large Supermid Midsize Midlight Light Entry Ultra Large
  • 27.
    This information isproperty of Embraer and can not be used or reproduced without written permission. NORTH AMERICA 4,620 a/c (50%) US$ 120 Bi (45%) EUROPE, MIDDLE EAST & AFRICA 2,360 a/c (26%) US$ 77 Bi (29%) ASIA PACIFIC 570 a/c (6%) US$ 19 Bi (7%) LATIN AMERICA 850 a/c (9%) US$ 16 Bi (6%) CHINA 835 a/c (9%) US$ 33 Bi (12%) WORLDWIDE 9,250 units US$ 265 Bi 27 2015-2024 MARKET FORECAST BY REGION Note: sum of regional numbers might differ from total numbers due to rounding Source: Embraer Analysis
  • 28.
    This information isproperty of Embraer and can not be used or reproduced without written permission.
  • 29.
    This information isproperty of Embraer and can not be used or reproduced without written permission. OVER 50 ARMED FORCES 29
  • 30.
    This information isproperty of Embraer and can not be used or reproduced without written permission. SATELLITE INTEGRATED PORTFOLIO LIGHT ATTACK AND ADVANCED TRAINING TACTICAL MILITARY TRANSPORT ISR (INTELLIGENCE, SURVEILLANCE AND RECONNAISSANCE) UAVs RADARC4I LAND SYSTEMS SERVICES 30 TRANSPORT AIRCRAFTMODERNIZATION PROGRAMS • C2 & C4I SYSTEMS • AIRBORNE SYSTEMS • SIMULATION • CONTROL SYSTEMS • AIR TRAFFIC SYSTEM • UAVS • SIMULATORS • AVIONICS MODERNIZATION • LAND DEFENSE SYSTEMS INTEGRATION • SISFRON IMPLEMENTATION • MRO • AEROSTRUCTURES • REMOTE SENSING • AERIAL SURVEILLANCE RADAR • SATELLITE GEOSTATIONARY OF DEFENSE AND COMMUNICATIONS (SGDC) 100% 51% 65%90% 100%51% PARTNERSHIPS
  • 31.
    This information isproperty of Embraer and can not be used or reproduced without written permission. REVENUES EVOLUTION (US$ MILLION) BACKLOG EVOLUTION (US$ BILLION) 31 EMBRAER DEFENSE & SECURITY RESULTS REVENUES PARTICIPATION (%)
  • 32.
    This information isproperty of Embraer and can not be used or reproduced without written permission. BRAZIL: 99 COLOMBIA: 25 DOMINICAN REPUBLIC: 8 CHILE: 12 ECUADOR: 18 INDONESIA: 16 GREYSTONE (TACAIR): 1 MAURITANIA: 2 BURKINA FASO: 3 ANGOLA: 6 USA: 20 MALI: 6 GHANA: 5 TOTAL MARKET FORECAST: 300 AIRCRAFT / US$ 3.5 BILLION 800 2,000 700 MEDIUM-TERM LONG-TERM SHORT-TERM ADDRESSABLE MARKET FORECAST 2020 (US$ MILLION) PARTNERSHIP WITH BOEING TO PROVIDE WEAPONS INTEGRATION, INCREASING CAPABILITIES OF THE AIRCRAFT. • FIRM ORDERS: MORE THAN 220 AIRCRAFT • OVER 190 AIRCRAFT DELIVERED 32 SUPER TUCANO
  • 33.
    This information isproperty of Embraer and can not be used or reproduced without written permission. • A NEW TACTICAL MILITARY TRANSPORT AND TANKER AIRCRAFT • PARTNERSHIP WITH BOEING TO SHARE TECHNICAL KNOWLEDGE AND TO MARKET AND SELL THE KC-390 IN CERTAIN MARKETS • SIX COUNTRIES LETTERS OF INTENT, TOTALIZING 60 AIRCRAFT • FAB AND EMBRAER SIGNED THE SERIES PRODUCTION CONTRACT FOR 28 KC-390 • FIRST FLIGHT IN FEBRUARY 2015 TOTAL MARKET FORECAST 2025: 700 AIRCRAFT / US$ 50+ BI 33 EMBRAER KC-390 BRAZIL: 28 COLOMBIA: 12 ARGENTINA: 6 CHILE: 6 PORTUGAL: 6 CZECH REP.: 2
  • 34.
    This information isproperty of Embraer and can not be used or reproduced without written permission. SISFRON INTEGRATED BORDERS MONITORING SYSTEM FIRST PHASE: US$ 420 MILLION TOTAL ESTIMATE: US$ 4 BILLION COMPRISING RADARS, COMMUNICATION NETWORKS, C4I, UNMANNED AIR VEHICLES (UAV) AND ARMORED VEHICLES SATELLITE ESTIMATE: US$ 400 MILLION PARTICIPATION IN THE FIRST BRAZILIAN GEOSTATIONARY SATELLITE 34 BRAZILIAN ARMY PRIORITIES
  • 35.
    This information isproperty of Embraer and can not be used or reproduced without written permission. F-X2 • BRAZILIAN GOVERNMENT CONTRACTED SAAB TO SUPPLY 36 GRIPEN NG FIGHTER JET. • EMBRAER AND SAAB ESTABLISHED PARTNERSHIP FOR JOINT PROGRAMME MANAGEMENT FOR BRAZIL’S F-X2 PROJECT. 35
  • 36.
    This information isproperty of Embraer and can not be used or reproduced without written permission. FINANCIAL RESULTS
  • 37.
    This information isproperty of Embraer and can not be used or reproduced without written permission. 115 99 113 86 100 53 52 55 43 47 2Q14 3Q14 4Q14 1Q15 2Q15 1,761 1,240 2,046 1,056 1,513 2Q14 3Q14 4Q14 1Q15 2Q15 NET REVENUES - US$ MILLION SG&A EXPENSES - US$ MILLION 37 NET REVENUES | SG&A EXPENSES SELLING EXPENSESG&A EXPENSES 2015 OUTLOOK: US$ 5.8 – 6.3 BILLION YTD: 2,569 151 168168 147 129 YTD: 276
  • 38.
    This information isproperty of Embraer and can not be used or reproduced without written permission. 357 346 359 213 216 2Q14 3Q14 4Q14 1Q15 2Q15 421 213 690 167 404 2Q14 3Q14 4Q14 1Q15 2Q15 972 661 975 662 883 2Q14 3Q14 4Q14 1Q15 2Q15 1,761 1,240 2,045 1,056 1,513 2Q14 3Q14 4Q14 1Q15 2Q15 NET REVENUES BY SEGMENT OUTLOOK: US$ 1.70 – 1.85 BILLION OUTLOOK: US$ 0.80 – 0.95 BILLION OUTLOOK: US$ 3.20 – 3.40 BILLIONOUTLOOK: US$ 5.80 – 6.30 BILLION 38 YTD: 2.57 BILLION YTD: 1.54 BILLION YTD: 0.57 BILLION YTD: 0.43 BILLION
  • 39.
    This information isproperty of Embraer and can not be used or reproduced without written permission. 261 136 281 149 178 14.8% 11.0% 13.8% 14.1% 11.7% 2Q14 3Q14 4Q14 1Q15 2Q15 187 68 196 80 102 10.6% 5.5% 9.6% 7.5% 6.8% 2Q14 3Q14 4Q14 1Q15 2Q15 39 INCOME FROM OPERATIONS (EBIT) | EBITDA EBIT - US$ MILLION EBITDA - US$ MILLION EBIT EBIT MARGIN EBITDA EBITDA MARGIN 2015 OUTLOOK: US$ 490 – 560 MILLION | 8.5% – 9.0% 2015 OUTLOOK: US$ 730 – 860 MILLION | 12.6% – 13.6% YTD: 182 | 7.1% YTD: 327 | 12.7%
  • 40.
    This information isproperty of Embraer and can not be used or reproduced without written permission. 13 49 507 (291) 245 (60) (89) (87) (57) (74) (103) (97) (132) (91) (98) (150) (138) 288 (440) 73 2Q14 3Q14 4Q14 1Q15 2Q15 143 (11) 91 (62) 129 8.1% -0.9% 4.5% -5.8% 8.5% 2Q14 3Q14 4Q14 1Q15 2Q15 NET INCOME - US$ MILLION FREE CASH FLOW - US$ MILLION FREE CASH FLOW NET ADDITIONS TO PP&E NET CASH GENERATED (USED) BY OPERATING ACTIVITIES* ADDITIONS TO INTANGIBLE * Net of Financial assets adjustment 40 NET INCOME | FREE CASH FLOW NET MARGINNET INCOME 2015 OUTLOOK: FCF > (US$ 100) MILLION YTD: 68 | 2.6% YTD: (367)
  • 41.
    This information isproperty of Embraer and can not be used or reproduced without written permission. 2,439 2,767 2,405 2,696 2,640 2Q14 3Q14 4Q14 1Q15 2Q15 41 INVENTORIES US$ MILLION
  • 42.
    This information isproperty of Embraer and can not be used or reproduced without written permission. 18 84 94 50 300 300 RESEARCH DEVELOPMENT CAPEX 42 INVESTMENTS YTD: 196 2015 OUTLOOK: US$ 650 MILLION 2015 OUTLOOK2015 YTD US$ MILLION
  • 43.
    This information isproperty of Embraer and can not be used or reproduced without written permission. (114) (327) (85) (581) (511) 2Q14 3Q14 4Q14 1Q15 2Q15 96% 96% 96% 89% 90% 4% 4% 4% 11% 10% 5.7 5.6 5.4 5.3 6.5 2Q14 3Q14 4Q14 1Q15 2Q15 43 INDEBTEDNESS PROFILE | NET CASH INDEBTEDNESS MATURITY NET CASH (DEBT) - US$ MILLION LONG-TERM SHORT-TERM LOANS AVERAGE MATURITY (YEARS) TOTAL DEBT 2Q15: US$ 3.53 BILLION TOTAL CASH 2Q15: US$ 3.02 BILLION
  • 44.
    This information isproperty of Embraer and can not be used or reproduced without written permission. USD Debt 2,697 77% BRL Debt 756 21% EUR Debt 76 2% 1,086 1,933 41 365 437 92 75 205 79 549 539 1,122 44 INDEBTEDNESS PRINCIPAL MATURITIESCASHLOCALCASHABROAD PRINCIPAL MATURITIES = US$ 3.5 BILLION 3,019
  • 45.
    This information isproperty of Embraer and can not be used or reproduced without written permission. 1.83 0.62 1.92 1.88 1.82 34% 116% 26% 26% 27% 2010 2011 2012 2013 2014 45 EPADS AND PAY OUT EPADS PAY OUT US$
  • 46.
    This information isproperty of Embraer and can not be used or reproduced without written permission. 736,049,762 VOTING SHARES 46 OWNERSHIP STRUCTURE – 2Q15
  • 47.
    This information isproperty of Embraer and can not be used or reproduced without written permission. 2015 OUTLOOK
  • 48.
    This information isproperty of Embraer and can not be used or reproduced without written permission. NET REVENUES US$ 5.8 – 6.3 BILLION 48 2015 CONSOLIDATED OUTLOOK 15% OF NET REVENUES 2% OF NET REVENUES 29% OF NET REVENUES 54% OF NET REVENUES DELIVERIES: 95 TO 100 E-JETS US$ 100 MILLION US$ 1.70 – 1.85 BILLION US$ 0.80 – 0.95 BILLION OTHER REVENUES US$ 3.20 – 3.40 BILLION DELIVERIES: 80 TO 90 LIGHT JETS 35 TO 40 LARGE JETS
  • 49.
    This information isproperty of Embraer and can not be used or reproduced without written permission. EBITDA MARGIN 12.6% – 13.6% EBITDA US$ 730 – 860 MILLION EBIT MARGIN 8.5% – 9.0% EBIT US$ 490 – 560 MILLION FCF > (US$ 100) MILLION* 49 2015 CONSOLIDATED OUTLOOK * FCF USE OF LESS THAN US$ 100 MILLION. RESEARCH US$ 50 MILLION DEVELOPMENT US$ 300 MILLION CAPEX US$ 300 MILLION TOTAL INVESTMENTS: US$ 650 MILLION
  • 50.
    This information isproperty of Embraer and can not be used or reproduced without written permission. BRAZILIAN ALLIANCE FOR BIO-FUEL ISO 14001 AND OHSAS 18001 CERTIFICATIONS 1ST ETHANOL POWERED AIRCRAFT IN THE WORLD GREENER TECHNOLOGY SOCIAL ACTIVITIES 50 SUSTAINABILITY INITIATIVES REFORESTATION PROJECTS RECYCLING CORPORATE VALUES
  • 51.
    This information isproperty of Embraer and can not be used or reproduced without written permission. INVESTOR RELATIONS PHONE: +55 12 3927 4404 INVESTOR.RELATIONS@EMBRAER.COM.BR WWW.EMBRAER.COM
  • 52.
    This information isproperty of Embraer and can not be used or reproduced without written permission. This presentation may contain forward-looking statements, projections and estimates regarding circumstances or events yet to take place, including, but not limited to, those statements relating to guidance. These forward- looking statements are based largely on current expectations, forecasts of future events and industry and financial trends that affect Embraer’s businesses. These statements are subject to risks, uncertainties and assumptions that include, among others: general economic, political and trade conditions, both in Brazil and in those markets where Embraer does business; management’s expectations and estimates concerning the company’s future financial performance; plans and objectives of our management; financing plans and programs, and the effects of competition; industry trends and growth opportunities; inflation and fluctuations in exchange rates; the company’s investment plans; Embraer’s operating efficiencies and synergies and its capacity to develop and deliver products on the dates previously agreed upon; results of operation; business strategies; benefits of new technologies and existing and future governmental regulations. To obtain further information on factors that may lead to results different from those forecast by Embraer, please consult the reports Embraer files with the U.S. Securities and Exchange Commission (SEC) and the Brazilian Comissão de Valores Mobiliários (CVM) and in particular the factors discussed under “Forward-Looking Statements” and “Risk Factors” in Embraer’s annual report on Form 20−F. The words “believe”, “may”, “will”, “estimate”, “intend”, “continue”, “anticipate”, “expect” and other similar terms are intended to identify forward-looking statements. Embraer does not undertake any obligation to publish updates or to revise any forward-looking statements due to new information, future events or any other factors. In view of the inherent risks and uncertainties, such estimates, events and circumstances may not occur. The actual results and performance of Embraer could therefore differ substantially from those anticipated in Embraer's forward-looking statements. 52 FORWARD LOOKING STATEMENT