Download as PDF, PPTX
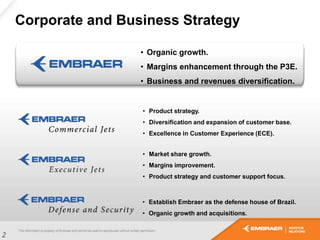
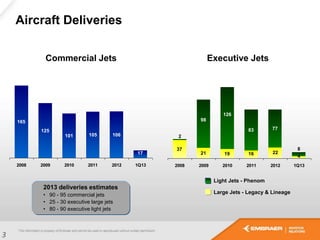
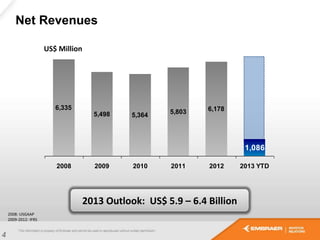
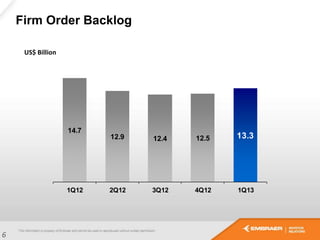
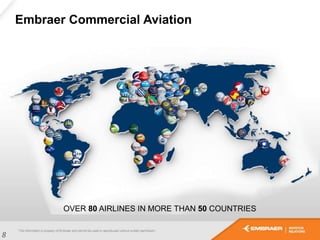
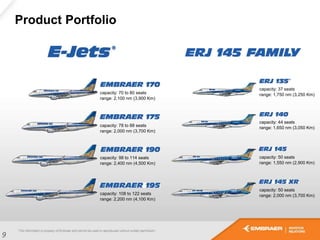
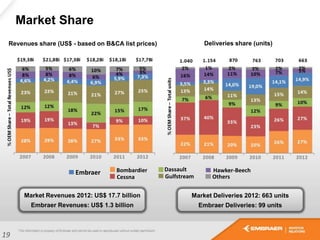


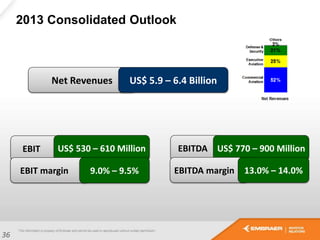
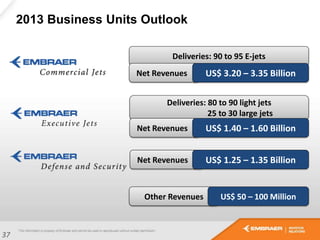


This document provides an overview of Embraer's business strategy, financial performance, and outlook. Some key points: - Embraer aims to grow organically and through acquisitions while improving margins. Its strategy focuses on product excellence, expanding customer base, and establishing itself in defense. - In 2012, Embraer delivered over 200 aircraft and had revenues of $6.2 billion. Its backlog was $13.3 billion. - For 2013, Embraer forecasts revenues between $5.9-6.4 billion and net orders of 90-95 commercial jets. - Embraer has a broad commercial aircraft portfolio from 70-seat ERJ-145 to 120-seat E


