Download to read offline


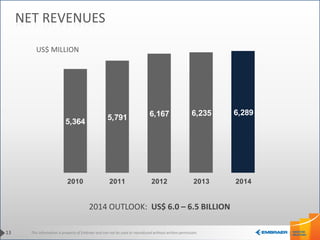

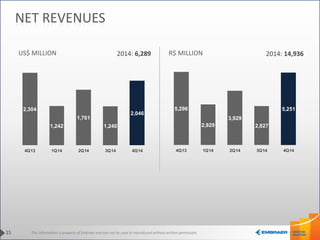
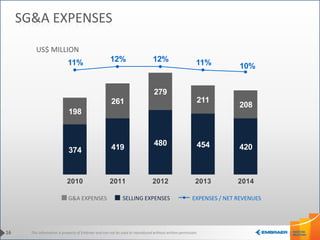
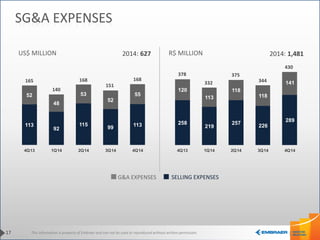
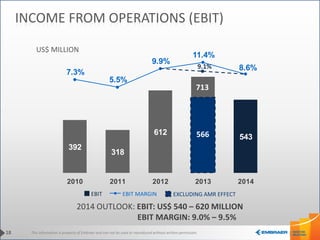
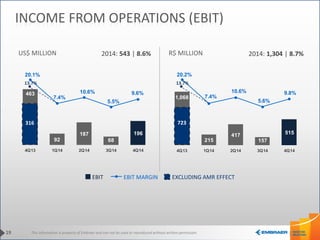
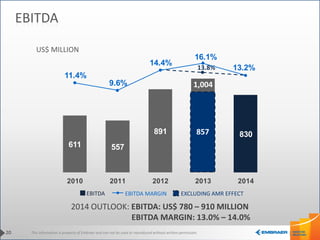
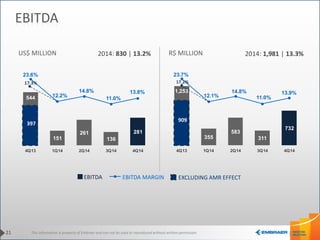
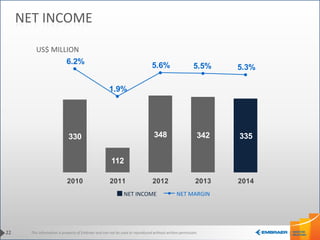
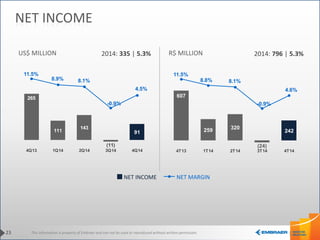
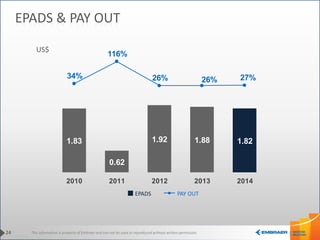
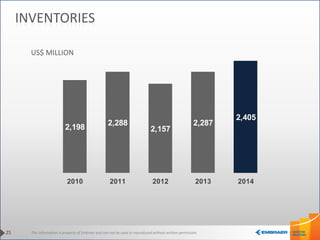
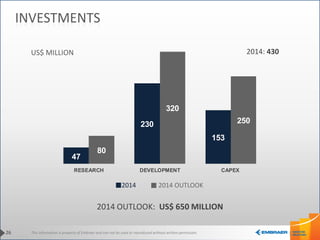
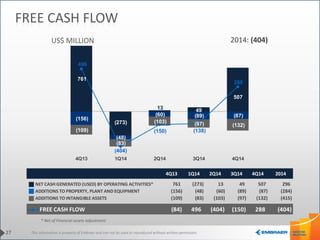
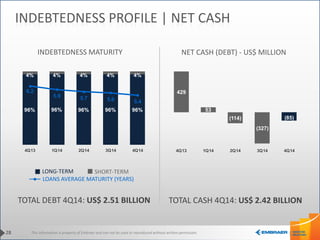


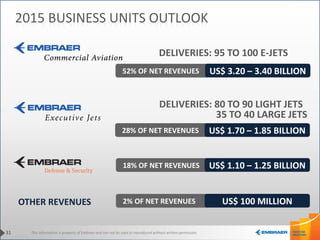


This document provides Embraer's earnings results for the fourth quarter and full year of 2014. It summarizes key financial highlights including commercial, executive, and defense aircraft deliveries and orders. It also provides Embraer's financial results for net revenues, expenses, EBITDA, net income, inventories, investments and cash flow. The presentation concludes with Embraer's outlook for 2015, forecasting net revenues of $6.1-6.6 billion, EBITDA of $730-860 million, and a 2015 consolidated outlook.


