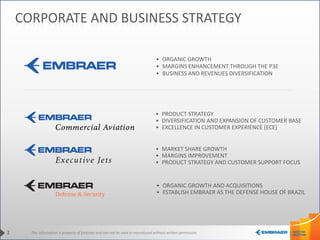
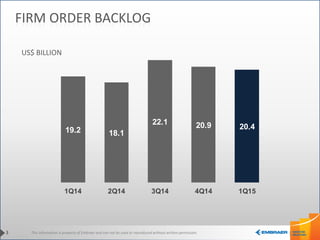
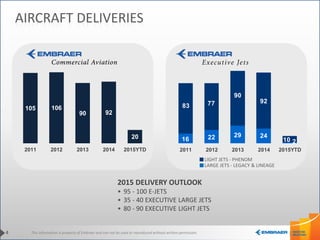
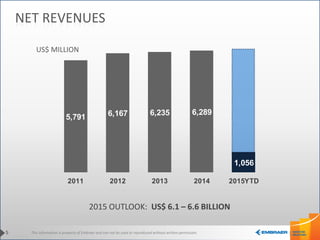
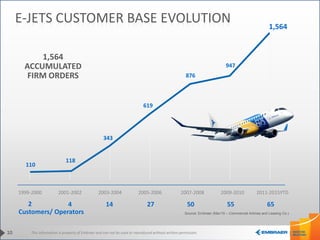
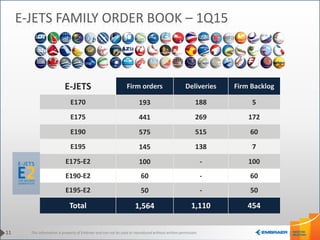
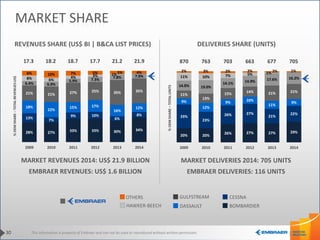
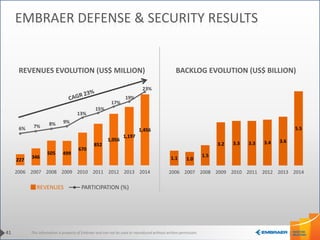
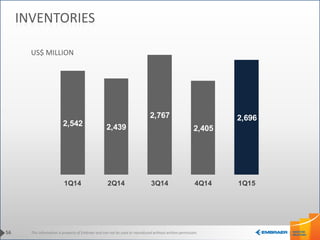
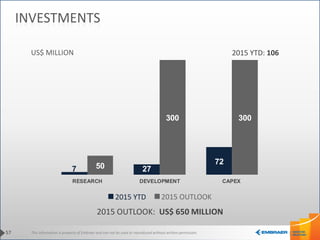
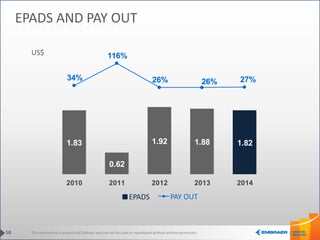
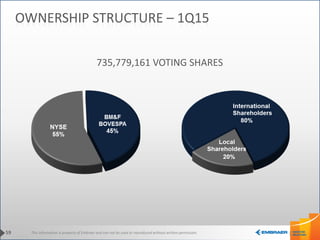
This information is property of Embraer and can not be used or reproduced without written permission.MAY 2015
+55 12 3927 4404 | investor.relations@embraer.com.br | www.embraer.com
This information is property of Embraer and can not be used or reproduced without written permission.2
CORPORATE AND BUSINESS STRATEGY
• ORGANIC GROWTH
• MARGINS ENHANCEMENT THROUGH THE P3E
• BUSINESS AND REVENUES DIVERSIFICATION
• ORGANIC GROWTH AND ACQUISITIONS
• ESTABLISH EMBRAER AS THE DEFENSE HOUSE OF BRAZIL
• PRODUCT STRATEGY
• DIVERSIFICATION AND EXPANSION OF CUSTOMER BASE
• EXCELLENCE IN CUSTOMER EXPERIENCE (ECE)
• MARKET SHARE GROWTH
• MARGINS IMPROVEMENT
• PRODUCT STRATEGY AND CUSTOMER SUPPORT FOCUS
This information is property of Embraer and can not be used or reproduced without written permission.
FIRM ORDER BACKLOG
US$ BILLION
3
19.2 18.1
22.1 20.9 20.4
1Q14 2Q14 3Q14 4Q14 1Q15
This information is property of Embraer and can not be used or reproduced without written permission.
LARGE JETS - LEGACY & LINEAGE
LIGHT JETS - PHENOM
105 106
90 92
20
2011 2012 2013 2014 2015YTD
AIRCRAFT DELIVERIES
4
16 22 29 24
2
83 77
90
92
10
2011 2012 2013 2014 2015YTD
2015 DELIVERY OUTLOOK
• 95 - 100 E-JETS
• 35 - 40 EXECUTIVE LARGE JETS
• 80 - 90 EXECUTIVE LIGHT JETS
This information is property of Embraer and can not be used or reproduced without written permission.
5,791 6,167 6,235 6,289
1,056
2011 2012 2013 2014 2015YTD
5
NET REVENUES
US$ MILLION
2015 OUTLOOK: US$ 6.1 – 6.6 BILLION
This information is property of Embraer and can not be used or reproduced without written permission.
24% 29%
48%
31% 22%
14%
14% 21%
21%3%
8%
3%
14%
6%
4%5% 9% 4%
9% 5% 6%
2012 2013 2014
61%
53% 50%
21%
27%
26%
17% 19% 23%
1% 1% 1%
2012 2013 2014
REVENUES BREAKDOWN
NET REVENUES BY SEGMENT NET REVENUES BY REGION
COMMERCIAL AVIATION
EXECUTIVE AVIATION OTHERS
DEFENSE & SECURITY
Revenues
US$ Billion 6.17 6.24 6.29
Revenues
US$ Billion6.17 6.24 6.29
NORTH AMERICA BRAZIL
EUROPE
ASIA PACIFIC
SOUTH & CENTRAL
AMERICA
AFRICA &
MIDDLE EAST
CHINA
6
This information is property of Embraer and can not be used or reproduced without written permission.
OVER 80 AIRLINES IN MORE THAN 50 COUNTRIES
EMBRAER COMMERCIAL AVIATION
8
This information is property of Embraer and can not be used or reproduced without written permission.
capacity: 70 to 80 seats
range: 2,100nm (3,900Km)
capacity: 78 to 88 seats
range: 2,000nm (3,700Km)
capacity: 98 to 114 seats
range: 2,400nm (4,500Km)
capacity: 108 to 122 seats
range: 2,200nm (4,100Km)
PRODUCT PORTFOLIO
capacity: 37 seats
range: 1,750nm (3,250Km)
capacity: 44 seats
range: 1,650nm (3,050Km)
capacity: 50 seats
range: 1,550nm (2,900Km)
capacity: 50 seats
range: 2,000nm (3,700Km)
9
This information is property of Embraer and can not be used or reproduced without written permission.
E-JETS CUSTOMER BASE EVOLUTION
1999-2000 2001-2002 2003-2004 2005-2006 2007-2008 2009-2010 2011-2015YTD
2 4 14 27 50 55 65
Customers/ Operators
110
118
343
619
876
947
1,564
1,564
ACCUMULATED
FIRM ORDERS
10
Source: Embraer (Mar/15 – Commercial Airlines and Leasing Co.)
This information is property of Embraer and can not be used or reproduced without written permission.
E-JETS Firm orders Deliveries Firm Backlog
E170 193 188 5
E175 441 269 172
E190 575 515 60
E195 145 138 7
E175-E2 100 - 100
E190-E2 60 - 60
E195-E2 50 - 50
Total 1,564 1,110 454
11
E-JETS FAMILY ORDER BOOK – 1Q15
This information is property of Embraer and can not be used or reproduced without written permission.
15%
24%
61%
Latin America
Asia Pacific & China
E-JETS CUSTOMER BASE BY BUSINESS MODEL
FIRM ORDERS
COMMERCIAL JETS – NET ORDERS MARKET SHARE
Considering Accumulated Net Orders
70-130 SEATS JETS
BACKLOG
North America
Regional Airlines
Network Airlines
Low Cost Carriers
12%
7%
25%
19%
37%
17%
2%
5%
3%
73%
12
WORLDWIDE DISTRIBUTION
(% OF E-JETS FLEET+BACKLOG)
Europe & CIS
Middle East & Africa
This information is property of Embraer and can not be used or reproduced without written permission.
helping airlines to be more efficient
13
E-JETS DEPLOYMENT
48%
25%
7%
20%
North America
39%
11%
14%
36%
Europe/CIS
76%
16%
5%
3%
Africa/Middle East
40%
46%
5%
9%
Asia Pacific
45% 28% 7% 20%WORLD
RIGHT-SIZING NEW MARKETS REPLACEMENT
OF OLD JETS
NATURAL
GROWTH
36%
40%
6%
18%
Latin America
12%
64%
24%
China
This information is property of Embraer and can not be used or reproduced without written permission.
• REPLACEMENT OF OLD/INEFFICIENT JETS
• RIGHT-SIZING OF NARROW-BODY OPERATIONS
• HUB FEEDER AND POINT-POINT OPERATION IN LOW AND MID-DENSITY MARKETS
• REGIONAL AVIATION DEVELOPMENT
AROUND 6,250 JET DELIVERIES (70-130 SEATS) IN THE NEXT 20 YEARS (US$ 300 BI)
14
PROJECTED DELIVERIES - JETS
MARKET SEGMENT
(SEATS)
2014 – 2033
DELIVERIES
70 - 90 2,300
90 - 130 3,950
70 -130 6,250
EMBRAER MARKET FORECAST (2014 – 2033)
NORTH
AMERICA
2,010
32%
LATIN
AMERICA
700
11%
AFRICA
230
4%
EUROPE
1,140
18%
MIDDLE
EAST
250
4%
CIS
380
6%
CHINA
1,020
17%
ASIA
PACIFIC
520
8%
This information is property of Embraer and can not be used or reproduced without written permission.15
COMPETITIVE SCENARIO 70-130 SEATS
130
120
110
100
90
80
70
SSJ95/100
MRJ90
ARJ21
CRJ900
CRJ1000
CRJ700
CAPACITY
(SINGLE CLASS)
737-7 MAXA319 NEO
CS100
CS300
E-195
E-190
E-175
E-170
This information is property of Embraer and can not be used or reproduced without written permission.
RIGHT CAPACITIES TO MATCH MARKET DEMAND
70
80
90
100
110
120
130
+4 SEATS
SAME
+14 SEATS
20%
20%
E190-E2
E195-E2
E175-E2
17
capacity: 120-136 seats
range: 2,000nm
capacity: 97-114 seats
range: 2,800nm
capacity: 80-90 seats
range: 1,920nm
This information is property of Embraer and can not be used or reproduced without written permission.
E175-E2
NEW WING
More efficient, high aspect ratio
metallic wing. Raked wing tip.
IMPROVED AVIONICS
4 larger 13”x10” displays
and touchscreen controls
MAIN LANDING GEAR
Enabling larger engines. Gear doors
for improved fuel efficiency
OPTIMIZED WING/ENGINE
DIFFERENT WING AND ENGINE COMBINATIONS FOR E175-E2 AND E190/195-E2
NEW ENGINES
Larger fan diameter and
improved fuel efficiency
18
E2 NEW FEATURES – NOT JUST A RE-ENGINE
E190-E2 & E195-E2
This information is property of Embraer and can not be used or reproduced without written permission.
• HIGHEST COMMONALITY AMONG
E-JETS E2 MODELS (AAA)
• FULL FLIGHT SIMULATOR OR HIGH - LEVEL
FLIGHT TRAINING DEVICE NOT REQUIRED
• FEWER THAN 3 DAYS TRANSITION
TRAINING BETWEEN THE TWO E-JET
GENERATIONS
19
E-JETS & E-JETS E2 PILOT COMMONALITY
• SAME TYPE RATING COMMONALITY
BETWEEN E-JETS E2 AND CURRENT E-JETS
FAMILY (CCC)
This information is property of Embraer and can not be used or reproduced without written permission.20
E-JETS E2 SUPPLIERS
PACIS
Fuel System
Water & Waste
Pax Oxygen
Crew Oxygen
External Lights
Hydraulic Pumps
Cabin Management Sys
Cabin Lights
Emergency Battery
Passenger Service Unit
Control Wheel
Column-by-Wire
Control Pedals
Avionics
Powerplant / APU
Flight Controls
E-bay Cooling Sensors
Fans package
Recirculation Filter
AMS
LG Controls
Pilots Seats
Observer Seat
FA seats
Cockpit Printer
Cockpit Lighting
Vertical and
Horizontal Tail
Doors (Pax, Service & OWE)
Spoilers / Ailerons
Center III, Rear Fuselage
Rudder, Elevator, Insulation
Wheels & Brakes
APU Electrical System
(Generation, Distribution,
Emergency, Batteries e Converters)
This information is property of Embraer and can not be used or reproduced without written permission.
FUEL BURN PER SEAT
E175-E2 (80 seats)
vs. E175 (76 seats)
E190-E2 (97 seats)
vs. E190 (97 seats)
E195-E2 (120 seats)
vs. E195 (106 seats)
-16%
-24%
-16%
0%
-5%
-10%
-15%
-20%
-25%
Target values for 600 nm sector; Dual Class configuration;
21
FUEL BURN IMPROVEMENTS
This information is property of Embraer and can not be used or reproduced without written permission.
180+
160
140
120
100
80
SSJ95/100
MRJ90 ARJ21CRJ900
CRJ1000
CRJ700
CAPACITY
(SINGLE CLASS)
737-7 MAXA319neo
A320neo
737-8MAX
CS100
CS300
E175-E2
E190-E2
E195-E2
22
NEW COMPETITIVE SCENARIO
This information is property of Embraer and can not be used or reproduced without written permission.
• EMBRAER INVESTMENT ON RESEARCH, DEVELOPMENT AND
CAPEX FOR THE E-JETS E2 FAMILY WILL BE US$ 1.7 BILLION
• INVESTMENT WILL BE SUPPORTED BY EMBRAER’S CASH
GENERATION AND DEBT
• INVESTMENTS SPAN FROM 2013 - 2020 WITH MORE
CONCENTRATION IN 2014 - 2017
23
PROGRAM INVESTMENT
This information is property of Embraer and can not be used or reproduced without written permission.
Preliminary Information as of January, 2013 -- US$ 3.3/USGal, 10 years NPV @ 9% rate
BETTER FUEL CONSUMPTION GAIN
• E175 E2: US$ 4.8M
• E190 E2: US$ 7.0M
• E195 E2: US$ 6.5M
MAINTENANCE COST REDUCTION GAIN
• US$ 1.0~1.5ME175
AR (8E5): 42.9
E190
AR (10E5):47.4
E195
AR (10E5): 50.1
E-Jets
E175-E2
46.8
E190-E2
53.6
E195-E2
60.4
delta: 3.9 M
delta: 6.2 M
delta: 10.3 M
E-Jets E2
SEAT CAPACITY INCREASE GAIN
• E175 E2: US$ 1.6M (4 SEATS)
• E195 E2: US$ 4.8M (14 SEATS)
24
LIST PRICES (US$ MILLION)
This information is property of Embraer and can not be used or reproduced without written permission.25
PROGRAM UPDATE
E190-E2
• FIRST METAL CUT IN OCTOBER 2014
E195-E2
• JOINT DEFINITION PHASE ON GOING
• MORE THAN 80% OF PRELIMINARY
DESIGN REVIEWS PERFORMED
E175-E2
• PRELIMINARY STUDIES PHASE CONCLUDED
• INITIAL DEFINITION PHASE CONCLUDED
• JOINT DEFINITION PHASE STARTED
This information is property of Embraer and can not be used or reproduced without written permission.
E195-E2 | EIS 2019
E190-E2 | EIS 1H2018
E175-E2 | EIS 2020
210 Firm Orders
380 Commitments
26
E2 ENTRY INTO SERVICE
590 E-JETS E2
This information is property of Embraer and can not be used or reproduced without written permission.
NEARLY 850 JETS IN SERVICE IN MORE THAN 50 COUNTRIES
28
EMBRAER EXECUTIVE JETS
This information is property of Embraer and can not be used or reproduced without written permission.29
PRODUCT PORTFOLIO
LARGE
AIRCRAFT MODEL SEATS /RANGE
up to 8 occupants/
1,178 nm
up to 11 occupants/
1,971 nm
7 to 9 passengers/
2,300 nm
8 to 12 passengers/
3,000 nm
13 to 14 passengers/
3,400 nm
13 to 19 passengers/
4,500 nm
ENTRY
LIGHT
MID-LIGHT
MID-SIZE
ULTRA-LARGE
SUPER MID-SIZE
Certified: 2008
Certified: 2009
UNDER DEVELOPMENT
Certified: 2001
Certified: 2008
ULTRA-LONG RANGE
COMPETITORS
• Cessna - Mustang/M2
• HondaJet
• Cessna - CJ2+/CJ3/CJ4
• Bombardier - Learjet 40XR/70
• Bombardier - Learjet 45XR/75
• Cessna - XLS+/Latitude
• Bombardier - Learjet 85
• Cessna - Sovereign
• Gulfstream - G150
• Bombardier - CL605/GL5000
• Dassault - Falcon 2000LXS/
900LX
• Gulfstream - G350/G450
• Airbus - ACJ 318/319/320
• Boeing - BBJ/BBJ2/BBJ3
13 to 14 passengers/
3,900 nm
Certified: 2010
• Bombardier - GL6000/GL7000/
GL8000
• Gulfstream - G500/G550/G650/
650ER
• Dassault - Falcon 7X/8X
• Bombardier - CL300/CL850
• Cessna - X/Longitude
• Dassault - Falcon 2000S
• Gulfstream - G280
Certified: 2014
This information is property of Embraer and can not be used or reproduced without written permission.
DELIVERIES SHARE (UNITS)REVENUES SHARE (US$ BI | B&CA LIST PRICES)
MARKET DELIVERIES 2014: 705 UNITS
EMBRAER DELIVERIES: 116 UNITS
BOMBARDIER
MARKET REVENUES 2014: US$ 21.9 BILLION
EMBRAER REVENUES: US$ 1.6 BILLION
30
MARKET SHARE
HAWKER-BEECH DASSAULT
CESSNAGULFSTREAMOTHERS
This information is property of Embraer and can not be used or reproduced without written permission.31
MARKET DRIVERS
This information is property of Embraer and can not be used or reproduced without written permission.
0%
4%
8%
12%
16%
20%
24%
28%
0
500
1,000
1,500
2,000
2,500
3,000
3,500
Q1Q2Q3Q4Q1Q2Q3Q4Q1Q2Q3Q4Q1Q2Q3Q4Q1Q2Q3Q4Q1Q2Q3Q4Q1Q2Q3Q4Q1Q2Q3Q4Q1Q2Q3Q4Q1Q2Q3Q4Q1Q2Q3Q4Q1Q2Q3Q4Q1Q2Q3Q4Q1Q2Q3Q4Q1Q2Q3Q4Q1Q2
2000 2001 2002 2003 2004 2005 2006 2007 2008 2009 2010 2011 2012 2013 2014 2015
%ofactivefleet
Units
Fleet older than 10 yrs Fleet from 6 to 10 yrs
Fleet up to 5 yrs Positions
Fleet up to 5 yrs and positions Total fleet % for sale
Up to 10 yrs % for sale
32
BUSINESS JETS PRE-OWNED MARKET INVENTORY
Source: Jetnet and Embraer analysis, April 2015
10.8%
2,179 jets
7.5%
616 jets
This information is property of Embraer and can not be used or reproduced without written permission.
IMPROVED ECONOMIC ENVIRONMENT IN US MAY DRIVE MARKET TURNAROUND
33
MARKET RECOVERY IN SLOW MOTION
US 2015 GDP EXPECTED ABOVE 3.0%
LOW OIL PRICE GENERATING OPPORTUNITIES
US CORPORATE PROFITS AND HNWI AT RECORD LEVELS
NEW PRODUCTS ENTERING INTO SERVICE
TRAFFIC RECOVERY ON TRACK IN US BUT SLOWER THAN EXPECTED IN EU
PRE-OWNED AIRCRAFT PRICES STABILIZED
EUROPEAN MARKETS CONTINUE AT RISK; SOFTENING EMERGING MARKETS DEMAND
This information is property of Embraer and can not be used or reproduced without written permission.
0
200
400
600
800
1000
1200
2008
2009
2010
2011
2012
2013
2014
2015
2016
2017
2018
2019
2020
2021
2022
2023
2024
Deliveries Forecast (units)
9,250 JETS AND US$ 265 BI IN THE NEXT 10 YEARS
34
2015-2024 MARKET FORECAST
Units US$
1,057
5
1,688
15
1,000
15
854
18
1,231
32
1,626
66
1,616
101
170
12
Deliveries Revenue
N15YF
Ultra Long Range
Large
Supermid
Midsize
Midlight
Light
Entry
Ultra Large
This information is property of Embraer and can not be used or reproduced without written permission.
NORTH AMERICA
4,620 a/c (50%)
US$ 120 Bi (45%)
EUROPE, MIDDLE EAST & AFRICA
2,360 a/c (26%)
US$ 77 Bi (29%)
ASIA PACIFIC
570 a/c (6%)
US$ 19 Bi (7%)
LATIN AMERICA
850 a/c (9%)
US$ 16 Bi (6%)
CHINA
835 a/c (9%)
US$ 33 Bi (12%)
WORLDWIDE
9,250 units
US$ 265 Bi
35
2015-2024 MARKET FORECAST BY REGION
Note: sum of regional numbers might differ from total numbers due to rounding
Source: Embraer Analysis
This information is property of Embraer and can not be used or reproduced without written permission.
NEARLY 70 SERVICE CENTERS WORLDWIDE.
EMBRAER SERVICE CENTER
AUTHORIZED SERVICE CENTER
36
SERVICE CENTER NETWORK
This information is property of Embraer and can not be used or reproduced without written permission.
OVER 50 ARMED FORCES
38
EMBRAER DEFENSE & SECURITY
This information is property of Embraer and can not be used or reproduced without written permission.
INTEGRATED PORTFOLIO
LIGHT ATTACK AND
ADVANCED TRAINING
TACTICAL MILITARY
TRANSPORT
ISR (INTELLIGENCE,
SURVEILLANCE AND
RECONNAISSANCE)
UAVs RADARC4I LAND SYSTEMS SERVICES
39
SATELLITE
TRANSPORT AIRCRAFTMODERNIZATION
PROGRAMS
This information is property of Embraer and can not be used or reproduced without written permission.
COMMAND AND
CONTROL
SYSTEMS
AIR TRAFFIC
MANAGEMENT
CONTROL
SYSTEMS OF
SYSTEMS
C4I
UAVS
SIMULATORS
MODERNIZATION
OF AVIONICS
SYSTEMS
LAND DEFENSE
SYSTEMS
INTEGRATION
SISFRON
IMPLEMENTATION
MRO
AERO
STRUCTURES
REMOTE
SENSING
AERIAL
SURVEILLANCE
RADAR
SATELLITE
GEOSTATIONARY OF
DEFENSE AND
COMMUNICATIONS
(SGDC)
100% 51% 65%90% 100%51%
40
PARTNERSHIPS
UAVs RADARC4I LAND SYSTEMS SERVICESSATELLITE
This information is property of Embraer and can not be used or reproduced without written permission.
REVENUES EVOLUTION (US$ MILLION) BACKLOG EVOLUTION (US$ BILLION)
41
EMBRAER DEFENSE & SECURITY RESULTS
REVENUES PARTICIPATION (%)
This information is property of Embraer and can not be used or reproduced without written permission.
BRAZIL: 99
COLOMBIA: 25
DOMINICAN REPUBLIC: 8
CHILE: 12
ECUADOR: 18
INDONESIA: 16
GREYSTONE (TACAIR): 1
MAURITANIA: 2
BURKINA FASO: 3
ANGOLA: 6
USA: 20
TOTAL MARKET FORECAST:
300 AIRCRAFT / US$ 3.5 BILLION
800
2,000
700
MEDIUM-TERM
LONG-TERM
SHORT-TERM
ADDRESSABLE MARKET FORECAST 2020
(US$ MILLION)
PARTNERSHIP WITH BOEING TO PROVIDE WEAPONS INTEGRATION, INCREASING CAPABILITIES OF THE AIRCRAFT.
• FIRM ORDERS: MORE THAN 210 AIRCRAFT
• OVER 190 AIRCRAFT DELIVERED
42
SUPER TUCANO
This information is property of Embraer and can not be used or reproduced without written permission.
• A new tactical military transport and tanker aircraft
• Partnership with Boeing to share technical knowledge and to market and sell the KC-390 in
certain markets
• Six countries letters of intent, totalizing 60 aircraft
• FAB and Embraer signed the series production contract for 28 KC-390
• First flight in February 2015
TOTAL MARKET FORECAST 2025:
700 AIRCRAFT / US$ 50+ BI
43
EMBRAER KC-390
BRAZIL (28)
COLOMBIA (12)
ARGENTINA (6)
CHILE (6)
PORTUGAL (6)
CZECH REP. (2)
This information is property of Embraer and can not be used or reproduced without written permission.
BRAZILIAN NAVY A-4
12 aircraft
BRAZILIAN AIR FORCE A-1M
43 aircraft
3 delivered
BRAZILIAN AIR FORCE F-5M
46 aircraft + 7 aircraft (2nd batch)
46 delivered
BRAZILIAN AIR FORCE E-99
5 aircraft EMB 145 AEW&C
A-4
ADDRESSABLE MARKET FORECAST 2025
(US$ MILLION)
TOTAL MARKET FORECAST:
228 AIRCRAFT / US$ 1.5 BILLION
437
567
505MEDIUM-TERM
LONG-TERM
SHORT-TERM
44
MODERNIZATION PROGRAMS
This information is property of Embraer and can not be used or reproduced without written permission.
SISFRON
Integrated Borders Monitoring System
First phase: US$ 420 Million
Total estimate: US$ 4 Billion
Comprising radars, communication networks, C4I,
unmanned air vehicles (UAV) and armored vehicles
SATELLITE
Estimate: US$ 400 Million
Participation in the first Brazilian Geostationary Satellite
Ref. dez/12
SENS
59%
COMM
9%
UAV
12% SW
20%
45
BRAZILIAN ARMY PRIORITIES
This information is property of Embraer and can not be used or reproduced without written permission.
2015 OUTLOOK
This information is property of Embraer and can not be used or reproduced without written permission.
EBITDA MARGIN 12.0% – 13.0%
NET REVENUES
EBITDA
US$ 6.1 – 6.6 BILLION
US$ 730 – 860 MILLION
EBIT MARGIN 8.0% – 8.5%
EBIT US$ 490 – 560 MILLION
FCF > (US$ 100) MILLION*
47
2015 CONSOLIDATED OUTLOOK
* FCF USE OF LESS THAN US$ 100 MILLION.
This information is property of Embraer and can not be used or reproduced without written permission.
2015 BUSINESS UNITS OUTLOOK
48
18% OF NET REVENUES
2% OF NET REVENUES
28% OF NET REVENUES
52% OF NET REVENUES
DELIVERIES: 95 TO 100 E-JETS
US$ 100 MILLION
US$ 1.70 – 1.85 BILLION
US$ 1.10 – 1.25 BILLION
OTHER REVENUES
US$ 3.20 – 3.40 BILLION
DELIVERIES: 80 TO 90 LIGHT JETS
35 TO 40 LARGE JETS
This information is property of Embraer and can not be used or reproduced without written permission.
TOTAL INVESTMENTS: US$ 650 MILLION
RESEARCH US$ 50 MILLION
DEVELOPMENT US$ 300 MILLION
CAPEX US$ 300 MILLION
49
2015 INVESTMENT OUTLOOK
This information is property of Embraer and can not be used or reproduced without written permission.
FINANCIAL RESULTS
This information is property of Embraer and can not be used or reproduced without written permission.
NET REVENUES - US$ MILLION SG&A EXPENSES - US$ MILLION
51
NET REVENUES | SG&A EXPENSES
SELLING EXPENSESG&A EXPENSES
2015 OUTLOOK: US$ 6.1 – 6.6 BILLION
92
115
99
113
86
48
53
52
55
43
1Q14 2Q14 3Q14 4Q14 1Q15
151
168168
140
129
1,242
1,761
1,240
2,046
1,056
1Q14 2Q14 3Q14 4Q14 1Q15
This information is property of Embraer and can not be used or reproduced without written permission.52
INCOME FROM OPERATIONS (EBIT) | EBITDA
EBIT - US$ MILLION EBITDA - US$ MILLION
EBIT EBIT MARGIN EBITDA EBITDA MARGIN
2015 OUTLOOK:
US$ 490 – 560 MILLION | 8.0% – 8.5%
2015 OUTLOOK:
US$ 730 – 860 MILLION | 12.0% – 13.0%
92
187
68
196
80
7.4%
10.6%
5.5%
9.6%
7.5%
1Q14 2Q14 3Q14 4Q14 1Q15
151
261
136
281
149
12.2%
14.8%
11.0%
13.8% 14.1%
1Q14 2Q14 3Q14 4Q14 1Q15
This information is property of Embraer and can not be used or reproduced without written permission.
NET INCOME - US$ MILLION FREE CASH FLOW - US$ MILLION
FREE CASH FLOW
NET ADDITIONS TO PP&E
NET CASH GENERATED (USED) BY OPERATING ACTIVITIES*
ADDITIONS TO INTANGIBLE
* Net of Financial assets adjustment
53
NET INCOME | FREE CASH FLOW
NET MARGINNET INCOME
111
143
(11)
91
(62)
8.9% 8.1%
-0.9%
4.5%
-5.9%
1Q14 2Q14 3Q14 4Q14 1Q15
(273)
13
49
507
(292)
(48)
(60) (89) (87)
(57)
(83)
(103) (97) (132)
(91)
(404)
(150) (138)
288
(440)
1Q14 2Q14 3Q14 4Q14 1Q15
2015 OUTLOOK: FCF > (US$ 100) MILLION
This information is property of Embraer and can not be used or reproduced without written permission.54
INDEBTEDNESS PRINCIPAL MATURITIESCASHLOCALCASHABROAD
PRINCIPAL MATURITIES = US$ 2.39 BILLION
This information is property of Embraer and can not be used or reproduced without written permission.55
INDEBTEDNESS PROFILE | NET CASH
INDEBTEDNESS MATURITY NET CASH (DEBT) - US$ MILLION
LONG-TERM SHORT-TERM
LOANS AVERAGE MATURITY (YEARS)
96% 96% 96% 96% 89%
4% 4% 4% 4% 11%
5.9
5.7 5.6 5.4 5.3
1Q14 2Q14 3Q14 4Q14 1Q15
TOTAL DEBT 1Q15: US$ 2.39 BILLION TOTAL CASH 1Q15: US$ 1.81 BILLION
53
(114)
(327)
(85)
(581)
1Q14 2Q14 3Q14 4Q14 1Q15
This information is property of Embraer and can not be used or reproduced without written permission.56
INVENTORIES
US$ MILLION
2,542 2,439
2,767
2,405
2,696
1Q14 2Q14 3Q14 4Q14 1Q15
This information is property of Embraer and can not be used or reproduced without written permission.57
INVESTMENTS
US$ MILLION 2015 YTD: 106
7 27
72
50
300 300
RESEARCH DEVELOPMENT CAPEX
2015 OUTLOOK: US$ 650 MILLION
2015 OUTLOOK2015 YTD
This information is property of Embraer and can not be used or reproduced without written permission.58
EPADS AND PAY OUT
EPADS PAY OUT
US$
1.83
0.62
1.92 1.88 1.82
34%
116%
26% 26% 27%
2010 2011 2012 2013 2014
This information is property of Embraer and can not be used or reproduced without written permission.
735,779,161 VOTING SHARES
59
OWNERSHIP STRUCTURE – 1Q15
This information is property of Embraer and can not be used or reproduced without written permission.
CORPORATE
INFORMATION
This information is property of Embraer and can not be used or reproduced without written permission.
BRAZILIAN ALLIANCE FOR BIO-FUEL
ISO 14001 AND OHSAS
18001 CERTIFICATIONS
1ST ETHANOL POWERED
AIRCRAFT IN THE WORLD
GREENER
TECHNOLOGY
SOCIAL ACTIVITIES
61
SUSTAINABILITY INITIATIVES
REFORESTATION PROJECTS
RECYCLING
CORPORATE VALUES
This information is property of Embraer and can not be used or reproduced without written permission.
E-JETS FINAL ASSEMBLY LINE TRANSFORMATION
E-JETS WING JUNCTION LINE TRANSFORMATION
Performance Indicators 2008
(15 ac/month)
2009
(10 ac/month)
2012
(10 ac/month)
Number of positions 12 5 4
Cycle time (days) 18 10 8
Work in Process
(US$ Mi)
212 95 68
Number of non-
conformity per a/c
32 1.7 0.76
Overtime
(% of work hours)
10 1.5 0
62
P3E – LEAN RESULTS
This information is property of Embraer and can not be used or reproduced without written permission.
KAIZEN - E-JETS CYCLE REDUCTION COST OF NON QUALITY REDUCTION
57%
40% REDUCTION ON THE PRODUCTION CYCLE
40%
44% REDUCTION ON CNQ
63
P3E – LEAN RESULTS
This information is property of Embraer and can not be used or reproduced without written permission.
COST: US$ 29.0 MILLION
BENEFIT: US$ 268.4 MILLION
64
“BOA IDEIA” PROGRAM EVOLUTION
This information is property of Embraer and can not be used or reproduced without written permission.
INVESTOR RELATIONS
PHONE: +55 12 3927 4404
INVESTOR.RELATIONS@EMBRAER.COM.BR
WWW.EMBRAER.COM
This information is property of Embraer and can not be used or reproduced without written permission.
This presentation may contain forward-looking statements, projections and estimates regarding circumstances
or events yet to take place, including, but not limited to, those statements relating to guidance. These forward-
looking statements are based largely on current expectations, forecasts of future events and industry and
financial trends that affect Embraer’s businesses. These statements are subject to risks, uncertainties and
assumptions that include, among others: general economic, political and trade conditions, both in Brazil and in
those markets where Embraer does business; management’s expectations and estimates concerning the
company’s future financial performance; plans and objectives of our management; financing plans and
programs, and the effects of competition; industry trends and growth opportunities; inflation and fluctuations
in exchange rates; the company’s investment plans; Embraer’s operating efficiencies and synergies and its
capacity to develop and deliver products on the dates previously agreed upon; results of operation; business
strategies; benefits of new technologies and existing and future governmental regulations. To obtain further
information on factors that may lead to results different from those forecast by Embraer, please consult the
reports Embraer files with the U.S. Securities and Exchange Commission (SEC) and the Brazilian Comissão de
Valores Mobiliários (CVM) and in particular the factors discussed under “Forward-Looking Statements” and
“Risk Factors” in Embraer’s annual report on Form 20−F. The words “believe”, “may”, “will”, “estimate”,
“intend”, “continue”, “anticipate”, “expect” and other similar terms are intended to identify forward-looking
statements. Embraer does not undertake any obligation to publish updates or to revise any forward-looking
statements due to new information, future events or any other factors. In view of the inherent risks and
uncertainties, such estimates, events and circumstances may not occur. The actual results and performance of
Embraer could therefore differ substantially from those anticipated in Embraer's forward-looking statements.
66
FORWARD LOOKING STATEMENT

Embraer may 2015 book ri

  • 1.
    This information isproperty of Embraer and can not be used or reproduced without written permission.MAY 2015 +55 12 3927 4404 | investor.relations@embraer.com.br | www.embraer.com
  • 2.
    This information isproperty of Embraer and can not be used or reproduced without written permission.2 CORPORATE AND BUSINESS STRATEGY • ORGANIC GROWTH • MARGINS ENHANCEMENT THROUGH THE P3E • BUSINESS AND REVENUES DIVERSIFICATION • ORGANIC GROWTH AND ACQUISITIONS • ESTABLISH EMBRAER AS THE DEFENSE HOUSE OF BRAZIL • PRODUCT STRATEGY • DIVERSIFICATION AND EXPANSION OF CUSTOMER BASE • EXCELLENCE IN CUSTOMER EXPERIENCE (ECE) • MARKET SHARE GROWTH • MARGINS IMPROVEMENT • PRODUCT STRATEGY AND CUSTOMER SUPPORT FOCUS
  • 3.
    This information isproperty of Embraer and can not be used or reproduced without written permission. FIRM ORDER BACKLOG US$ BILLION 3 19.2 18.1 22.1 20.9 20.4 1Q14 2Q14 3Q14 4Q14 1Q15
  • 4.
    This information isproperty of Embraer and can not be used or reproduced without written permission. LARGE JETS - LEGACY & LINEAGE LIGHT JETS - PHENOM 105 106 90 92 20 2011 2012 2013 2014 2015YTD AIRCRAFT DELIVERIES 4 16 22 29 24 2 83 77 90 92 10 2011 2012 2013 2014 2015YTD 2015 DELIVERY OUTLOOK • 95 - 100 E-JETS • 35 - 40 EXECUTIVE LARGE JETS • 80 - 90 EXECUTIVE LIGHT JETS
  • 5.
    This information isproperty of Embraer and can not be used or reproduced without written permission. 5,791 6,167 6,235 6,289 1,056 2011 2012 2013 2014 2015YTD 5 NET REVENUES US$ MILLION 2015 OUTLOOK: US$ 6.1 – 6.6 BILLION
  • 6.
    This information isproperty of Embraer and can not be used or reproduced without written permission. 24% 29% 48% 31% 22% 14% 14% 21% 21%3% 8% 3% 14% 6% 4%5% 9% 4% 9% 5% 6% 2012 2013 2014 61% 53% 50% 21% 27% 26% 17% 19% 23% 1% 1% 1% 2012 2013 2014 REVENUES BREAKDOWN NET REVENUES BY SEGMENT NET REVENUES BY REGION COMMERCIAL AVIATION EXECUTIVE AVIATION OTHERS DEFENSE & SECURITY Revenues US$ Billion 6.17 6.24 6.29 Revenues US$ Billion6.17 6.24 6.29 NORTH AMERICA BRAZIL EUROPE ASIA PACIFIC SOUTH & CENTRAL AMERICA AFRICA & MIDDLE EAST CHINA 6
  • 7.
    This information isproperty of Embraer and can not be used or reproduced without written permission.
  • 8.
    This information isproperty of Embraer and can not be used or reproduced without written permission. OVER 80 AIRLINES IN MORE THAN 50 COUNTRIES EMBRAER COMMERCIAL AVIATION 8
  • 9.
    This information isproperty of Embraer and can not be used or reproduced without written permission. capacity: 70 to 80 seats range: 2,100nm (3,900Km) capacity: 78 to 88 seats range: 2,000nm (3,700Km) capacity: 98 to 114 seats range: 2,400nm (4,500Km) capacity: 108 to 122 seats range: 2,200nm (4,100Km) PRODUCT PORTFOLIO capacity: 37 seats range: 1,750nm (3,250Km) capacity: 44 seats range: 1,650nm (3,050Km) capacity: 50 seats range: 1,550nm (2,900Km) capacity: 50 seats range: 2,000nm (3,700Km) 9
  • 10.
    This information isproperty of Embraer and can not be used or reproduced without written permission. E-JETS CUSTOMER BASE EVOLUTION 1999-2000 2001-2002 2003-2004 2005-2006 2007-2008 2009-2010 2011-2015YTD 2 4 14 27 50 55 65 Customers/ Operators 110 118 343 619 876 947 1,564 1,564 ACCUMULATED FIRM ORDERS 10 Source: Embraer (Mar/15 – Commercial Airlines and Leasing Co.)
  • 11.
    This information isproperty of Embraer and can not be used or reproduced without written permission. E-JETS Firm orders Deliveries Firm Backlog E170 193 188 5 E175 441 269 172 E190 575 515 60 E195 145 138 7 E175-E2 100 - 100 E190-E2 60 - 60 E195-E2 50 - 50 Total 1,564 1,110 454 11 E-JETS FAMILY ORDER BOOK – 1Q15
  • 12.
    This information isproperty of Embraer and can not be used or reproduced without written permission. 15% 24% 61% Latin America Asia Pacific & China E-JETS CUSTOMER BASE BY BUSINESS MODEL FIRM ORDERS COMMERCIAL JETS – NET ORDERS MARKET SHARE Considering Accumulated Net Orders 70-130 SEATS JETS BACKLOG North America Regional Airlines Network Airlines Low Cost Carriers 12% 7% 25% 19% 37% 17% 2% 5% 3% 73% 12 WORLDWIDE DISTRIBUTION (% OF E-JETS FLEET+BACKLOG) Europe & CIS Middle East & Africa
  • 13.
    This information isproperty of Embraer and can not be used or reproduced without written permission. helping airlines to be more efficient 13 E-JETS DEPLOYMENT 48% 25% 7% 20% North America 39% 11% 14% 36% Europe/CIS 76% 16% 5% 3% Africa/Middle East 40% 46% 5% 9% Asia Pacific 45% 28% 7% 20%WORLD RIGHT-SIZING NEW MARKETS REPLACEMENT OF OLD JETS NATURAL GROWTH 36% 40% 6% 18% Latin America 12% 64% 24% China
  • 14.
    This information isproperty of Embraer and can not be used or reproduced without written permission. • REPLACEMENT OF OLD/INEFFICIENT JETS • RIGHT-SIZING OF NARROW-BODY OPERATIONS • HUB FEEDER AND POINT-POINT OPERATION IN LOW AND MID-DENSITY MARKETS • REGIONAL AVIATION DEVELOPMENT AROUND 6,250 JET DELIVERIES (70-130 SEATS) IN THE NEXT 20 YEARS (US$ 300 BI) 14 PROJECTED DELIVERIES - JETS MARKET SEGMENT (SEATS) 2014 – 2033 DELIVERIES 70 - 90 2,300 90 - 130 3,950 70 -130 6,250 EMBRAER MARKET FORECAST (2014 – 2033) NORTH AMERICA 2,010 32% LATIN AMERICA 700 11% AFRICA 230 4% EUROPE 1,140 18% MIDDLE EAST 250 4% CIS 380 6% CHINA 1,020 17% ASIA PACIFIC 520 8%
  • 15.
    This information isproperty of Embraer and can not be used or reproduced without written permission.15 COMPETITIVE SCENARIO 70-130 SEATS 130 120 110 100 90 80 70 SSJ95/100 MRJ90 ARJ21 CRJ900 CRJ1000 CRJ700 CAPACITY (SINGLE CLASS) 737-7 MAXA319 NEO CS100 CS300 E-195 E-190 E-175 E-170
  • 16.
    This information isproperty of Embraer and can not be used or reproduced without written permission.
  • 17.
    This information isproperty of Embraer and can not be used or reproduced without written permission. RIGHT CAPACITIES TO MATCH MARKET DEMAND 70 80 90 100 110 120 130 +4 SEATS SAME +14 SEATS 20% 20% E190-E2 E195-E2 E175-E2 17 capacity: 120-136 seats range: 2,000nm capacity: 97-114 seats range: 2,800nm capacity: 80-90 seats range: 1,920nm
  • 18.
    This information isproperty of Embraer and can not be used or reproduced without written permission. E175-E2 NEW WING More efficient, high aspect ratio metallic wing. Raked wing tip. IMPROVED AVIONICS 4 larger 13”x10” displays and touchscreen controls MAIN LANDING GEAR Enabling larger engines. Gear doors for improved fuel efficiency OPTIMIZED WING/ENGINE DIFFERENT WING AND ENGINE COMBINATIONS FOR E175-E2 AND E190/195-E2 NEW ENGINES Larger fan diameter and improved fuel efficiency 18 E2 NEW FEATURES – NOT JUST A RE-ENGINE E190-E2 & E195-E2
  • 19.
    This information isproperty of Embraer and can not be used or reproduced without written permission. • HIGHEST COMMONALITY AMONG E-JETS E2 MODELS (AAA) • FULL FLIGHT SIMULATOR OR HIGH - LEVEL FLIGHT TRAINING DEVICE NOT REQUIRED • FEWER THAN 3 DAYS TRANSITION TRAINING BETWEEN THE TWO E-JET GENERATIONS 19 E-JETS & E-JETS E2 PILOT COMMONALITY • SAME TYPE RATING COMMONALITY BETWEEN E-JETS E2 AND CURRENT E-JETS FAMILY (CCC)
  • 20.
    This information isproperty of Embraer and can not be used or reproduced without written permission.20 E-JETS E2 SUPPLIERS PACIS Fuel System Water & Waste Pax Oxygen Crew Oxygen External Lights Hydraulic Pumps Cabin Management Sys Cabin Lights Emergency Battery Passenger Service Unit Control Wheel Column-by-Wire Control Pedals Avionics Powerplant / APU Flight Controls E-bay Cooling Sensors Fans package Recirculation Filter AMS LG Controls Pilots Seats Observer Seat FA seats Cockpit Printer Cockpit Lighting Vertical and Horizontal Tail Doors (Pax, Service & OWE) Spoilers / Ailerons Center III, Rear Fuselage Rudder, Elevator, Insulation Wheels & Brakes APU Electrical System (Generation, Distribution, Emergency, Batteries e Converters)
  • 21.
    This information isproperty of Embraer and can not be used or reproduced without written permission. FUEL BURN PER SEAT E175-E2 (80 seats) vs. E175 (76 seats) E190-E2 (97 seats) vs. E190 (97 seats) E195-E2 (120 seats) vs. E195 (106 seats) -16% -24% -16% 0% -5% -10% -15% -20% -25% Target values for 600 nm sector; Dual Class configuration; 21 FUEL BURN IMPROVEMENTS
  • 22.
    This information isproperty of Embraer and can not be used or reproduced without written permission. 180+ 160 140 120 100 80 SSJ95/100 MRJ90 ARJ21CRJ900 CRJ1000 CRJ700 CAPACITY (SINGLE CLASS) 737-7 MAXA319neo A320neo 737-8MAX CS100 CS300 E175-E2 E190-E2 E195-E2 22 NEW COMPETITIVE SCENARIO
  • 23.
    This information isproperty of Embraer and can not be used or reproduced without written permission. • EMBRAER INVESTMENT ON RESEARCH, DEVELOPMENT AND CAPEX FOR THE E-JETS E2 FAMILY WILL BE US$ 1.7 BILLION • INVESTMENT WILL BE SUPPORTED BY EMBRAER’S CASH GENERATION AND DEBT • INVESTMENTS SPAN FROM 2013 - 2020 WITH MORE CONCENTRATION IN 2014 - 2017 23 PROGRAM INVESTMENT
  • 24.
    This information isproperty of Embraer and can not be used or reproduced without written permission. Preliminary Information as of January, 2013 -- US$ 3.3/USGal, 10 years NPV @ 9% rate BETTER FUEL CONSUMPTION GAIN • E175 E2: US$ 4.8M • E190 E2: US$ 7.0M • E195 E2: US$ 6.5M MAINTENANCE COST REDUCTION GAIN • US$ 1.0~1.5ME175 AR (8E5): 42.9 E190 AR (10E5):47.4 E195 AR (10E5): 50.1 E-Jets E175-E2 46.8 E190-E2 53.6 E195-E2 60.4 delta: 3.9 M delta: 6.2 M delta: 10.3 M E-Jets E2 SEAT CAPACITY INCREASE GAIN • E175 E2: US$ 1.6M (4 SEATS) • E195 E2: US$ 4.8M (14 SEATS) 24 LIST PRICES (US$ MILLION)
  • 25.
    This information isproperty of Embraer and can not be used or reproduced without written permission.25 PROGRAM UPDATE E190-E2 • FIRST METAL CUT IN OCTOBER 2014 E195-E2 • JOINT DEFINITION PHASE ON GOING • MORE THAN 80% OF PRELIMINARY DESIGN REVIEWS PERFORMED E175-E2 • PRELIMINARY STUDIES PHASE CONCLUDED • INITIAL DEFINITION PHASE CONCLUDED • JOINT DEFINITION PHASE STARTED
  • 26.
    This information isproperty of Embraer and can not be used or reproduced without written permission. E195-E2 | EIS 2019 E190-E2 | EIS 1H2018 E175-E2 | EIS 2020 210 Firm Orders 380 Commitments 26 E2 ENTRY INTO SERVICE 590 E-JETS E2
  • 27.
    This information isproperty of Embraer and can not be used or reproduced without written permission.
  • 28.
    This information isproperty of Embraer and can not be used or reproduced without written permission. NEARLY 850 JETS IN SERVICE IN MORE THAN 50 COUNTRIES 28 EMBRAER EXECUTIVE JETS
  • 29.
    This information isproperty of Embraer and can not be used or reproduced without written permission.29 PRODUCT PORTFOLIO LARGE AIRCRAFT MODEL SEATS /RANGE up to 8 occupants/ 1,178 nm up to 11 occupants/ 1,971 nm 7 to 9 passengers/ 2,300 nm 8 to 12 passengers/ 3,000 nm 13 to 14 passengers/ 3,400 nm 13 to 19 passengers/ 4,500 nm ENTRY LIGHT MID-LIGHT MID-SIZE ULTRA-LARGE SUPER MID-SIZE Certified: 2008 Certified: 2009 UNDER DEVELOPMENT Certified: 2001 Certified: 2008 ULTRA-LONG RANGE COMPETITORS • Cessna - Mustang/M2 • HondaJet • Cessna - CJ2+/CJ3/CJ4 • Bombardier - Learjet 40XR/70 • Bombardier - Learjet 45XR/75 • Cessna - XLS+/Latitude • Bombardier - Learjet 85 • Cessna - Sovereign • Gulfstream - G150 • Bombardier - CL605/GL5000 • Dassault - Falcon 2000LXS/ 900LX • Gulfstream - G350/G450 • Airbus - ACJ 318/319/320 • Boeing - BBJ/BBJ2/BBJ3 13 to 14 passengers/ 3,900 nm Certified: 2010 • Bombardier - GL6000/GL7000/ GL8000 • Gulfstream - G500/G550/G650/ 650ER • Dassault - Falcon 7X/8X • Bombardier - CL300/CL850 • Cessna - X/Longitude • Dassault - Falcon 2000S • Gulfstream - G280 Certified: 2014
  • 30.
    This information isproperty of Embraer and can not be used or reproduced without written permission. DELIVERIES SHARE (UNITS)REVENUES SHARE (US$ BI | B&CA LIST PRICES) MARKET DELIVERIES 2014: 705 UNITS EMBRAER DELIVERIES: 116 UNITS BOMBARDIER MARKET REVENUES 2014: US$ 21.9 BILLION EMBRAER REVENUES: US$ 1.6 BILLION 30 MARKET SHARE HAWKER-BEECH DASSAULT CESSNAGULFSTREAMOTHERS
  • 31.
    This information isproperty of Embraer and can not be used or reproduced without written permission.31 MARKET DRIVERS
  • 32.
    This information isproperty of Embraer and can not be used or reproduced without written permission. 0% 4% 8% 12% 16% 20% 24% 28% 0 500 1,000 1,500 2,000 2,500 3,000 3,500 Q1Q2Q3Q4Q1Q2Q3Q4Q1Q2Q3Q4Q1Q2Q3Q4Q1Q2Q3Q4Q1Q2Q3Q4Q1Q2Q3Q4Q1Q2Q3Q4Q1Q2Q3Q4Q1Q2Q3Q4Q1Q2Q3Q4Q1Q2Q3Q4Q1Q2Q3Q4Q1Q2Q3Q4Q1Q2Q3Q4Q1Q2 2000 2001 2002 2003 2004 2005 2006 2007 2008 2009 2010 2011 2012 2013 2014 2015 %ofactivefleet Units Fleet older than 10 yrs Fleet from 6 to 10 yrs Fleet up to 5 yrs Positions Fleet up to 5 yrs and positions Total fleet % for sale Up to 10 yrs % for sale 32 BUSINESS JETS PRE-OWNED MARKET INVENTORY Source: Jetnet and Embraer analysis, April 2015 10.8% 2,179 jets 7.5% 616 jets
  • 33.
    This information isproperty of Embraer and can not be used or reproduced without written permission. IMPROVED ECONOMIC ENVIRONMENT IN US MAY DRIVE MARKET TURNAROUND 33 MARKET RECOVERY IN SLOW MOTION US 2015 GDP EXPECTED ABOVE 3.0% LOW OIL PRICE GENERATING OPPORTUNITIES US CORPORATE PROFITS AND HNWI AT RECORD LEVELS NEW PRODUCTS ENTERING INTO SERVICE TRAFFIC RECOVERY ON TRACK IN US BUT SLOWER THAN EXPECTED IN EU PRE-OWNED AIRCRAFT PRICES STABILIZED EUROPEAN MARKETS CONTINUE AT RISK; SOFTENING EMERGING MARKETS DEMAND
  • 34.
    This information isproperty of Embraer and can not be used or reproduced without written permission. 0 200 400 600 800 1000 1200 2008 2009 2010 2011 2012 2013 2014 2015 2016 2017 2018 2019 2020 2021 2022 2023 2024 Deliveries Forecast (units) 9,250 JETS AND US$ 265 BI IN THE NEXT 10 YEARS 34 2015-2024 MARKET FORECAST Units US$ 1,057 5 1,688 15 1,000 15 854 18 1,231 32 1,626 66 1,616 101 170 12 Deliveries Revenue N15YF Ultra Long Range Large Supermid Midsize Midlight Light Entry Ultra Large
  • 35.
    This information isproperty of Embraer and can not be used or reproduced without written permission. NORTH AMERICA 4,620 a/c (50%) US$ 120 Bi (45%) EUROPE, MIDDLE EAST & AFRICA 2,360 a/c (26%) US$ 77 Bi (29%) ASIA PACIFIC 570 a/c (6%) US$ 19 Bi (7%) LATIN AMERICA 850 a/c (9%) US$ 16 Bi (6%) CHINA 835 a/c (9%) US$ 33 Bi (12%) WORLDWIDE 9,250 units US$ 265 Bi 35 2015-2024 MARKET FORECAST BY REGION Note: sum of regional numbers might differ from total numbers due to rounding Source: Embraer Analysis
  • 36.
    This information isproperty of Embraer and can not be used or reproduced without written permission. NEARLY 70 SERVICE CENTERS WORLDWIDE. EMBRAER SERVICE CENTER AUTHORIZED SERVICE CENTER 36 SERVICE CENTER NETWORK
  • 37.
    This information isproperty of Embraer and can not be used or reproduced without written permission.
  • 38.
    This information isproperty of Embraer and can not be used or reproduced without written permission. OVER 50 ARMED FORCES 38 EMBRAER DEFENSE & SECURITY
  • 39.
    This information isproperty of Embraer and can not be used or reproduced without written permission. INTEGRATED PORTFOLIO LIGHT ATTACK AND ADVANCED TRAINING TACTICAL MILITARY TRANSPORT ISR (INTELLIGENCE, SURVEILLANCE AND RECONNAISSANCE) UAVs RADARC4I LAND SYSTEMS SERVICES 39 SATELLITE TRANSPORT AIRCRAFTMODERNIZATION PROGRAMS
  • 40.
    This information isproperty of Embraer and can not be used or reproduced without written permission. COMMAND AND CONTROL SYSTEMS AIR TRAFFIC MANAGEMENT CONTROL SYSTEMS OF SYSTEMS C4I UAVS SIMULATORS MODERNIZATION OF AVIONICS SYSTEMS LAND DEFENSE SYSTEMS INTEGRATION SISFRON IMPLEMENTATION MRO AERO STRUCTURES REMOTE SENSING AERIAL SURVEILLANCE RADAR SATELLITE GEOSTATIONARY OF DEFENSE AND COMMUNICATIONS (SGDC) 100% 51% 65%90% 100%51% 40 PARTNERSHIPS UAVs RADARC4I LAND SYSTEMS SERVICESSATELLITE
  • 41.
    This information isproperty of Embraer and can not be used or reproduced without written permission. REVENUES EVOLUTION (US$ MILLION) BACKLOG EVOLUTION (US$ BILLION) 41 EMBRAER DEFENSE & SECURITY RESULTS REVENUES PARTICIPATION (%)
  • 42.
    This information isproperty of Embraer and can not be used or reproduced without written permission. BRAZIL: 99 COLOMBIA: 25 DOMINICAN REPUBLIC: 8 CHILE: 12 ECUADOR: 18 INDONESIA: 16 GREYSTONE (TACAIR): 1 MAURITANIA: 2 BURKINA FASO: 3 ANGOLA: 6 USA: 20 TOTAL MARKET FORECAST: 300 AIRCRAFT / US$ 3.5 BILLION 800 2,000 700 MEDIUM-TERM LONG-TERM SHORT-TERM ADDRESSABLE MARKET FORECAST 2020 (US$ MILLION) PARTNERSHIP WITH BOEING TO PROVIDE WEAPONS INTEGRATION, INCREASING CAPABILITIES OF THE AIRCRAFT. • FIRM ORDERS: MORE THAN 210 AIRCRAFT • OVER 190 AIRCRAFT DELIVERED 42 SUPER TUCANO
  • 43.
    This information isproperty of Embraer and can not be used or reproduced without written permission. • A new tactical military transport and tanker aircraft • Partnership with Boeing to share technical knowledge and to market and sell the KC-390 in certain markets • Six countries letters of intent, totalizing 60 aircraft • FAB and Embraer signed the series production contract for 28 KC-390 • First flight in February 2015 TOTAL MARKET FORECAST 2025: 700 AIRCRAFT / US$ 50+ BI 43 EMBRAER KC-390 BRAZIL (28) COLOMBIA (12) ARGENTINA (6) CHILE (6) PORTUGAL (6) CZECH REP. (2)
  • 44.
    This information isproperty of Embraer and can not be used or reproduced without written permission. BRAZILIAN NAVY A-4 12 aircraft BRAZILIAN AIR FORCE A-1M 43 aircraft 3 delivered BRAZILIAN AIR FORCE F-5M 46 aircraft + 7 aircraft (2nd batch) 46 delivered BRAZILIAN AIR FORCE E-99 5 aircraft EMB 145 AEW&C A-4 ADDRESSABLE MARKET FORECAST 2025 (US$ MILLION) TOTAL MARKET FORECAST: 228 AIRCRAFT / US$ 1.5 BILLION 437 567 505MEDIUM-TERM LONG-TERM SHORT-TERM 44 MODERNIZATION PROGRAMS
  • 45.
    This information isproperty of Embraer and can not be used or reproduced without written permission. SISFRON Integrated Borders Monitoring System First phase: US$ 420 Million Total estimate: US$ 4 Billion Comprising radars, communication networks, C4I, unmanned air vehicles (UAV) and armored vehicles SATELLITE Estimate: US$ 400 Million Participation in the first Brazilian Geostationary Satellite Ref. dez/12 SENS 59% COMM 9% UAV 12% SW 20% 45 BRAZILIAN ARMY PRIORITIES
  • 46.
    This information isproperty of Embraer and can not be used or reproduced without written permission. 2015 OUTLOOK
  • 47.
    This information isproperty of Embraer and can not be used or reproduced without written permission. EBITDA MARGIN 12.0% – 13.0% NET REVENUES EBITDA US$ 6.1 – 6.6 BILLION US$ 730 – 860 MILLION EBIT MARGIN 8.0% – 8.5% EBIT US$ 490 – 560 MILLION FCF > (US$ 100) MILLION* 47 2015 CONSOLIDATED OUTLOOK * FCF USE OF LESS THAN US$ 100 MILLION.
  • 48.
    This information isproperty of Embraer and can not be used or reproduced without written permission. 2015 BUSINESS UNITS OUTLOOK 48 18% OF NET REVENUES 2% OF NET REVENUES 28% OF NET REVENUES 52% OF NET REVENUES DELIVERIES: 95 TO 100 E-JETS US$ 100 MILLION US$ 1.70 – 1.85 BILLION US$ 1.10 – 1.25 BILLION OTHER REVENUES US$ 3.20 – 3.40 BILLION DELIVERIES: 80 TO 90 LIGHT JETS 35 TO 40 LARGE JETS
  • 49.
    This information isproperty of Embraer and can not be used or reproduced without written permission. TOTAL INVESTMENTS: US$ 650 MILLION RESEARCH US$ 50 MILLION DEVELOPMENT US$ 300 MILLION CAPEX US$ 300 MILLION 49 2015 INVESTMENT OUTLOOK
  • 50.
    This information isproperty of Embraer and can not be used or reproduced without written permission. FINANCIAL RESULTS
  • 51.
    This information isproperty of Embraer and can not be used or reproduced without written permission. NET REVENUES - US$ MILLION SG&A EXPENSES - US$ MILLION 51 NET REVENUES | SG&A EXPENSES SELLING EXPENSESG&A EXPENSES 2015 OUTLOOK: US$ 6.1 – 6.6 BILLION 92 115 99 113 86 48 53 52 55 43 1Q14 2Q14 3Q14 4Q14 1Q15 151 168168 140 129 1,242 1,761 1,240 2,046 1,056 1Q14 2Q14 3Q14 4Q14 1Q15
  • 52.
    This information isproperty of Embraer and can not be used or reproduced without written permission.52 INCOME FROM OPERATIONS (EBIT) | EBITDA EBIT - US$ MILLION EBITDA - US$ MILLION EBIT EBIT MARGIN EBITDA EBITDA MARGIN 2015 OUTLOOK: US$ 490 – 560 MILLION | 8.0% – 8.5% 2015 OUTLOOK: US$ 730 – 860 MILLION | 12.0% – 13.0% 92 187 68 196 80 7.4% 10.6% 5.5% 9.6% 7.5% 1Q14 2Q14 3Q14 4Q14 1Q15 151 261 136 281 149 12.2% 14.8% 11.0% 13.8% 14.1% 1Q14 2Q14 3Q14 4Q14 1Q15
  • 53.
    This information isproperty of Embraer and can not be used or reproduced without written permission. NET INCOME - US$ MILLION FREE CASH FLOW - US$ MILLION FREE CASH FLOW NET ADDITIONS TO PP&E NET CASH GENERATED (USED) BY OPERATING ACTIVITIES* ADDITIONS TO INTANGIBLE * Net of Financial assets adjustment 53 NET INCOME | FREE CASH FLOW NET MARGINNET INCOME 111 143 (11) 91 (62) 8.9% 8.1% -0.9% 4.5% -5.9% 1Q14 2Q14 3Q14 4Q14 1Q15 (273) 13 49 507 (292) (48) (60) (89) (87) (57) (83) (103) (97) (132) (91) (404) (150) (138) 288 (440) 1Q14 2Q14 3Q14 4Q14 1Q15 2015 OUTLOOK: FCF > (US$ 100) MILLION
  • 54.
    This information isproperty of Embraer and can not be used or reproduced without written permission.54 INDEBTEDNESS PRINCIPAL MATURITIESCASHLOCALCASHABROAD PRINCIPAL MATURITIES = US$ 2.39 BILLION
  • 55.
    This information isproperty of Embraer and can not be used or reproduced without written permission.55 INDEBTEDNESS PROFILE | NET CASH INDEBTEDNESS MATURITY NET CASH (DEBT) - US$ MILLION LONG-TERM SHORT-TERM LOANS AVERAGE MATURITY (YEARS) 96% 96% 96% 96% 89% 4% 4% 4% 4% 11% 5.9 5.7 5.6 5.4 5.3 1Q14 2Q14 3Q14 4Q14 1Q15 TOTAL DEBT 1Q15: US$ 2.39 BILLION TOTAL CASH 1Q15: US$ 1.81 BILLION 53 (114) (327) (85) (581) 1Q14 2Q14 3Q14 4Q14 1Q15
  • 56.
    This information isproperty of Embraer and can not be used or reproduced without written permission.56 INVENTORIES US$ MILLION 2,542 2,439 2,767 2,405 2,696 1Q14 2Q14 3Q14 4Q14 1Q15
  • 57.
    This information isproperty of Embraer and can not be used or reproduced without written permission.57 INVESTMENTS US$ MILLION 2015 YTD: 106 7 27 72 50 300 300 RESEARCH DEVELOPMENT CAPEX 2015 OUTLOOK: US$ 650 MILLION 2015 OUTLOOK2015 YTD
  • 58.
    This information isproperty of Embraer and can not be used or reproduced without written permission.58 EPADS AND PAY OUT EPADS PAY OUT US$ 1.83 0.62 1.92 1.88 1.82 34% 116% 26% 26% 27% 2010 2011 2012 2013 2014
  • 59.
    This information isproperty of Embraer and can not be used or reproduced without written permission. 735,779,161 VOTING SHARES 59 OWNERSHIP STRUCTURE – 1Q15
  • 60.
    This information isproperty of Embraer and can not be used or reproduced without written permission. CORPORATE INFORMATION
  • 61.
    This information isproperty of Embraer and can not be used or reproduced without written permission. BRAZILIAN ALLIANCE FOR BIO-FUEL ISO 14001 AND OHSAS 18001 CERTIFICATIONS 1ST ETHANOL POWERED AIRCRAFT IN THE WORLD GREENER TECHNOLOGY SOCIAL ACTIVITIES 61 SUSTAINABILITY INITIATIVES REFORESTATION PROJECTS RECYCLING CORPORATE VALUES
  • 62.
    This information isproperty of Embraer and can not be used or reproduced without written permission. E-JETS FINAL ASSEMBLY LINE TRANSFORMATION E-JETS WING JUNCTION LINE TRANSFORMATION Performance Indicators 2008 (15 ac/month) 2009 (10 ac/month) 2012 (10 ac/month) Number of positions 12 5 4 Cycle time (days) 18 10 8 Work in Process (US$ Mi) 212 95 68 Number of non- conformity per a/c 32 1.7 0.76 Overtime (% of work hours) 10 1.5 0 62 P3E – LEAN RESULTS
  • 63.
    This information isproperty of Embraer and can not be used or reproduced without written permission. KAIZEN - E-JETS CYCLE REDUCTION COST OF NON QUALITY REDUCTION 57% 40% REDUCTION ON THE PRODUCTION CYCLE 40% 44% REDUCTION ON CNQ 63 P3E – LEAN RESULTS
  • 64.
    This information isproperty of Embraer and can not be used or reproduced without written permission. COST: US$ 29.0 MILLION BENEFIT: US$ 268.4 MILLION 64 “BOA IDEIA” PROGRAM EVOLUTION
  • 65.
    This information isproperty of Embraer and can not be used or reproduced without written permission. INVESTOR RELATIONS PHONE: +55 12 3927 4404 INVESTOR.RELATIONS@EMBRAER.COM.BR WWW.EMBRAER.COM
  • 66.
    This information isproperty of Embraer and can not be used or reproduced without written permission. This presentation may contain forward-looking statements, projections and estimates regarding circumstances or events yet to take place, including, but not limited to, those statements relating to guidance. These forward- looking statements are based largely on current expectations, forecasts of future events and industry and financial trends that affect Embraer’s businesses. These statements are subject to risks, uncertainties and assumptions that include, among others: general economic, political and trade conditions, both in Brazil and in those markets where Embraer does business; management’s expectations and estimates concerning the company’s future financial performance; plans and objectives of our management; financing plans and programs, and the effects of competition; industry trends and growth opportunities; inflation and fluctuations in exchange rates; the company’s investment plans; Embraer’s operating efficiencies and synergies and its capacity to develop and deliver products on the dates previously agreed upon; results of operation; business strategies; benefits of new technologies and existing and future governmental regulations. To obtain further information on factors that may lead to results different from those forecast by Embraer, please consult the reports Embraer files with the U.S. Securities and Exchange Commission (SEC) and the Brazilian Comissão de Valores Mobiliários (CVM) and in particular the factors discussed under “Forward-Looking Statements” and “Risk Factors” in Embraer’s annual report on Form 20−F. The words “believe”, “may”, “will”, “estimate”, “intend”, “continue”, “anticipate”, “expect” and other similar terms are intended to identify forward-looking statements. Embraer does not undertake any obligation to publish updates or to revise any forward-looking statements due to new information, future events or any other factors. In view of the inherent risks and uncertainties, such estimates, events and circumstances may not occur. The actual results and performance of Embraer could therefore differ substantially from those anticipated in Embraer's forward-looking statements. 66 FORWARD LOOKING STATEMENT