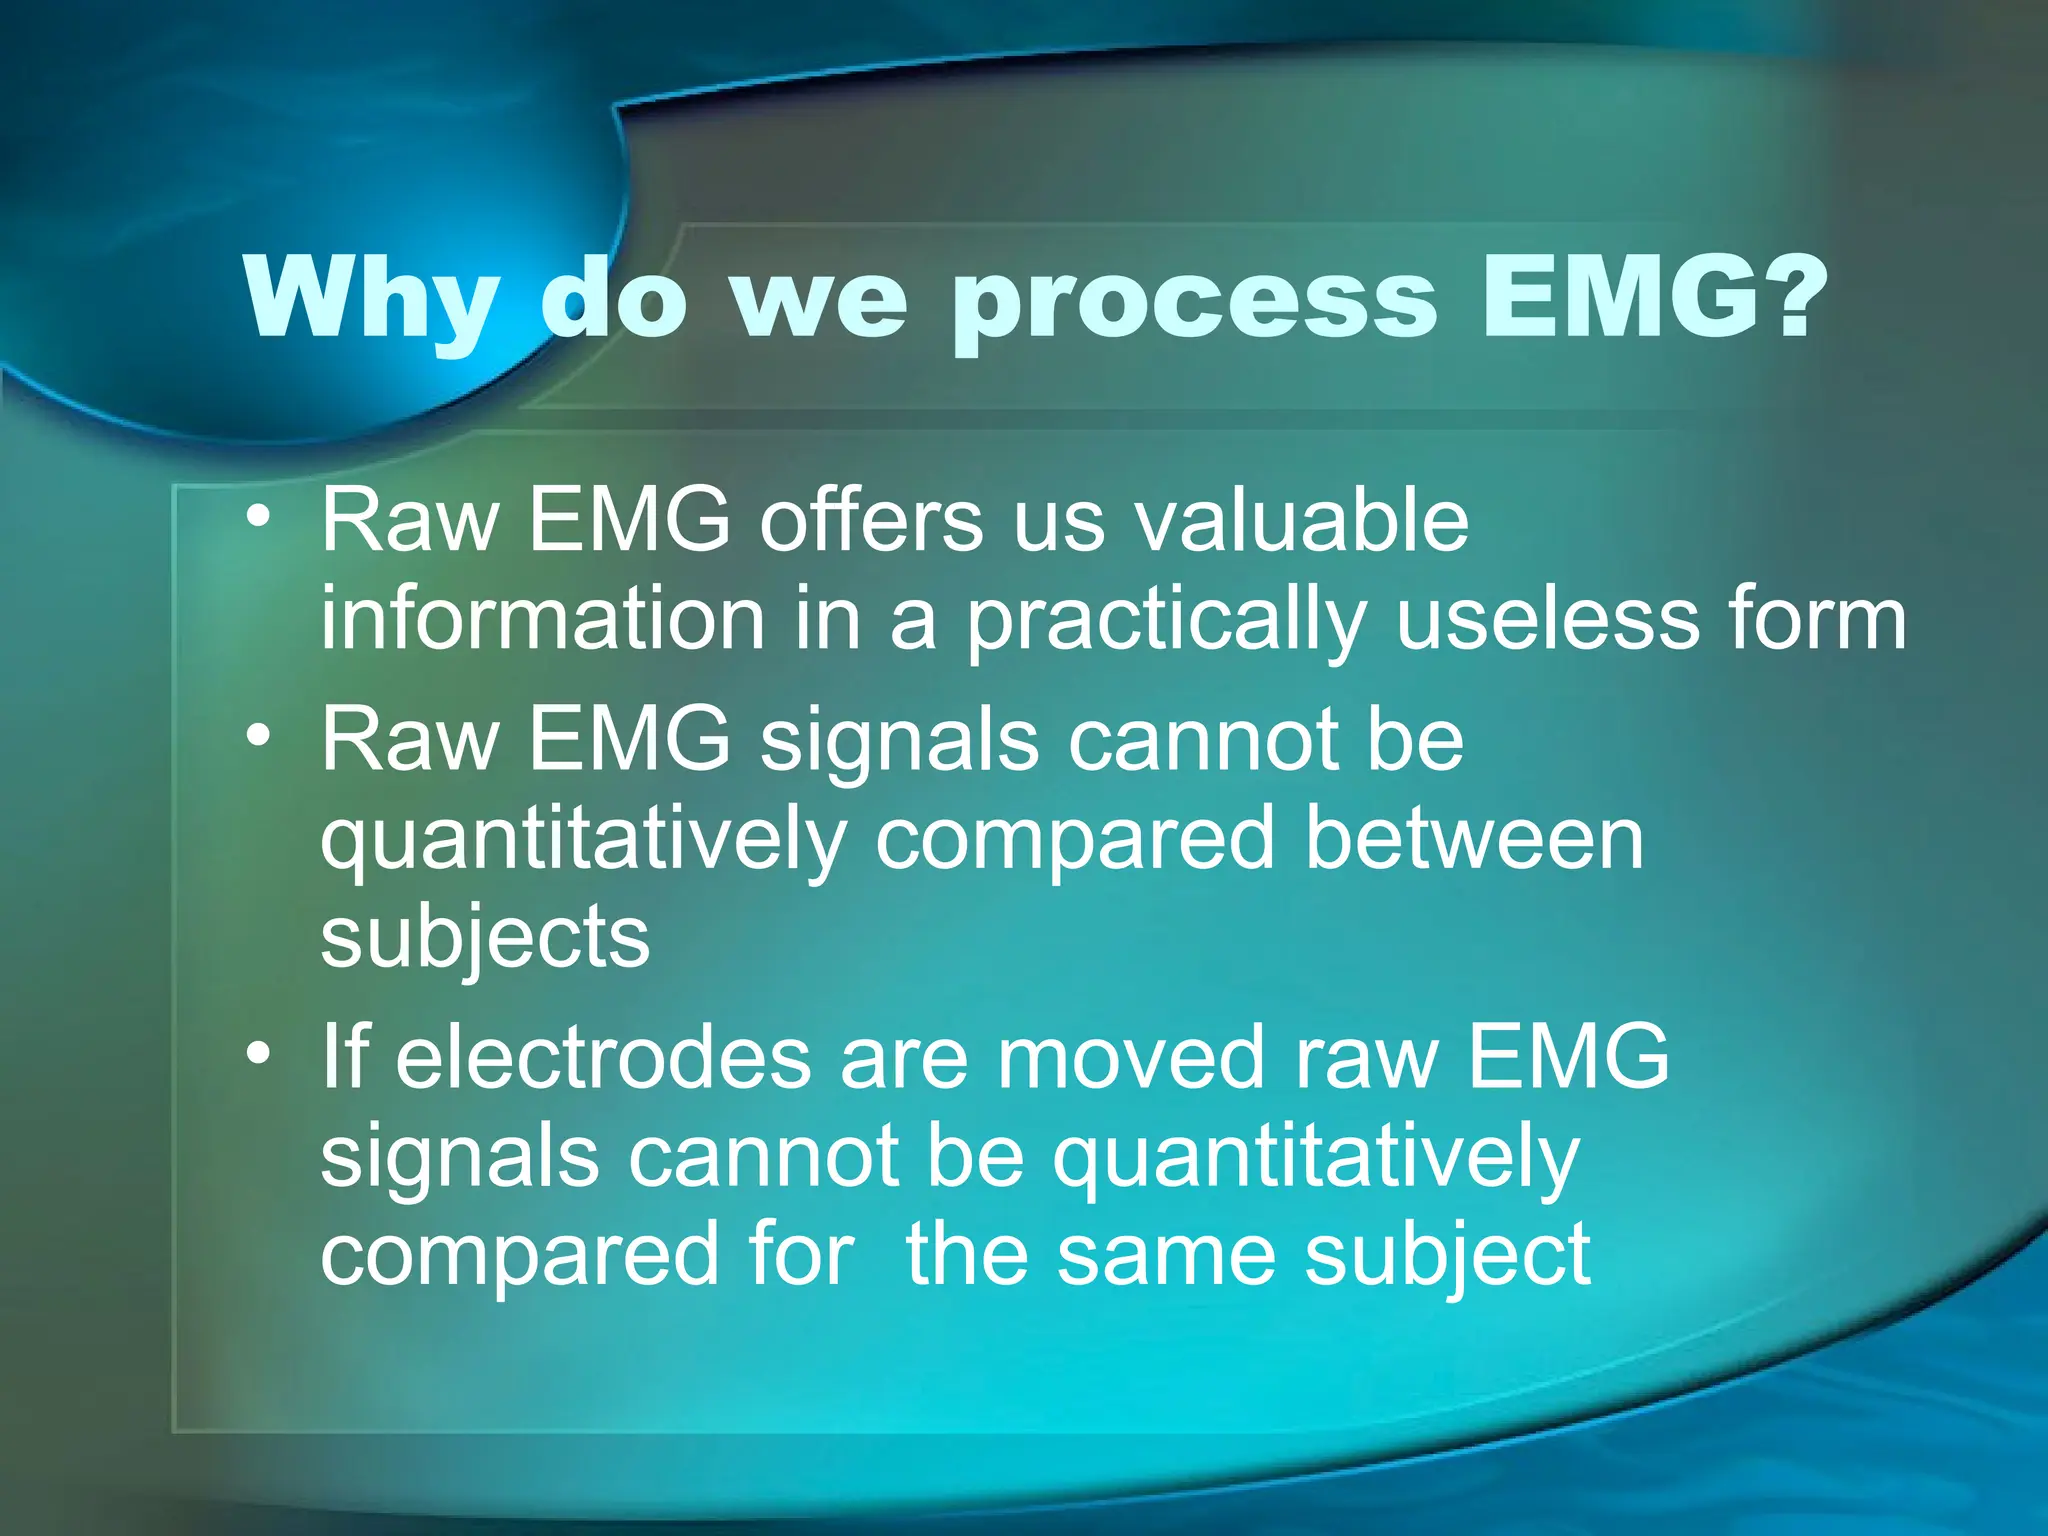
Why do weprocess EMG?
• Raw EMG offers us valuable
information in a practically useless form
• Raw EMG signals cannot be
quantitatively compared between
subjects
• If electrodes are moved raw EMG
signals cannot be quantitatively
compared for the same subject
3.
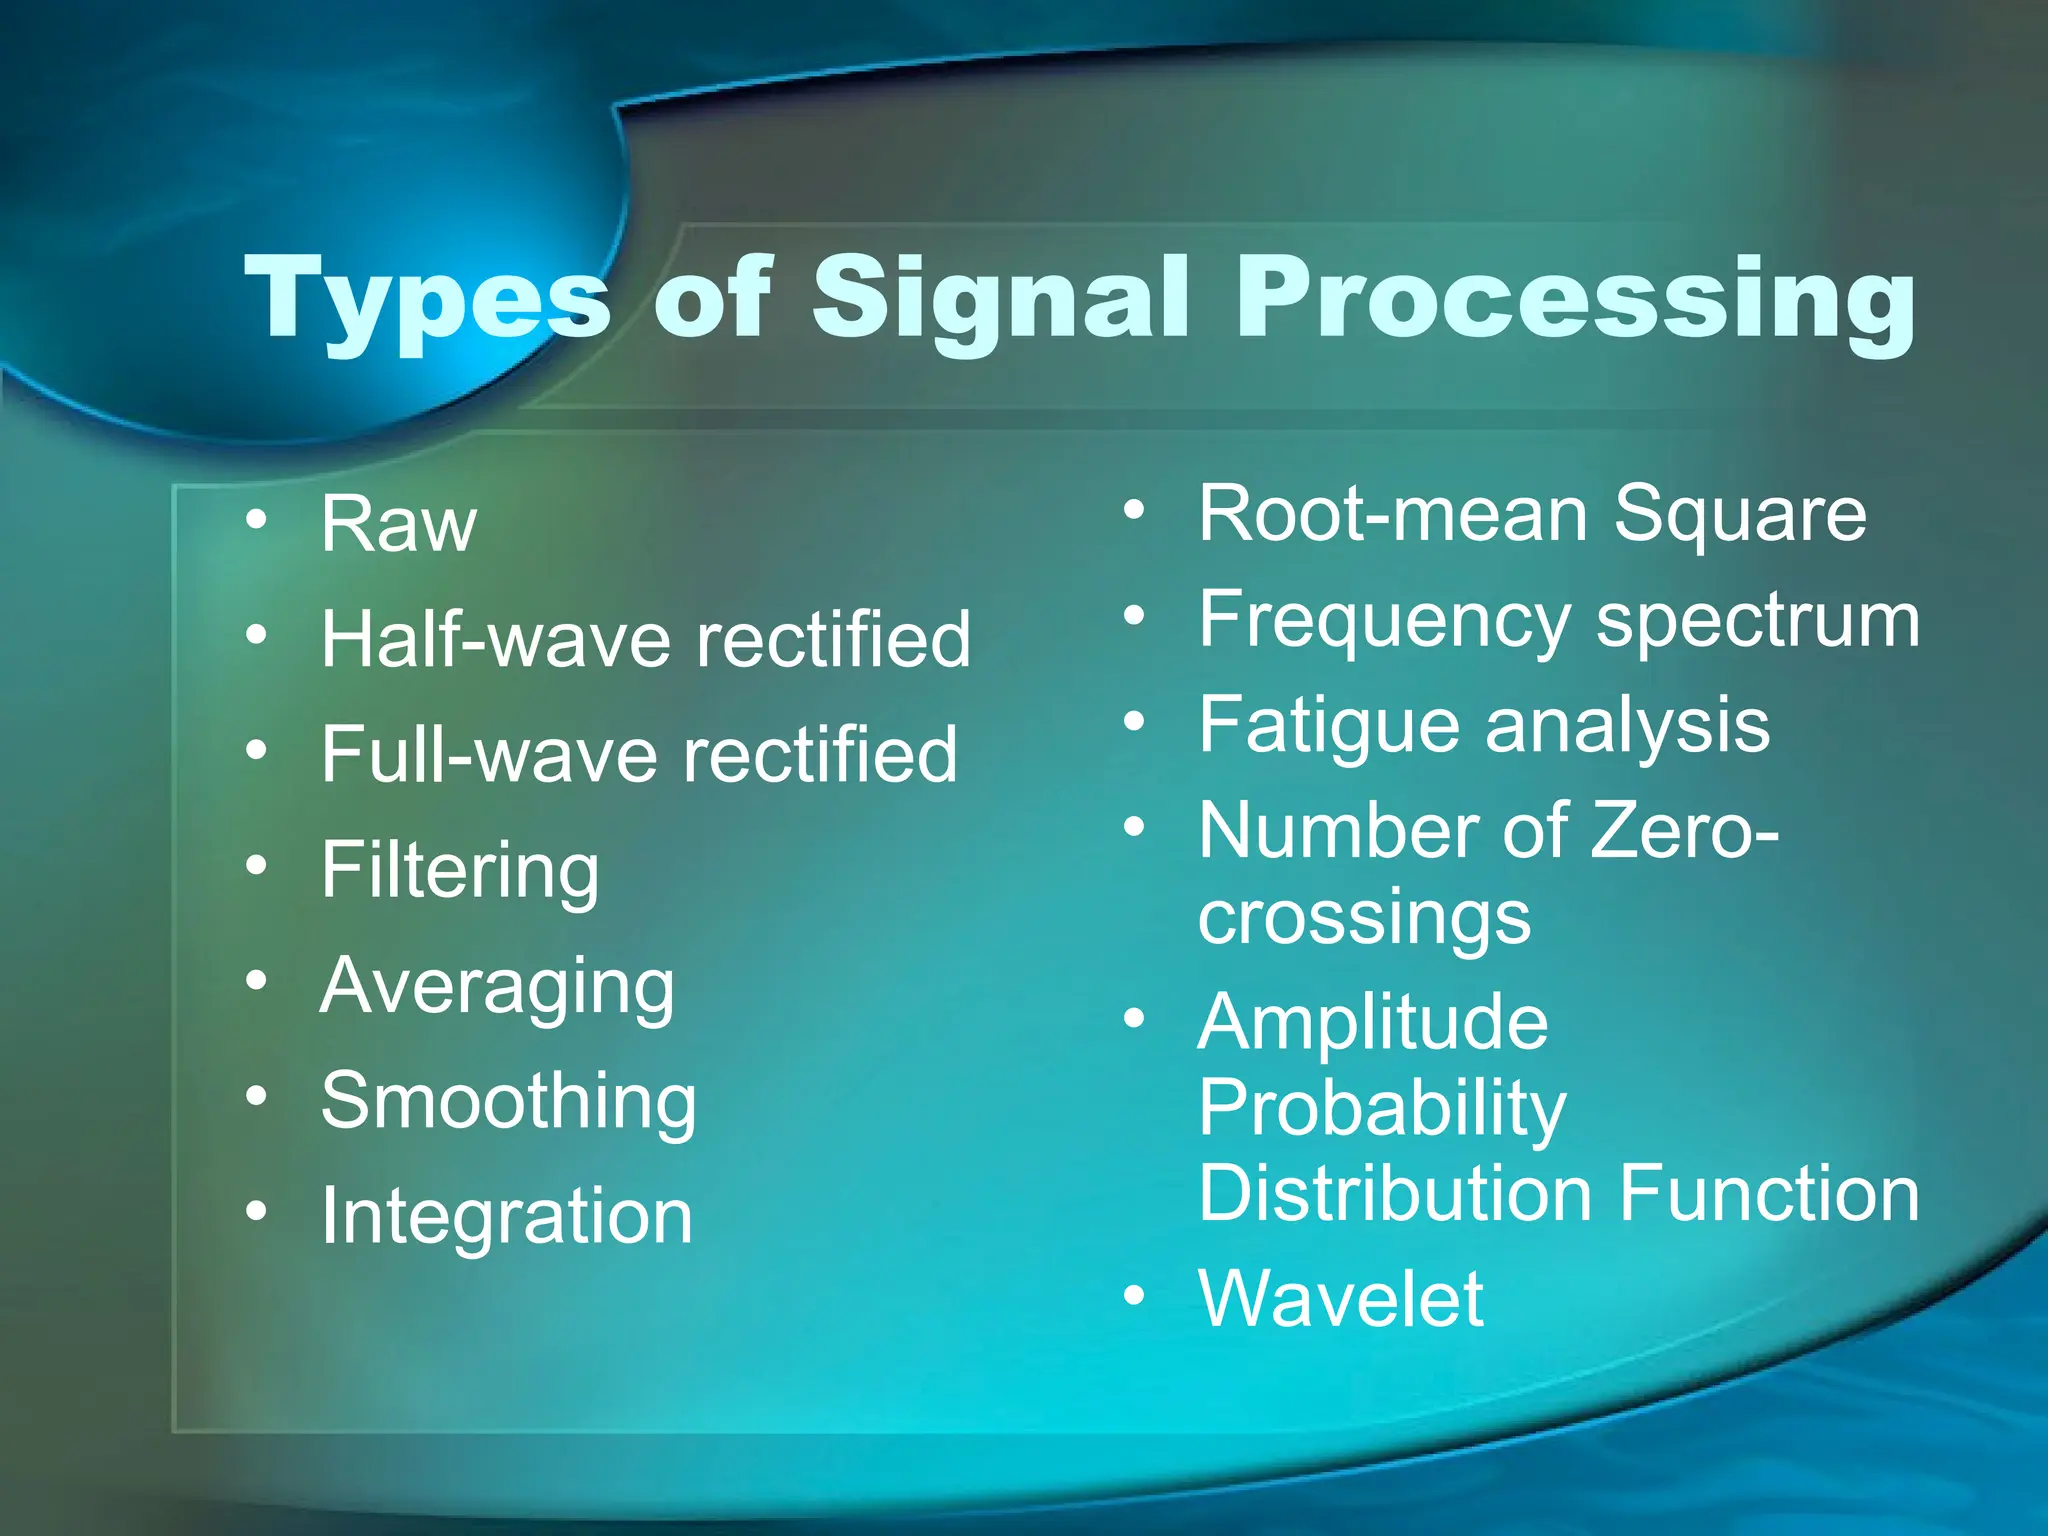
Types of SignalProcessing
• Raw
• Half-wave rectified
• Full-wave rectified
• Filtering
• Averaging
• Smoothing
• Integration
• Root-mean Square
• Frequency spectrum
• Fatigue analysis
• Number of Zero-
crossings
• Amplitude
Probability
Distribution Function
• Wavelet
4.
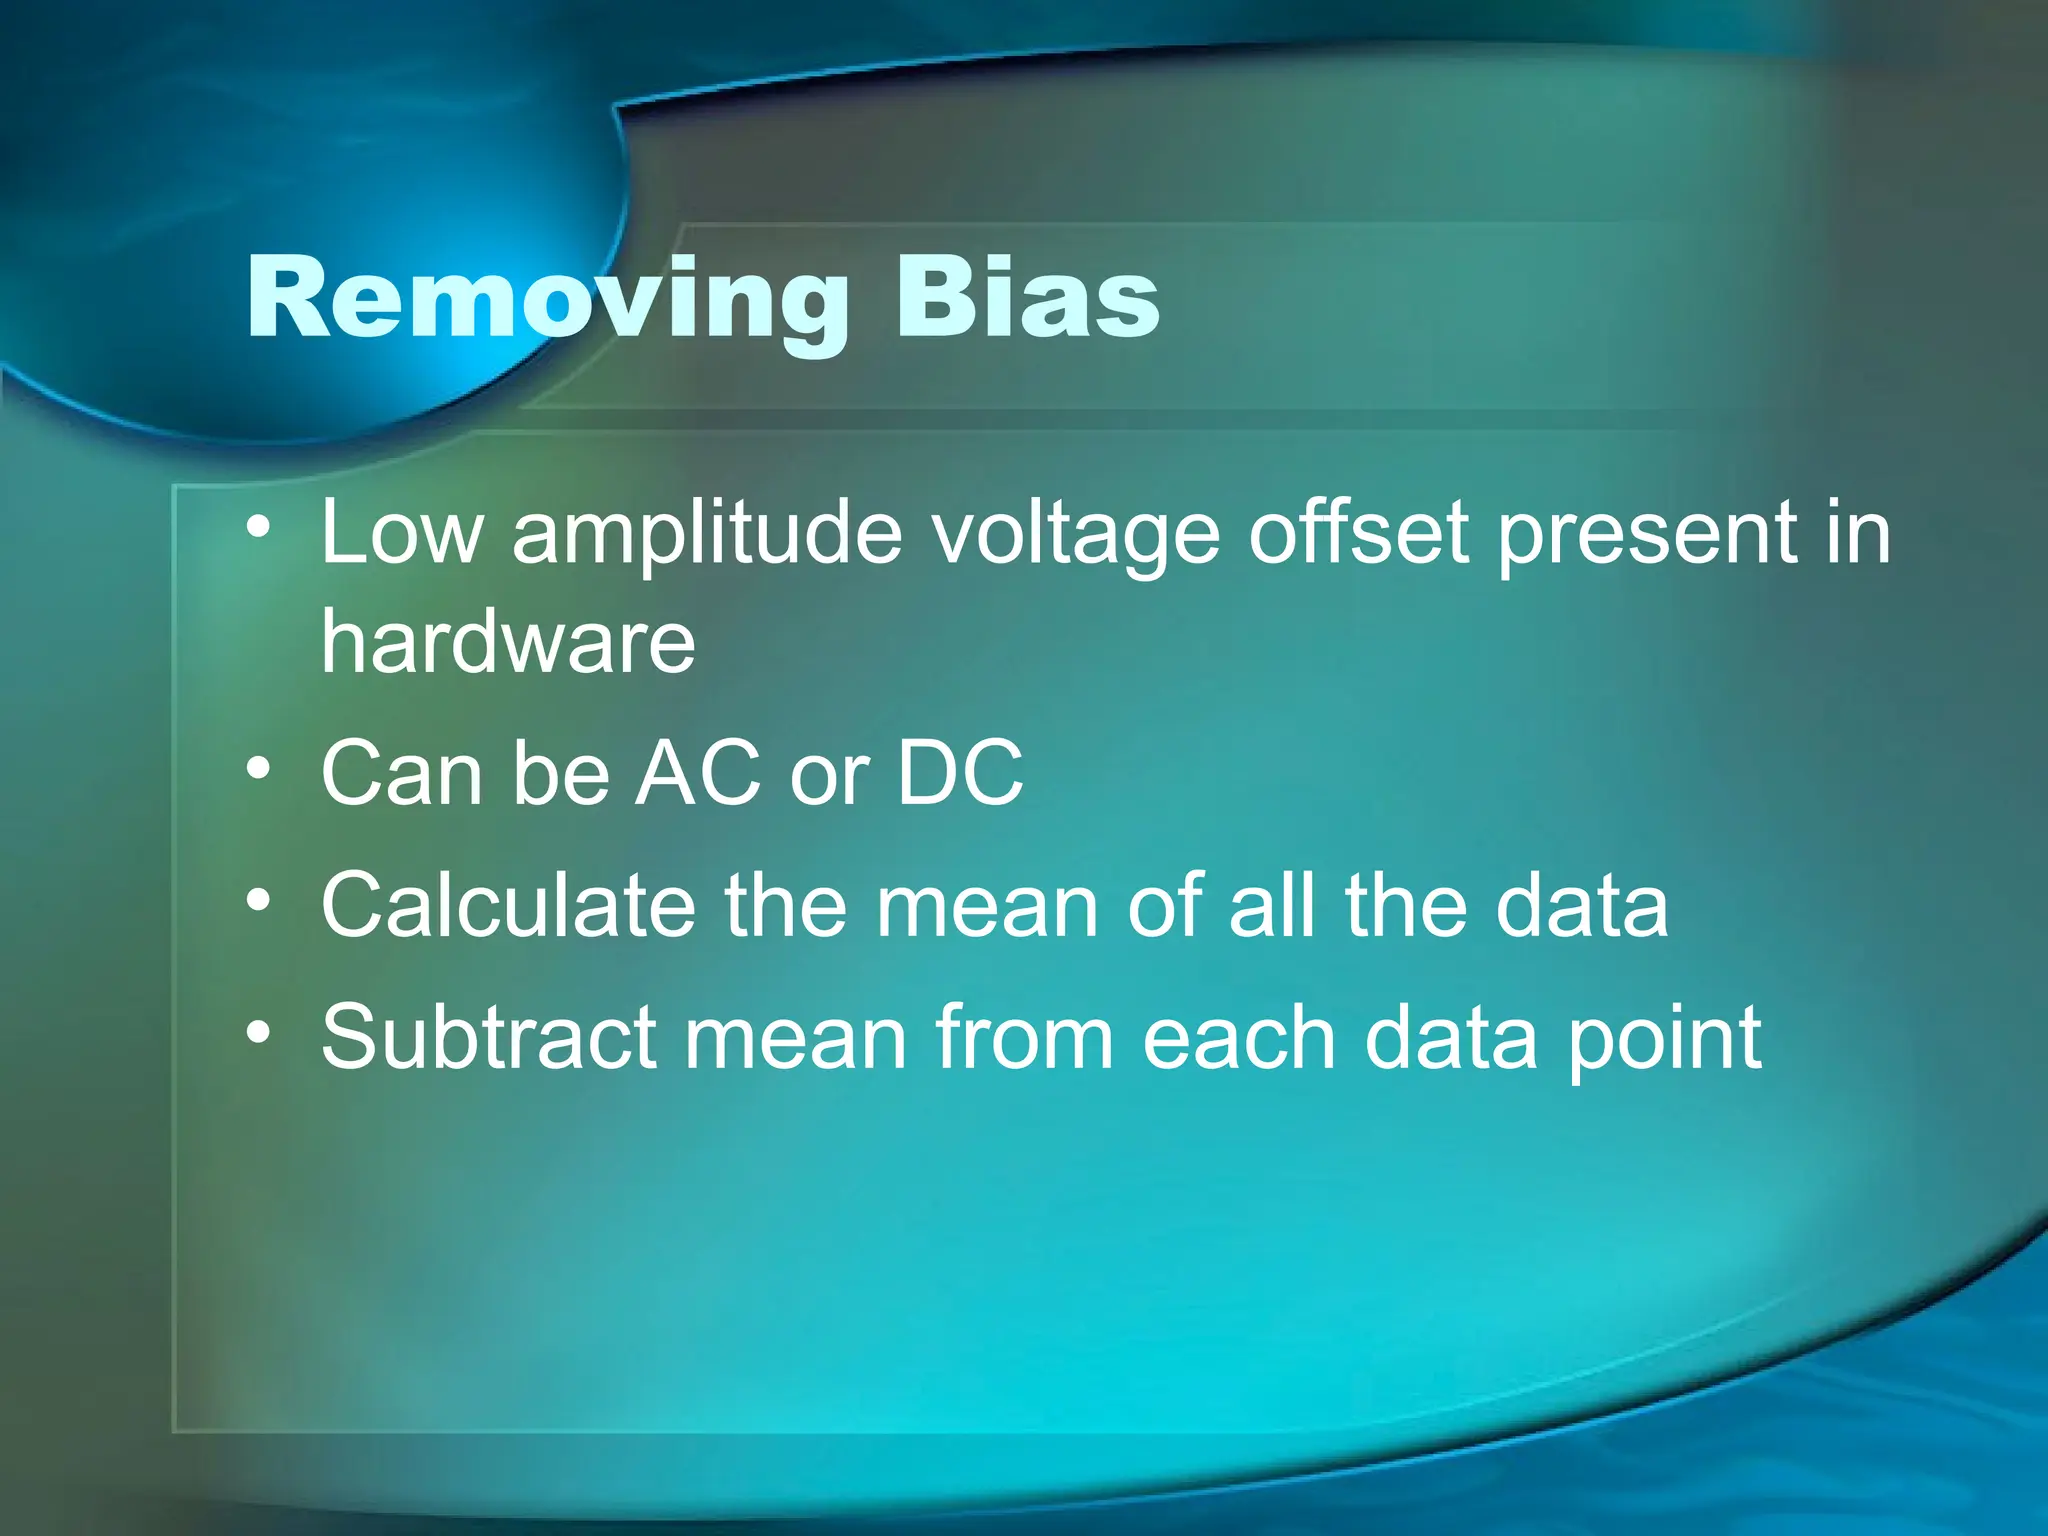
Removing Bias
• Lowamplitude voltage offset present in
hardware
• Can be AC or DC
• Calculate the mean of all the data
• Subtract mean from each data point
5.
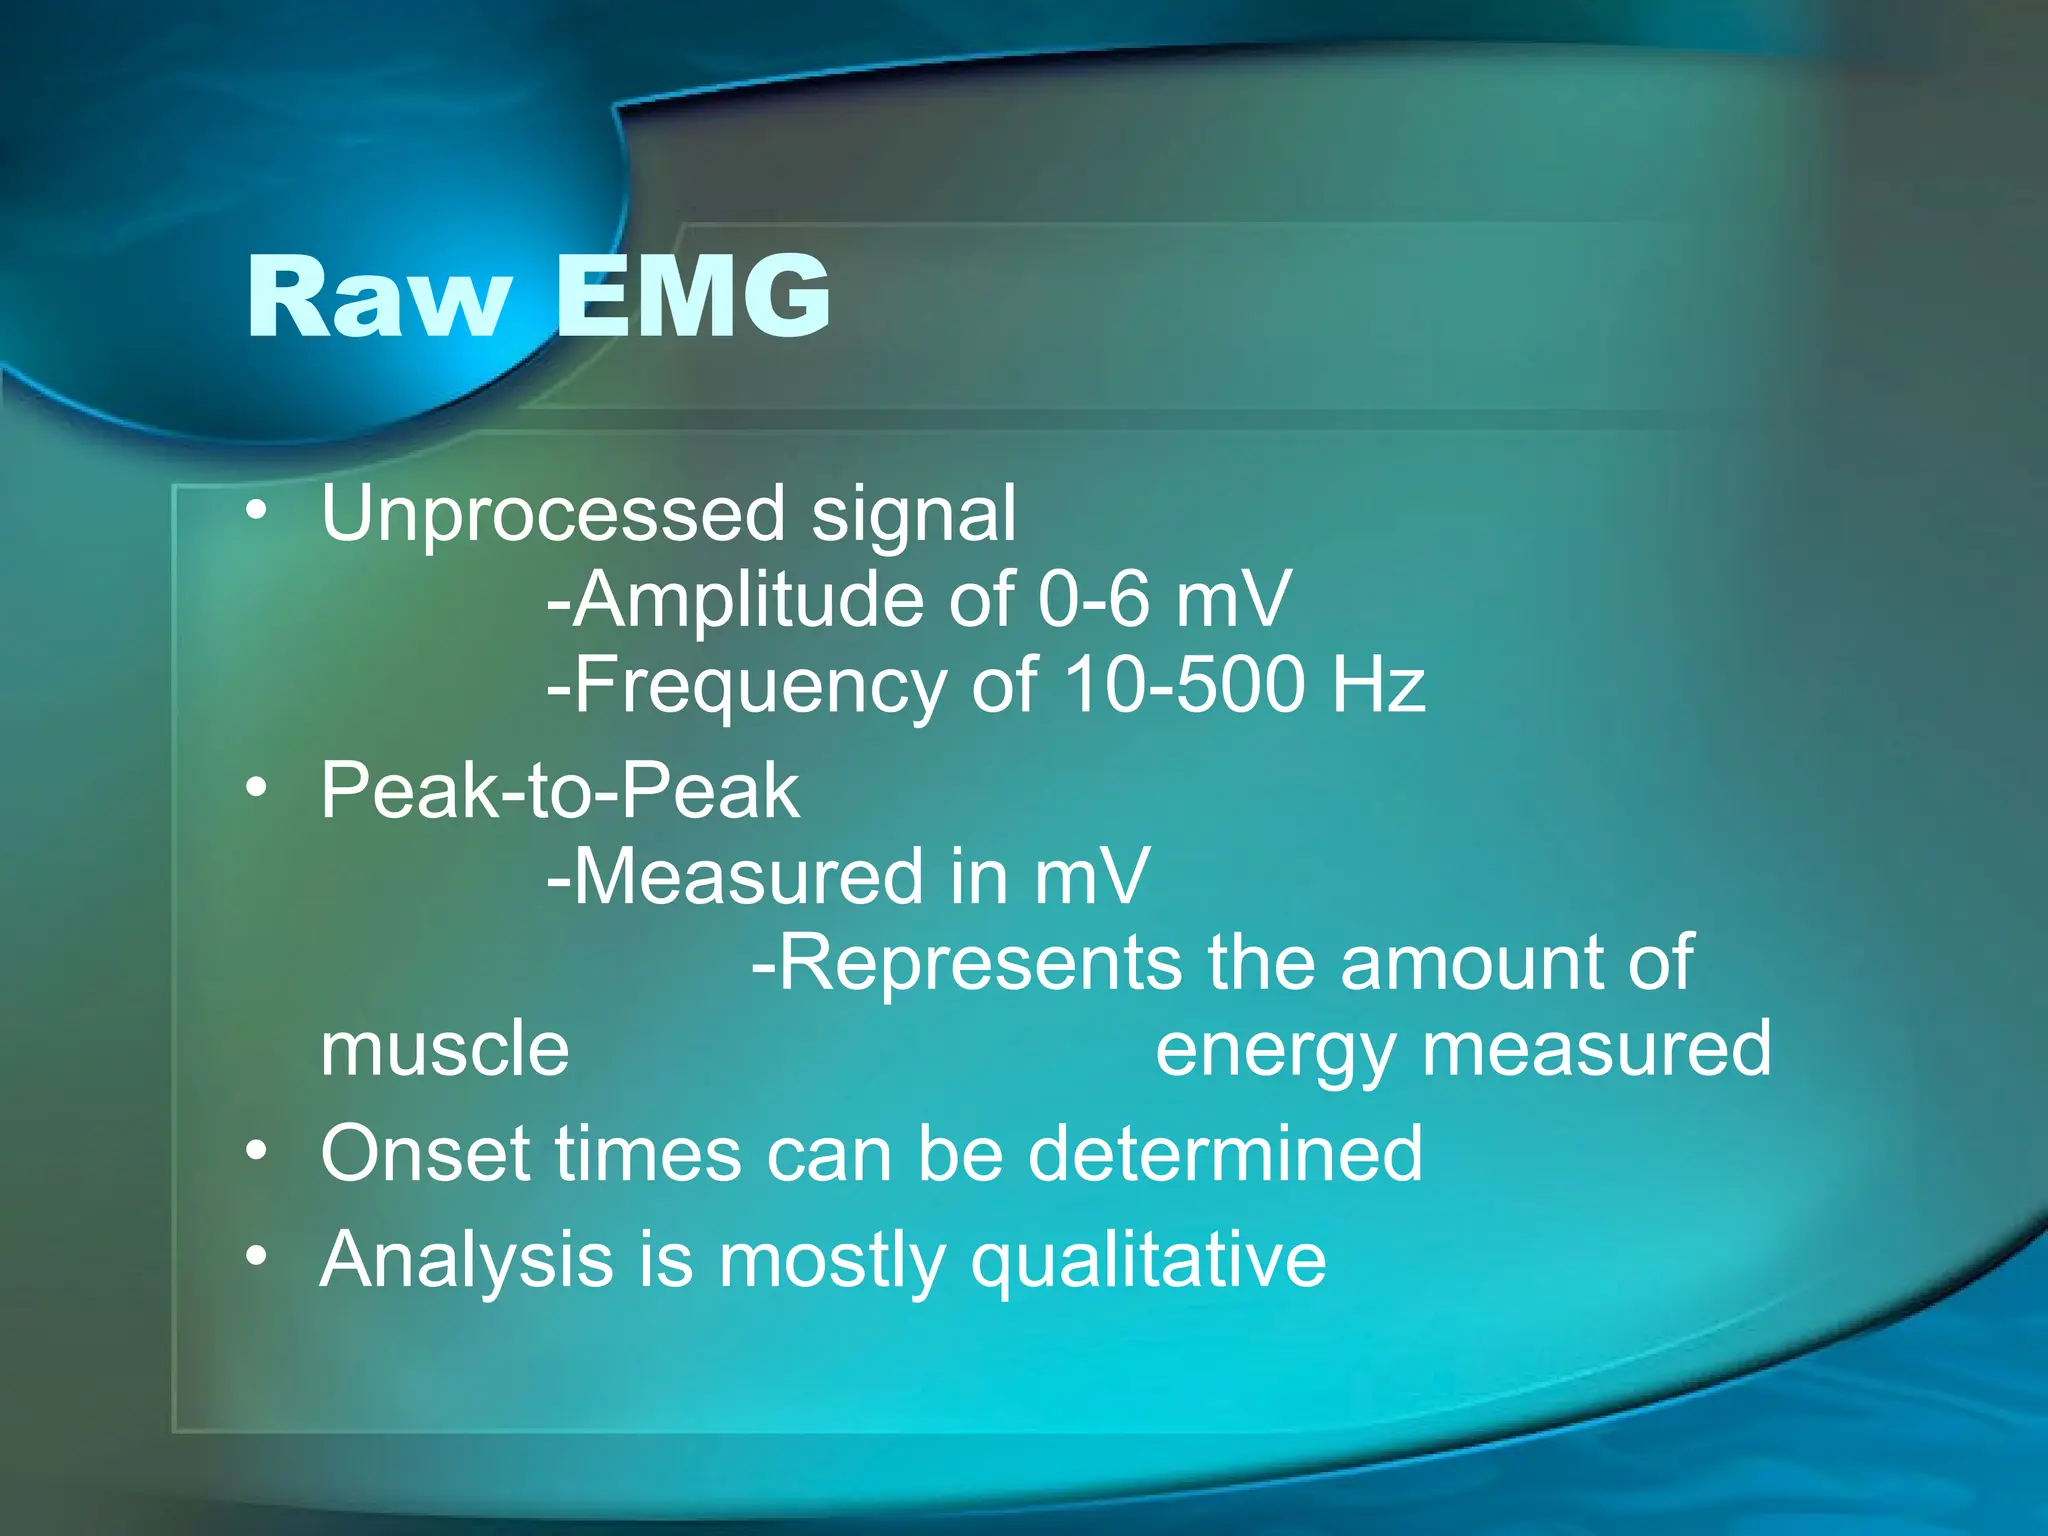
Raw EMG
• Unprocessedsignal
-Amplitude of 0-6 mV
-Frequency of 10-500 Hz
• Peak-to-Peak
-Measured in mV
-Represents the amount of
muscle energy measured
• Onset times can be determined
• Analysis is mostly qualitative
6.
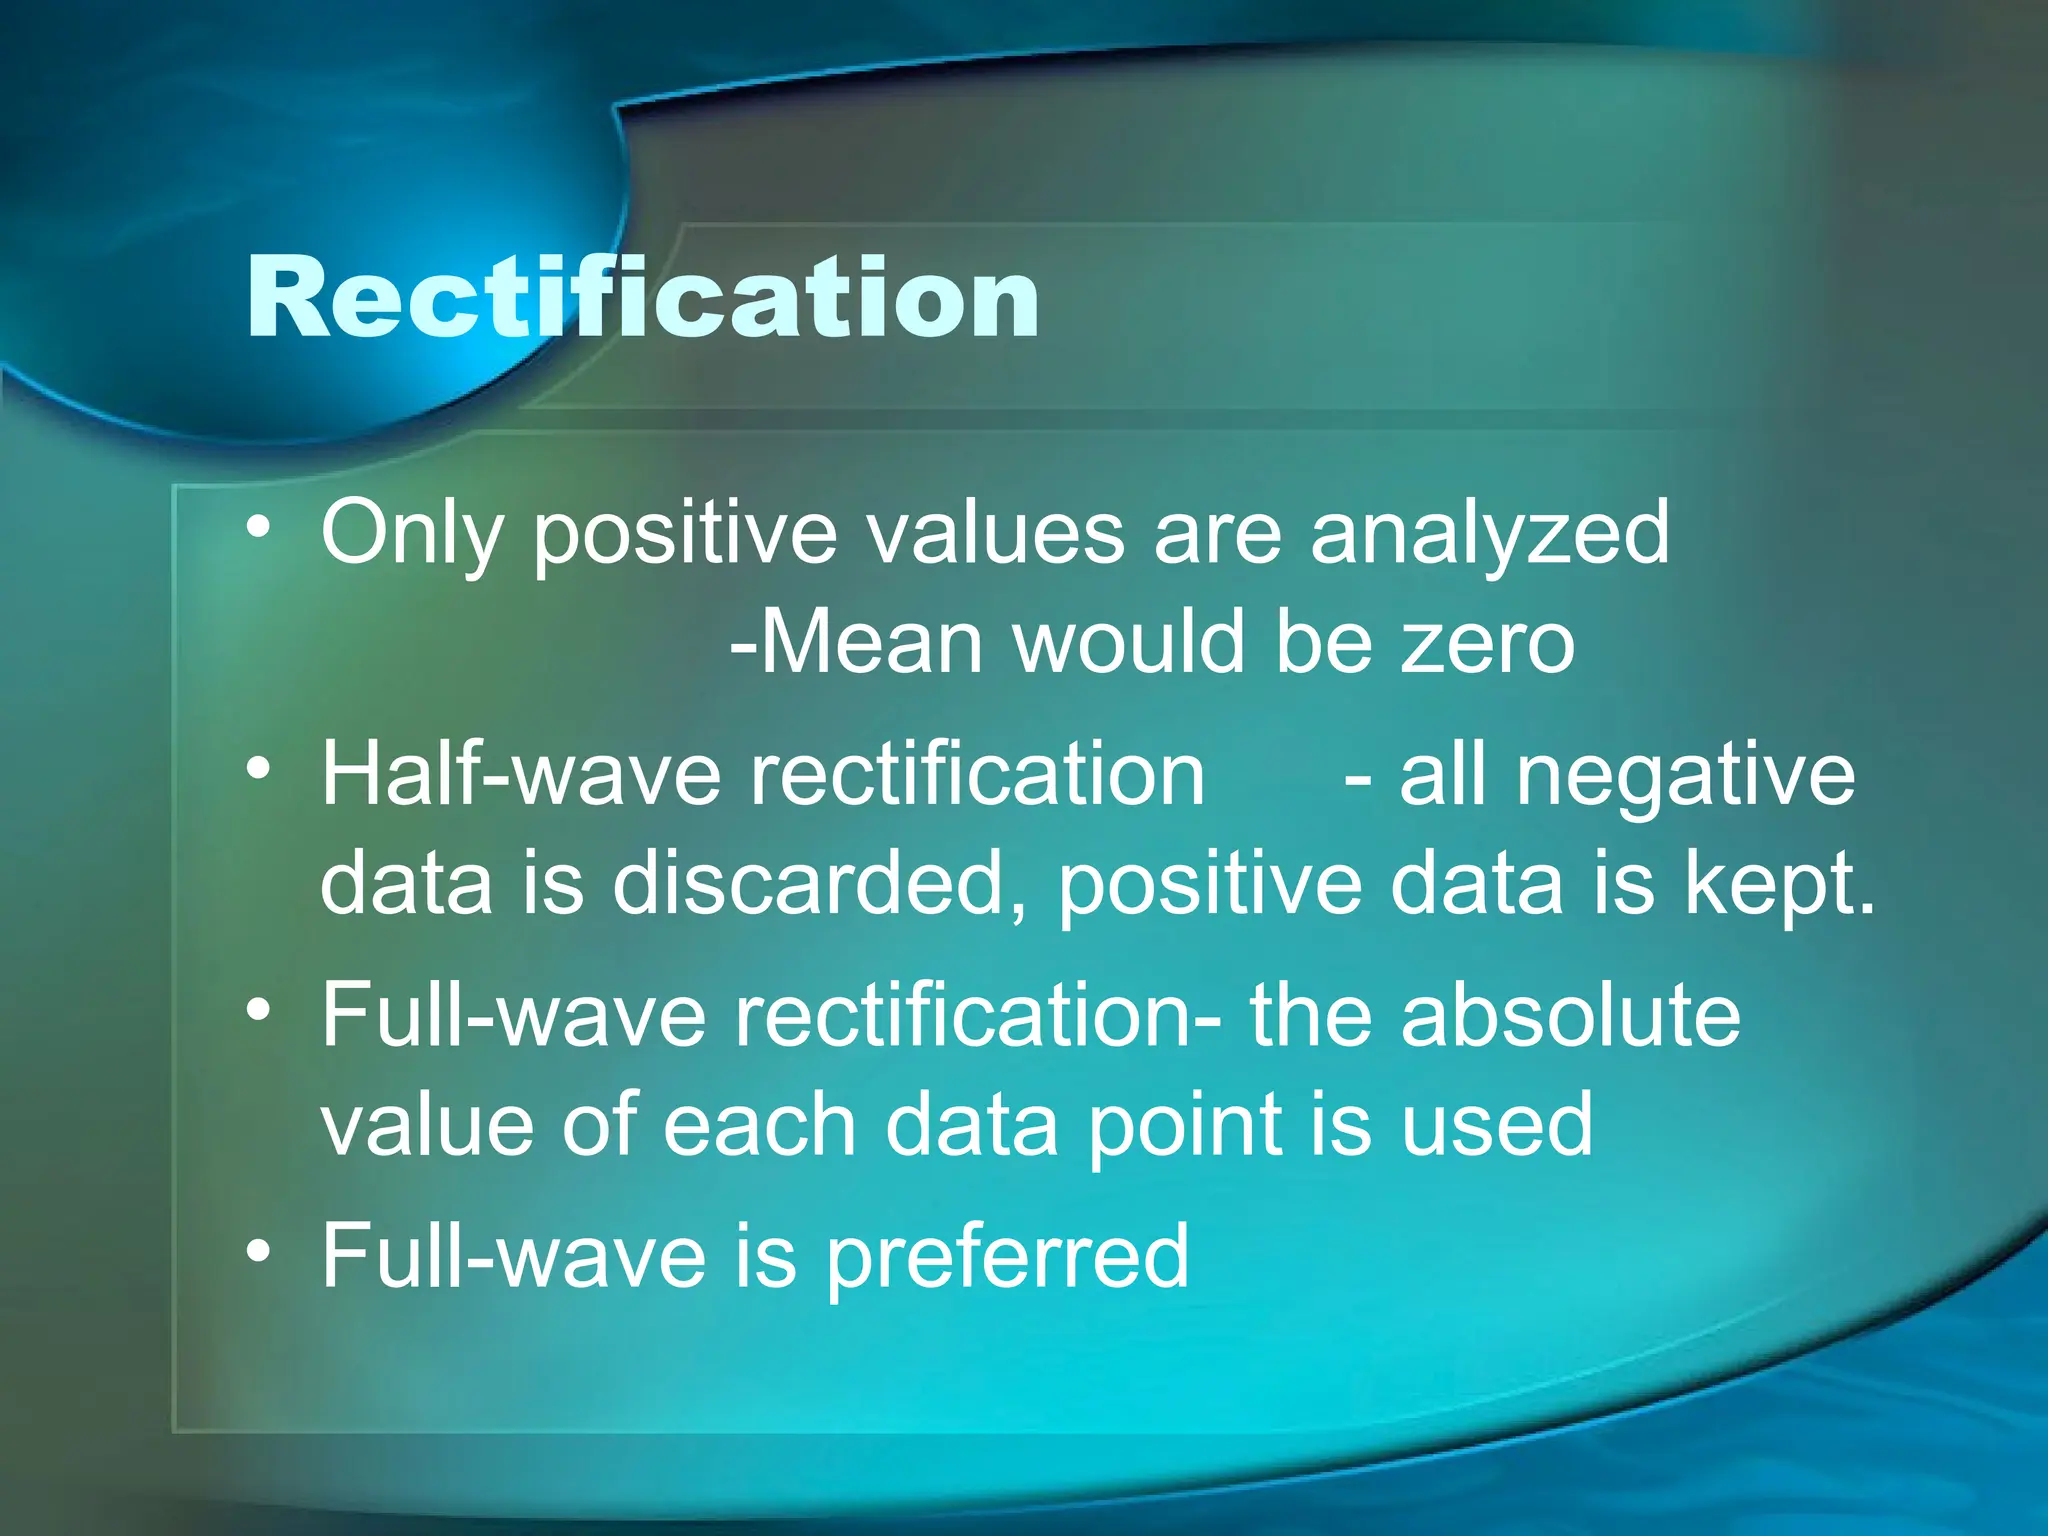
Rectification
• Only positivevalues are analyzed
-Mean would be zero
• Half-wave rectification - all negative
data is discarded, positive data is kept.
• Full-wave rectification- the absolute
value of each data point is used
• Full-wave is preferred
7.
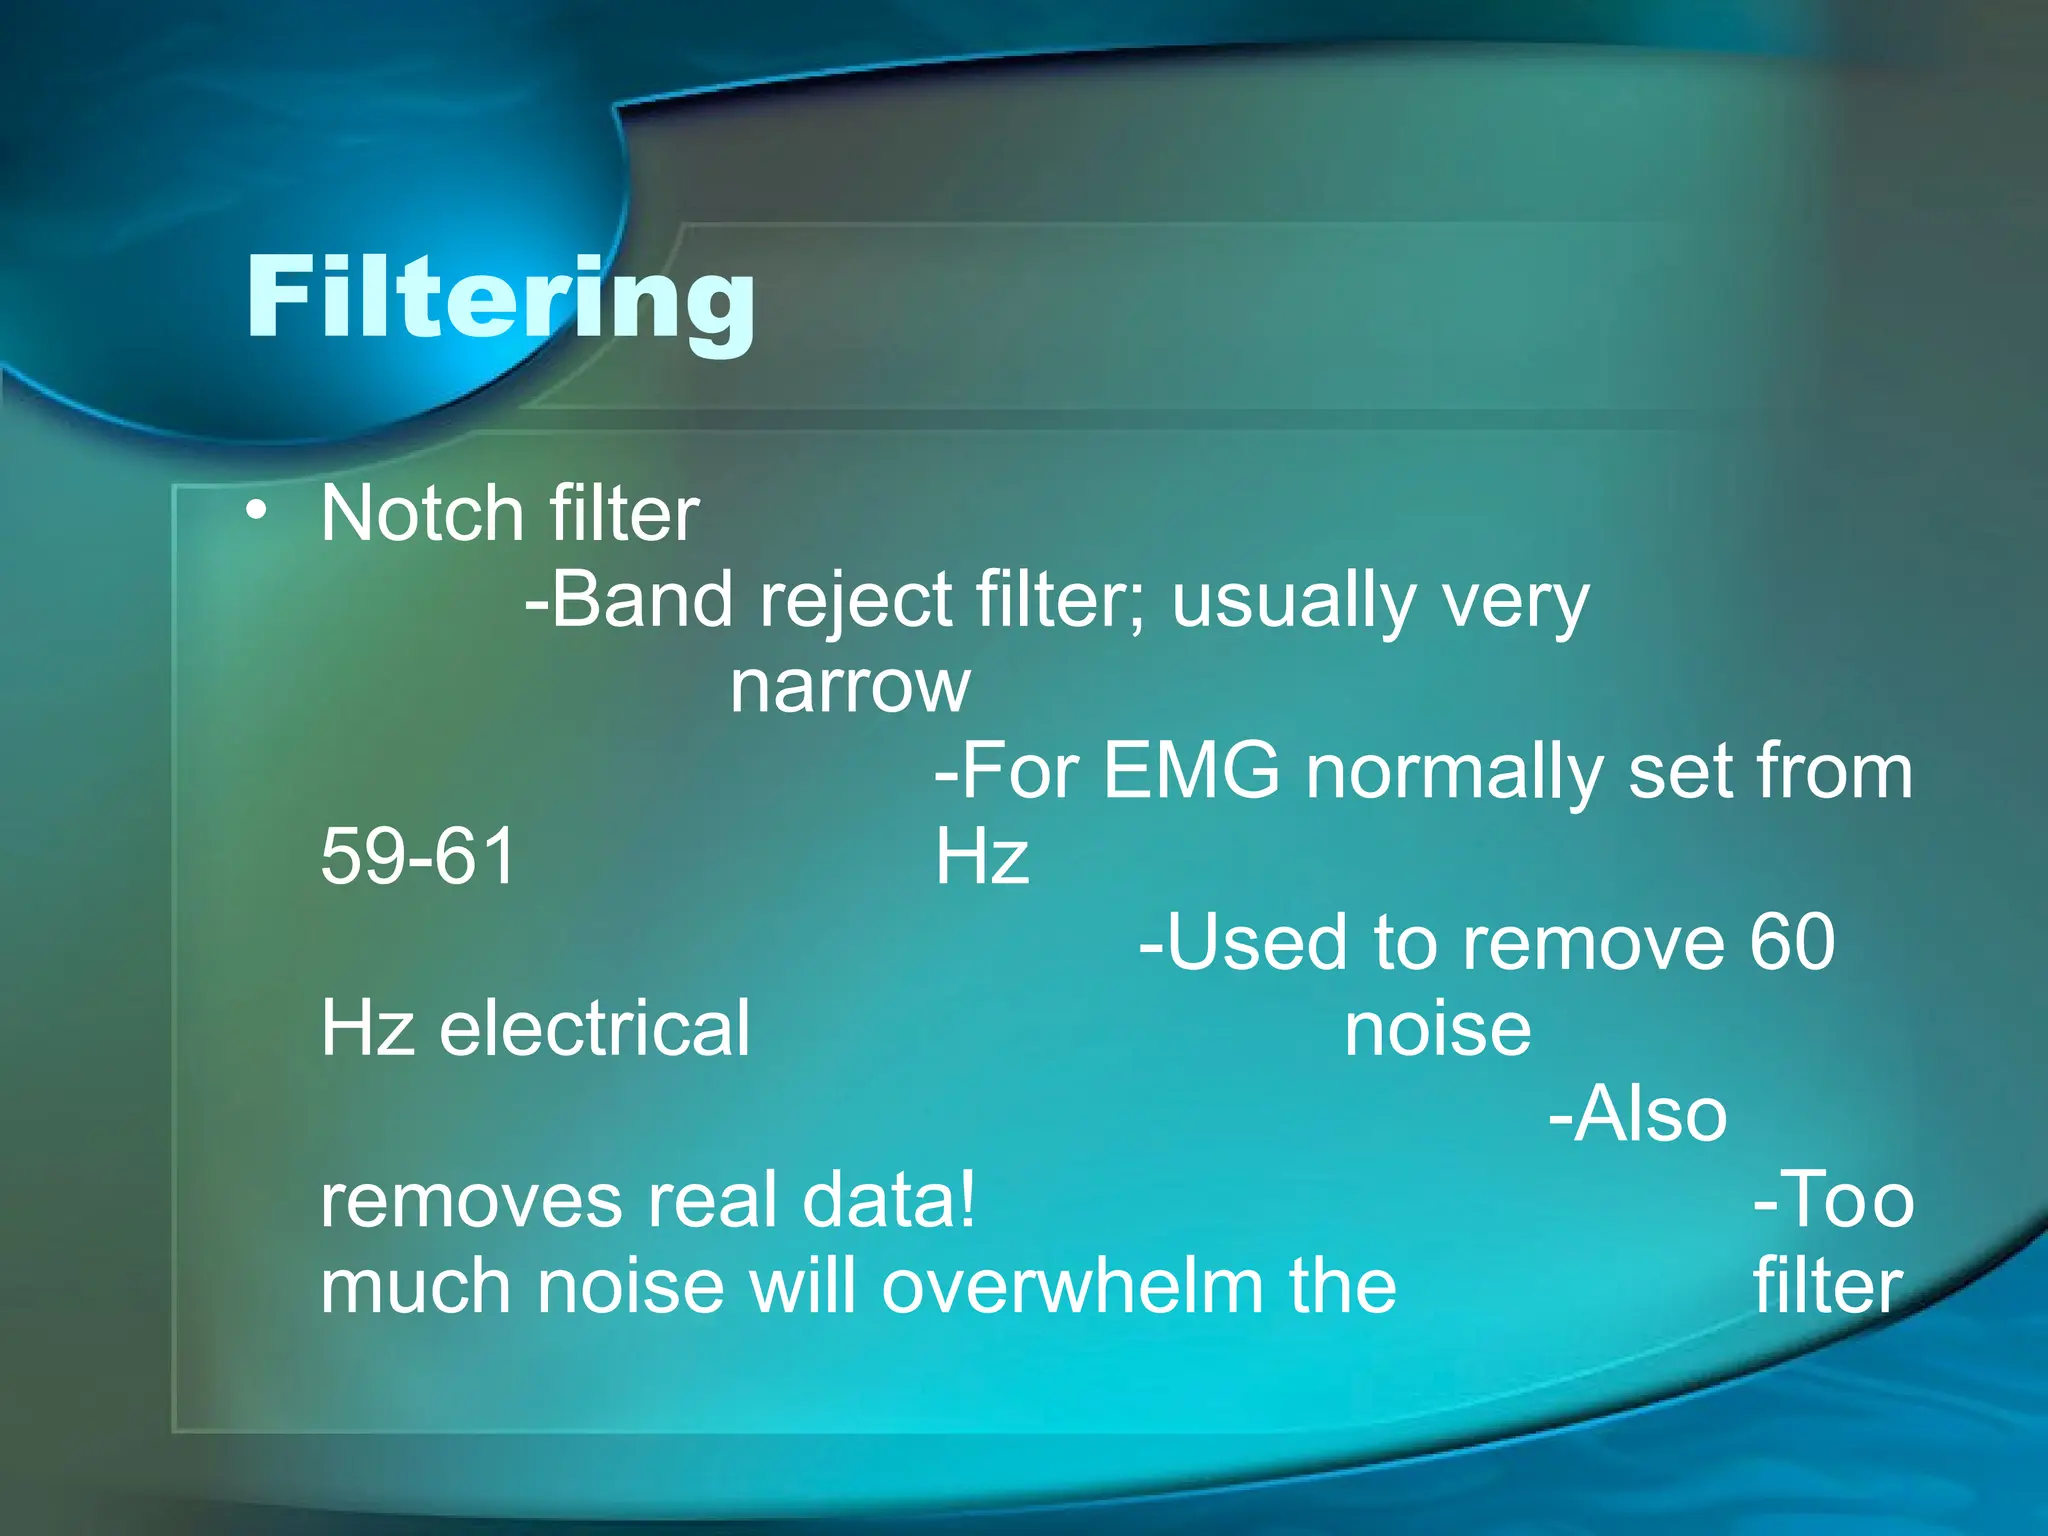
Filtering
• Notch filter
-Bandreject filter; usually very
narrow
-For EMG normally set from
59-61 Hz
-Used to remove 60
Hz electrical noise
-Also
removes real data! -Too
much noise will overwhelm the filter
8.
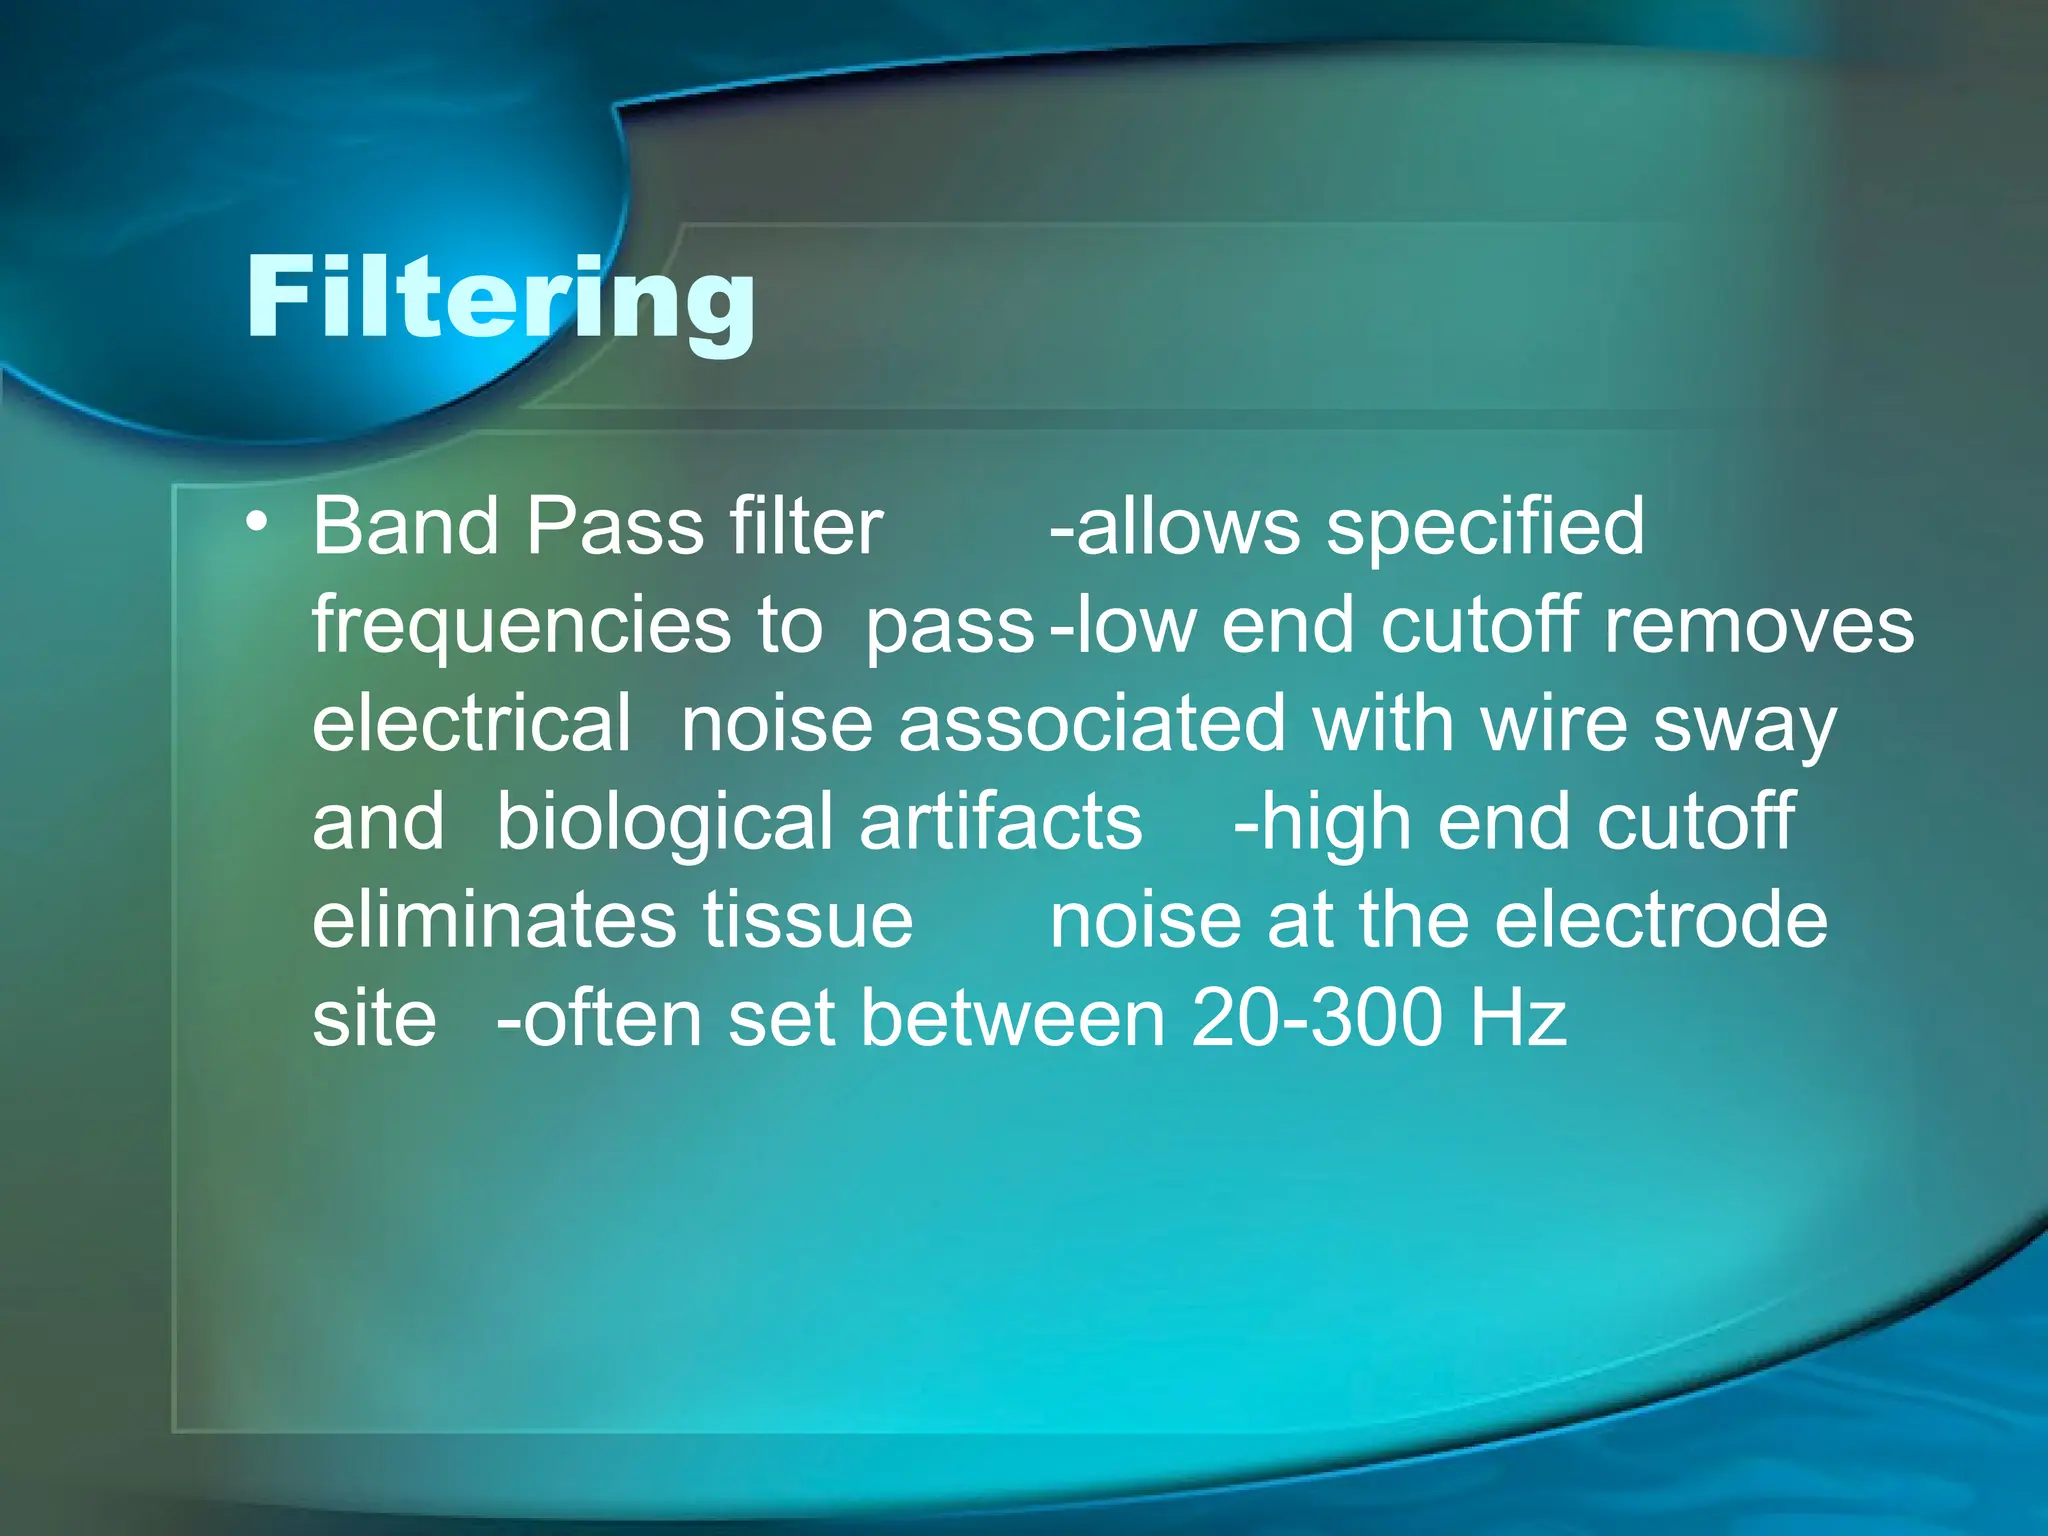
Filtering
• Band Passfilter -allows specified
frequencies to pass-low end cutoff removes
electrical noise associated with wire sway
and biological artifacts -high end cutoff
eliminates tissue noise at the electrode
site -often set between 20-300 Hz
9.
Filtering
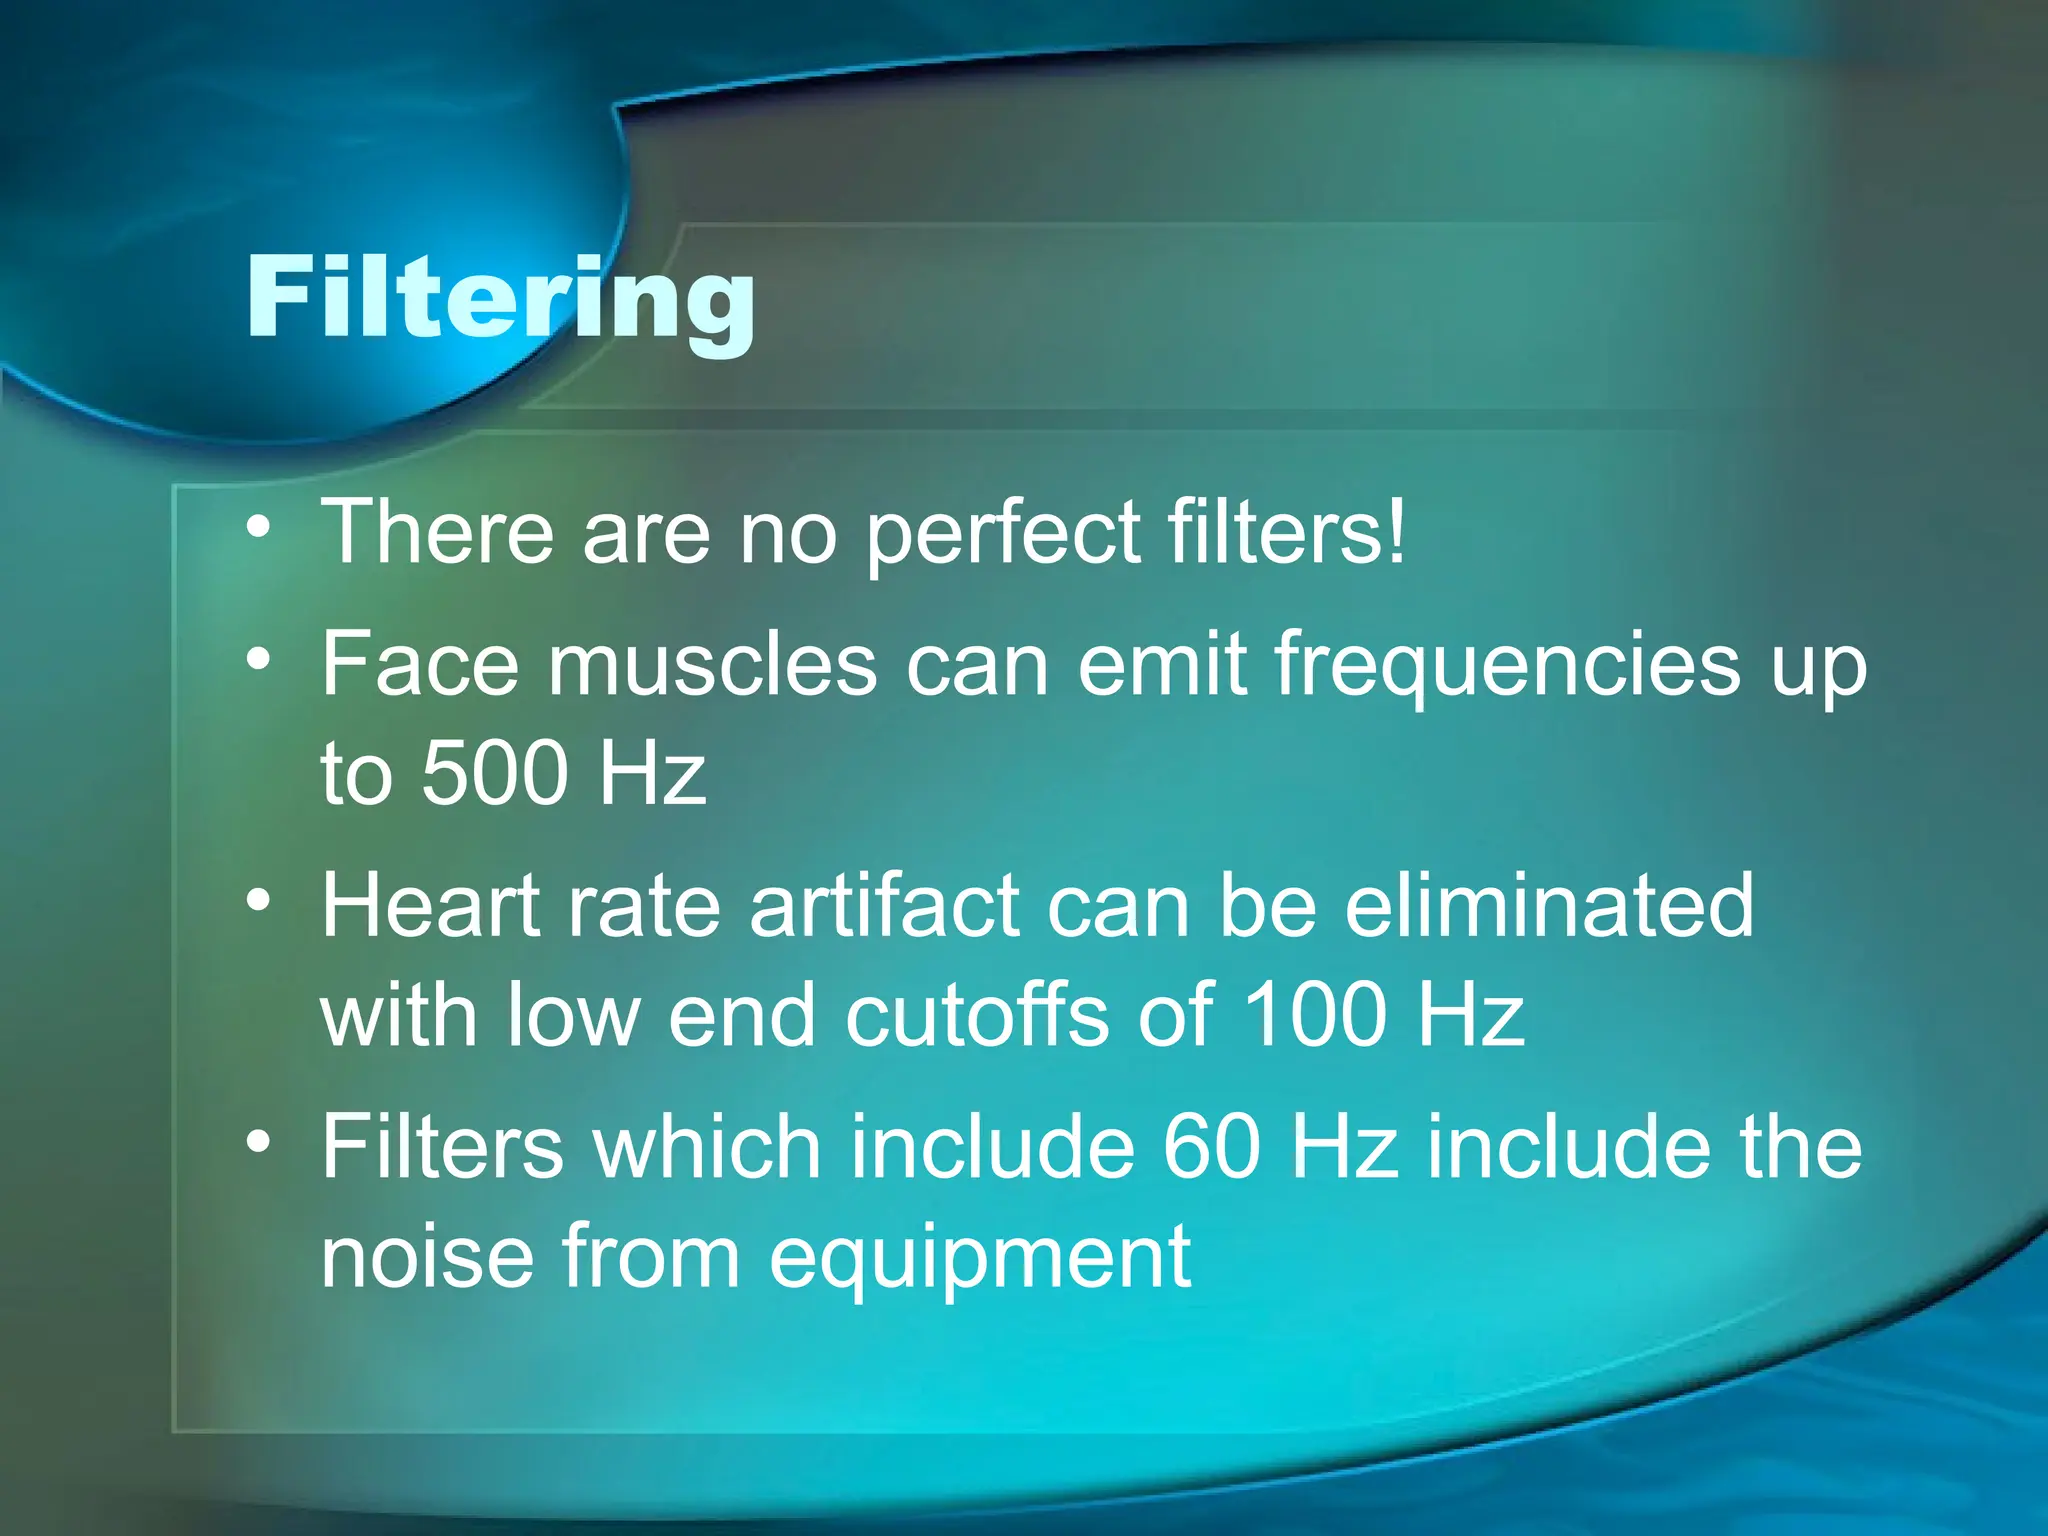
• There areno perfect filters!
• Face muscles can emit frequencies up
to 500 Hz
• Heart rate artifact can be eliminated
with low end cutoffs of 100 Hz
• Filters which include 60 Hz include the
noise from equipment
10.
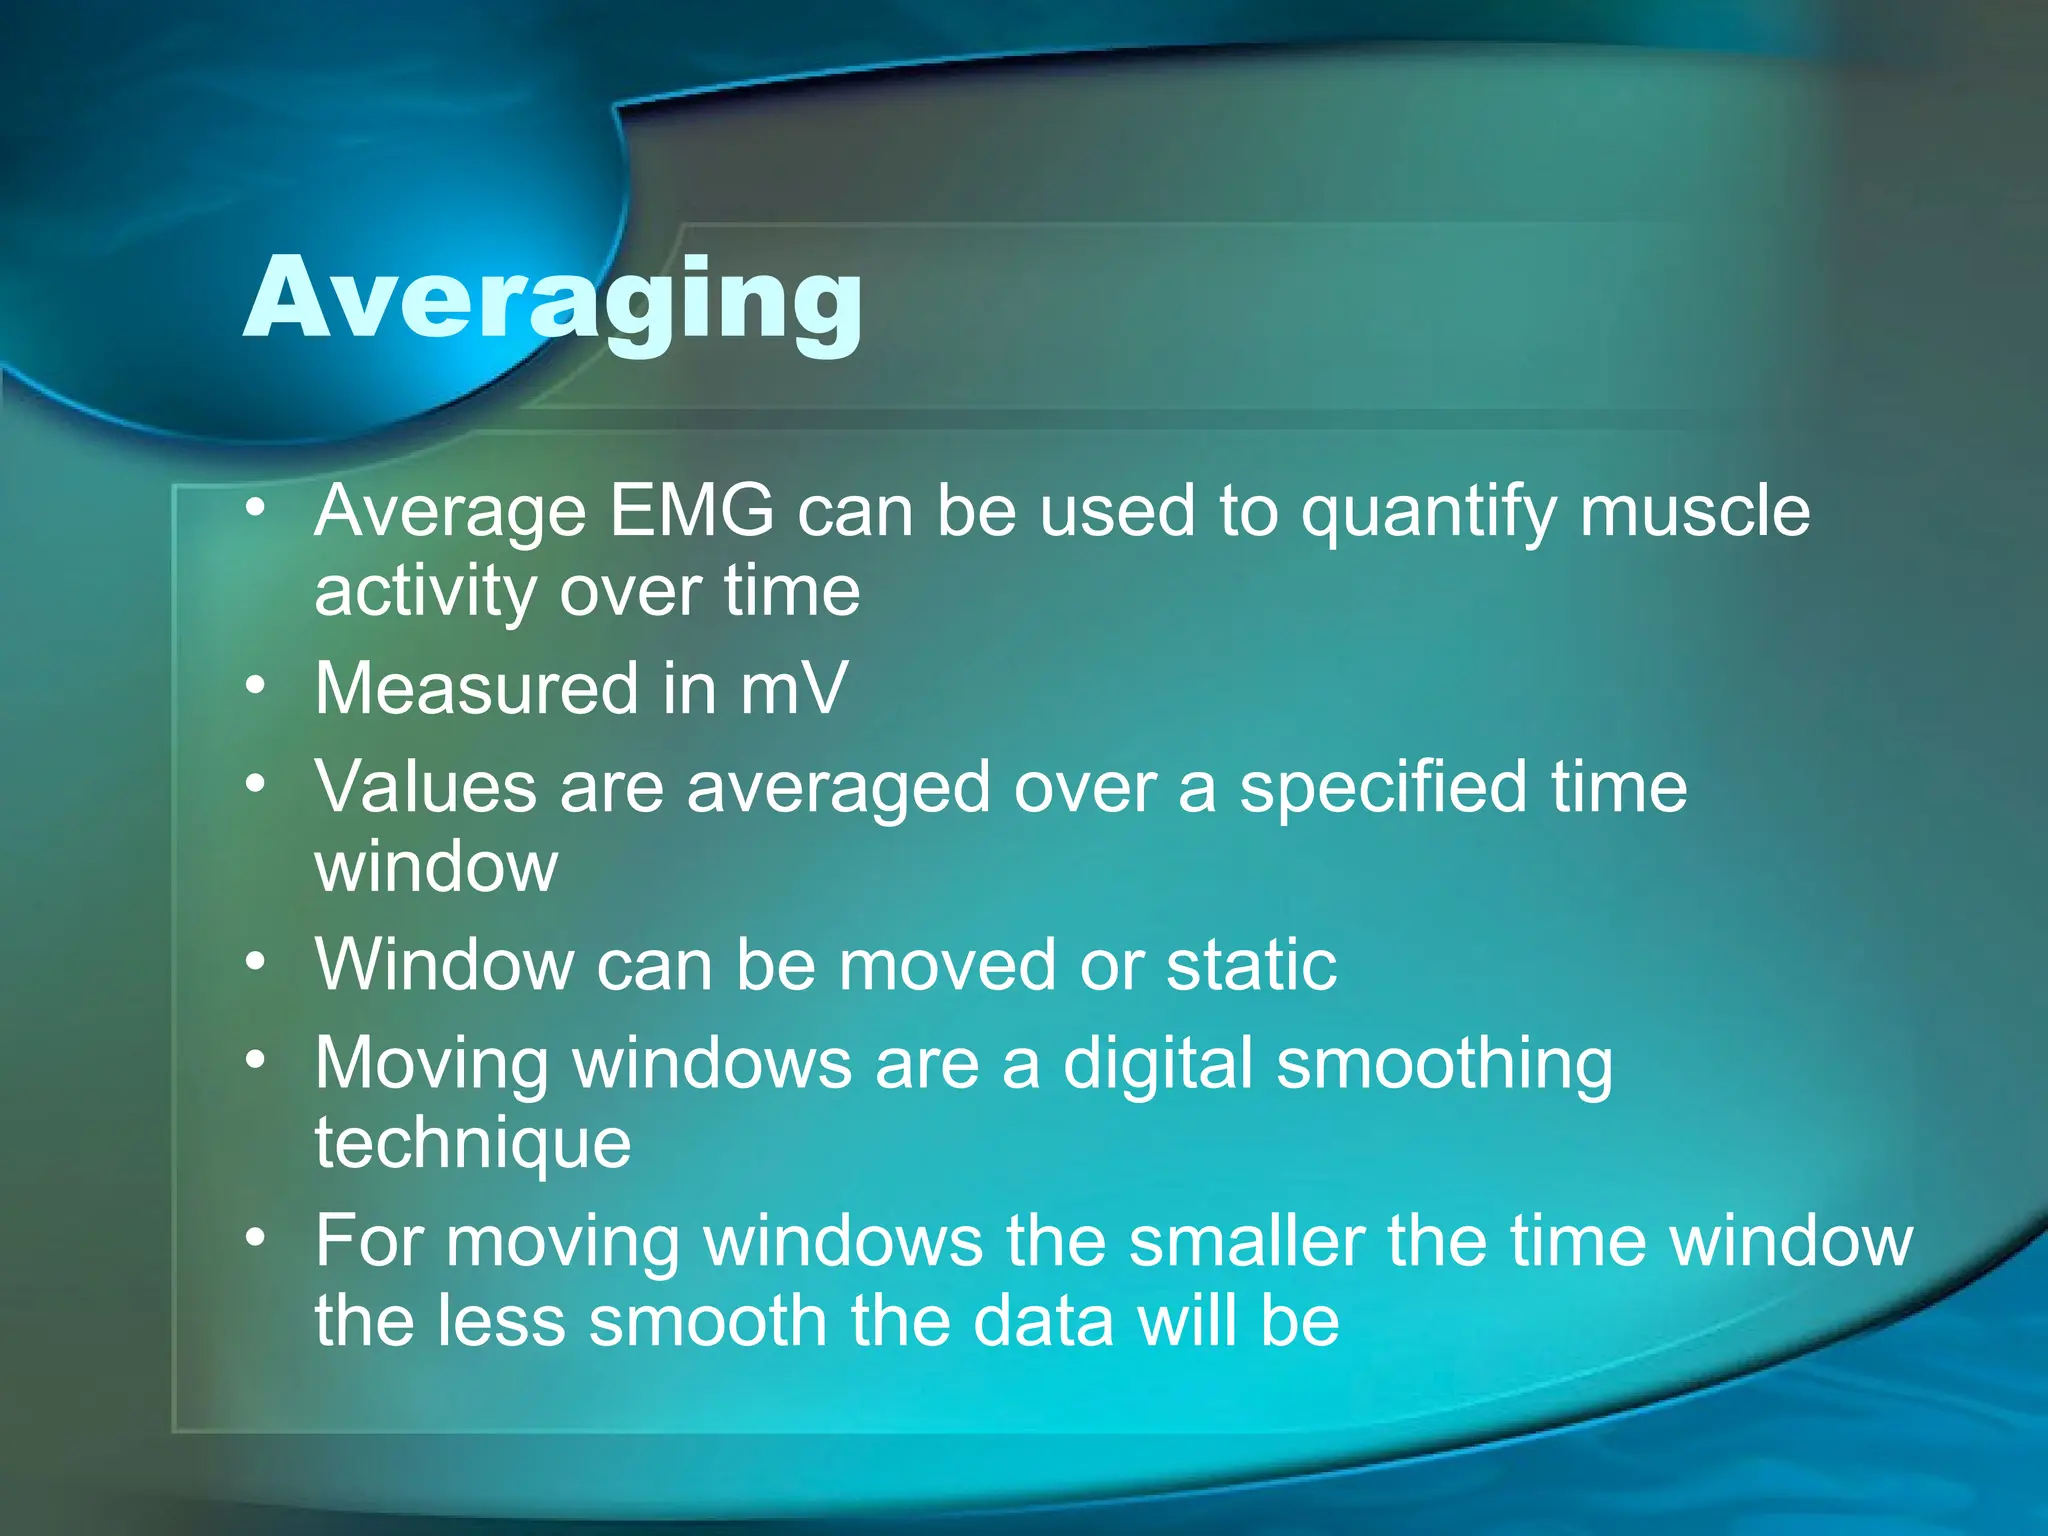
Averaging
• Average EMGcan be used to quantify muscle
activity over time
• Measured in mV
• Values are averaged over a specified time
window
• Window can be moved or static
• Moving windows are a digital smoothing
technique
• For moving windows the smaller the time window
the less smooth the data will be
11.
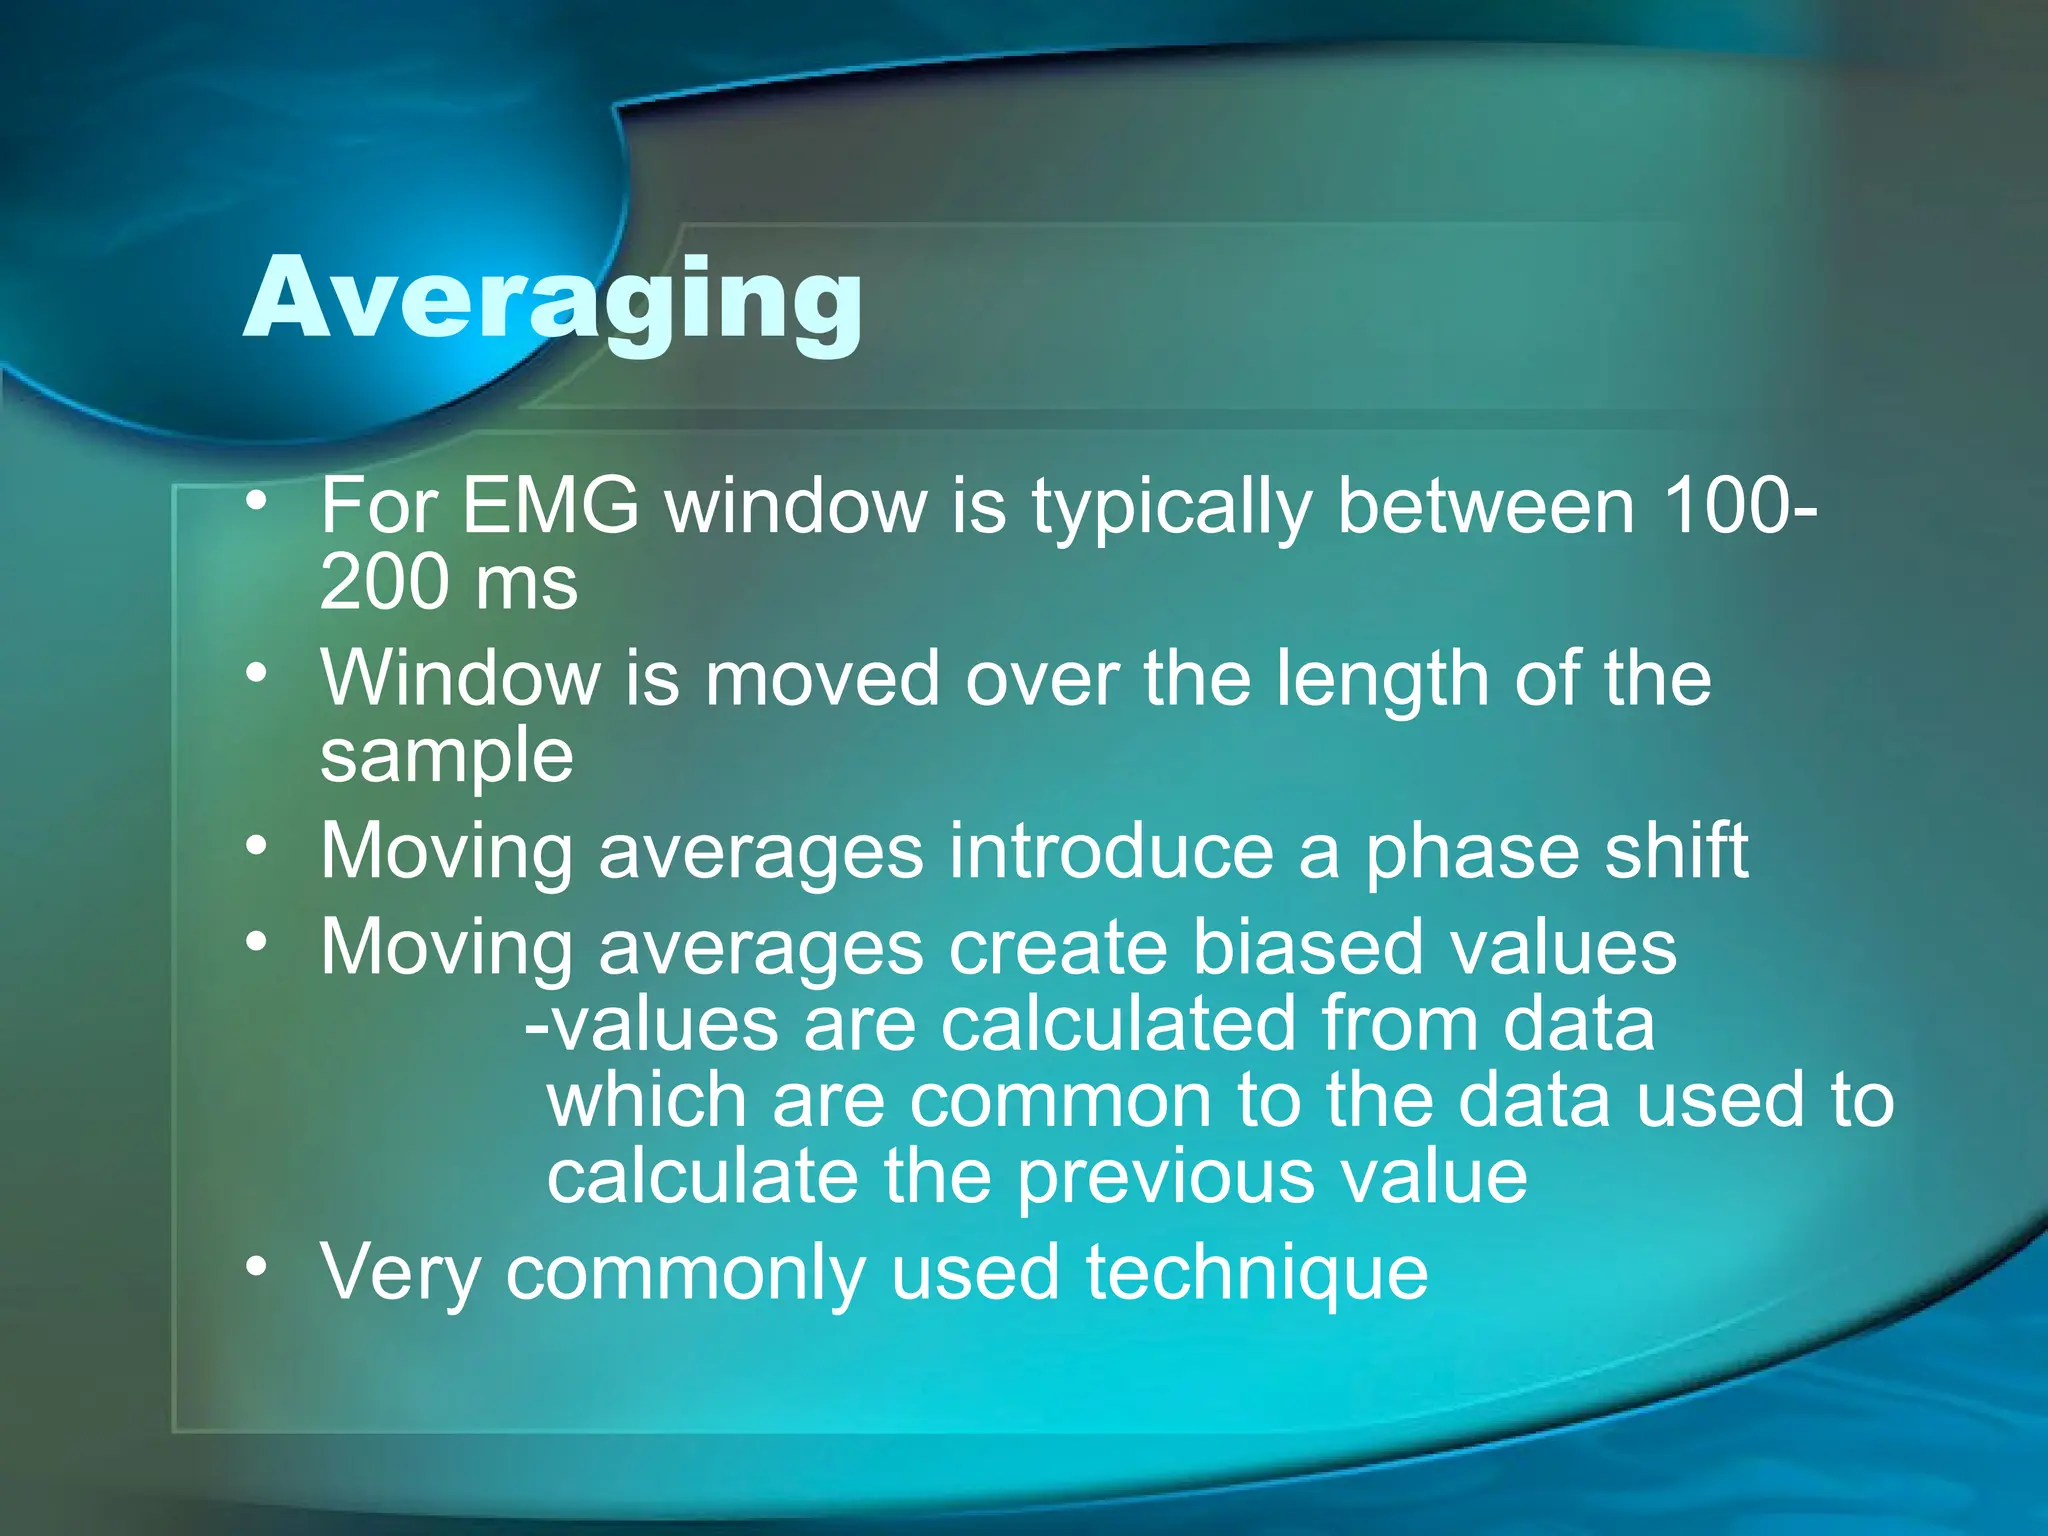
Averaging
• For EMGwindow is typically between 100-
200 ms
• Window is moved over the length of the
sample
• Moving averages introduce a phase shift
• Moving averages create biased values
-values are calculated from data
which are common to the data used to
calculate the previous value
• Very commonly used technique
12.
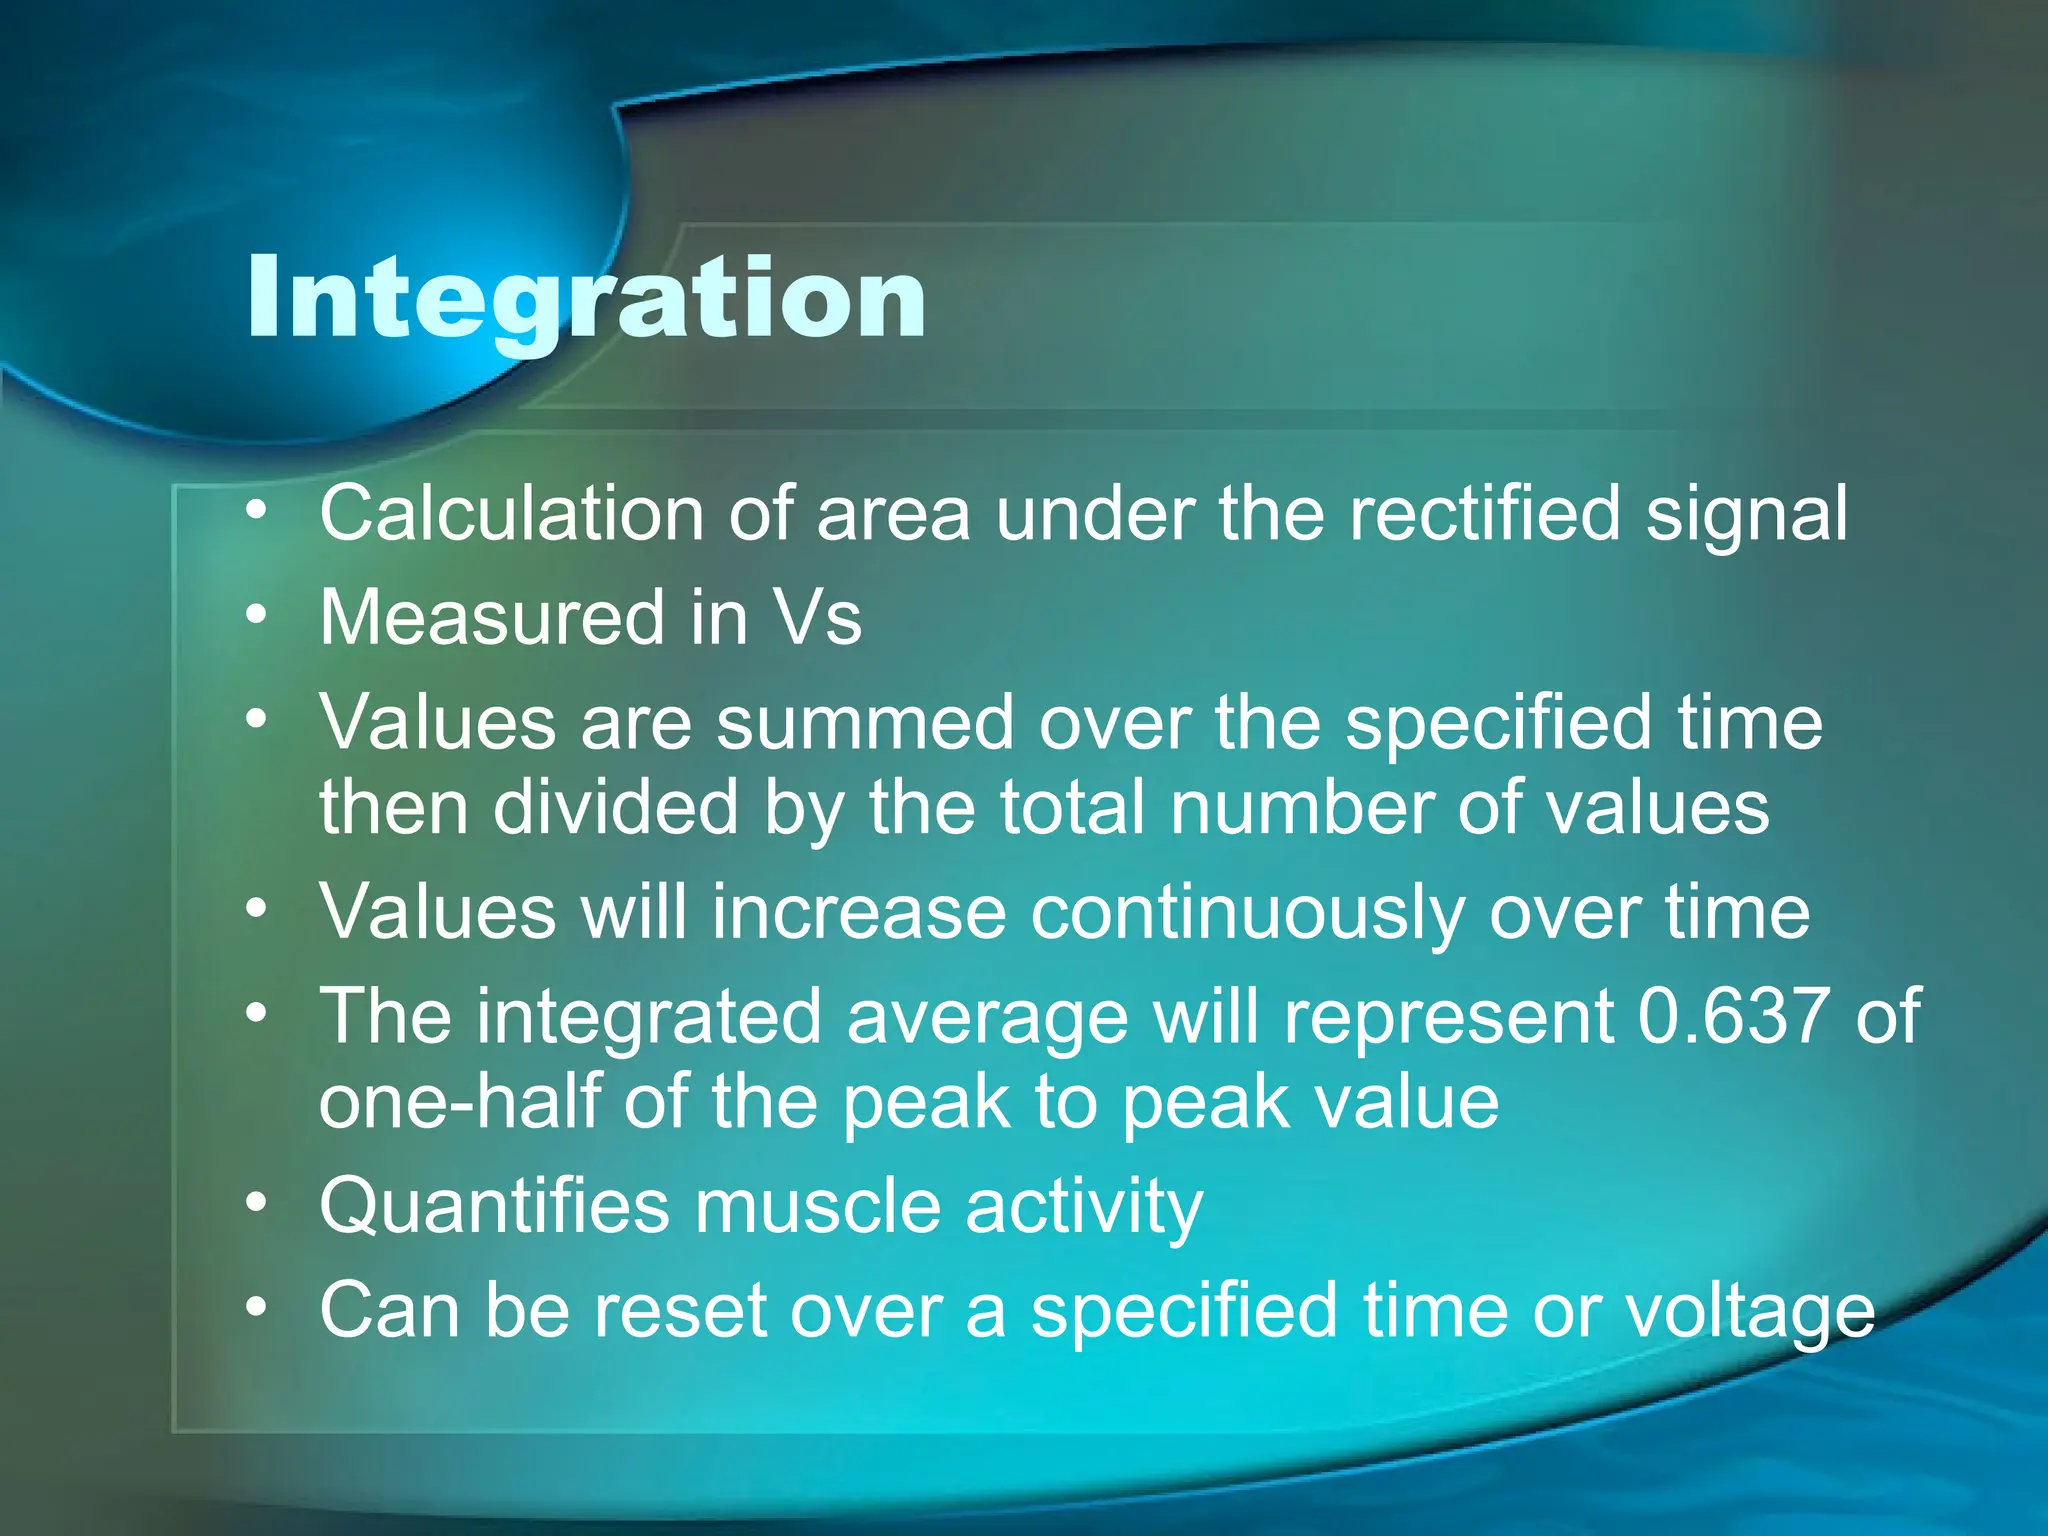
Integration
• Calculation ofarea under the rectified signal
• Measured in Vs
• Values are summed over the specified time
then divided by the total number of values
• Values will increase continuously over time
• The integrated average will represent 0.637 of
one-half of the peak to peak value
• Quantifies muscle activity
• Can be reset over a specified time or voltage
13.
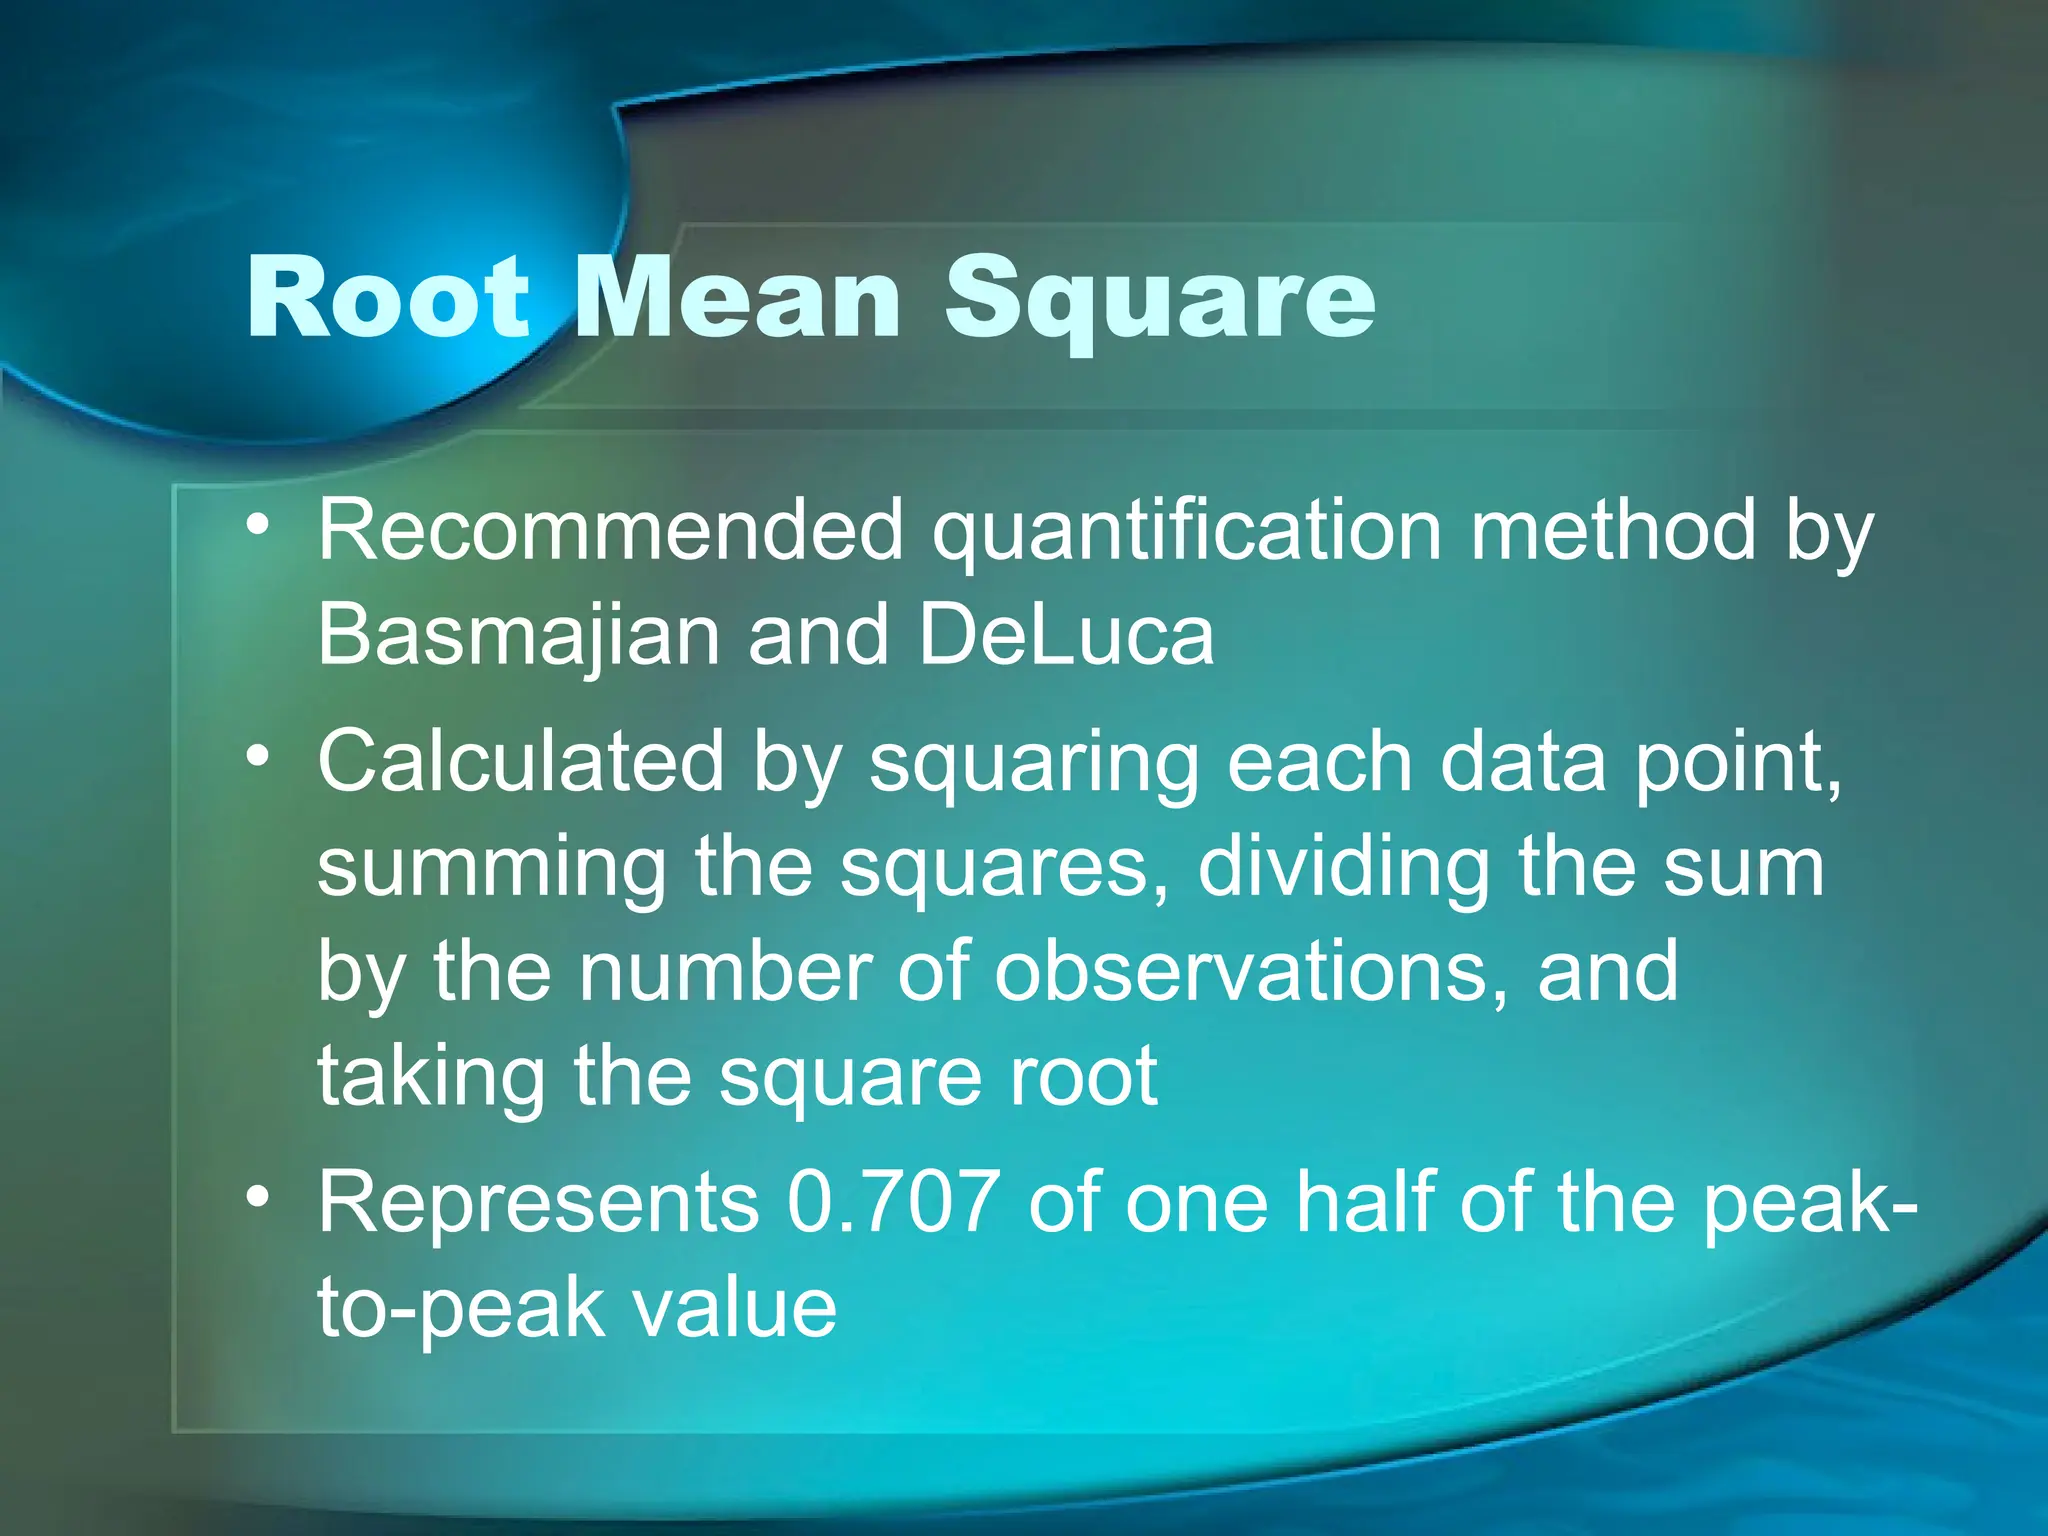
Root Mean Square
•Recommended quantification method by
Basmajian and DeLuca
• Calculated by squaring each data point,
summing the squares, dividing the sum
by the number of observations, and
taking the square root
• Represents 0.707 of one half of the peak-
to-peak value
14.
Number of ZeroCrossings
• Counting the number of times the
amplitude of the signal crosses the zero
line
• Based on the idea that a more active
muscle will generate more action
potentials, which will cause more zero
crossings in the signal
• Primarily used before the FFT algorithm
was widely available
15.
Frequency Analysis
• FastFourrie Transformation is used to
break the EMG signal into its frequency
components.
• Frequency components are graphed as
function of the probability of their
occurrence
• Useful in determining cutoff frequencies
and muscle fatigue
16.
Fatigue Analysis
• Isometriccontraction
• The two most important parameters for
fatigue analysis are the median and mean
frequency.
• Median frequency decreases with the
onset of fatigue
• If fatigue is being measured it is important
to have a large band pass filter
17.
Amplitude Probability
Distribution Function
•Illustrate variance in the signal
• X-axis shows range of amplitudes
• Y-axis shows the percentage of time
spent at any given amplitude
• Distribution during work should be
bimodal -peak associated with effort
-peak associated with rest
18.
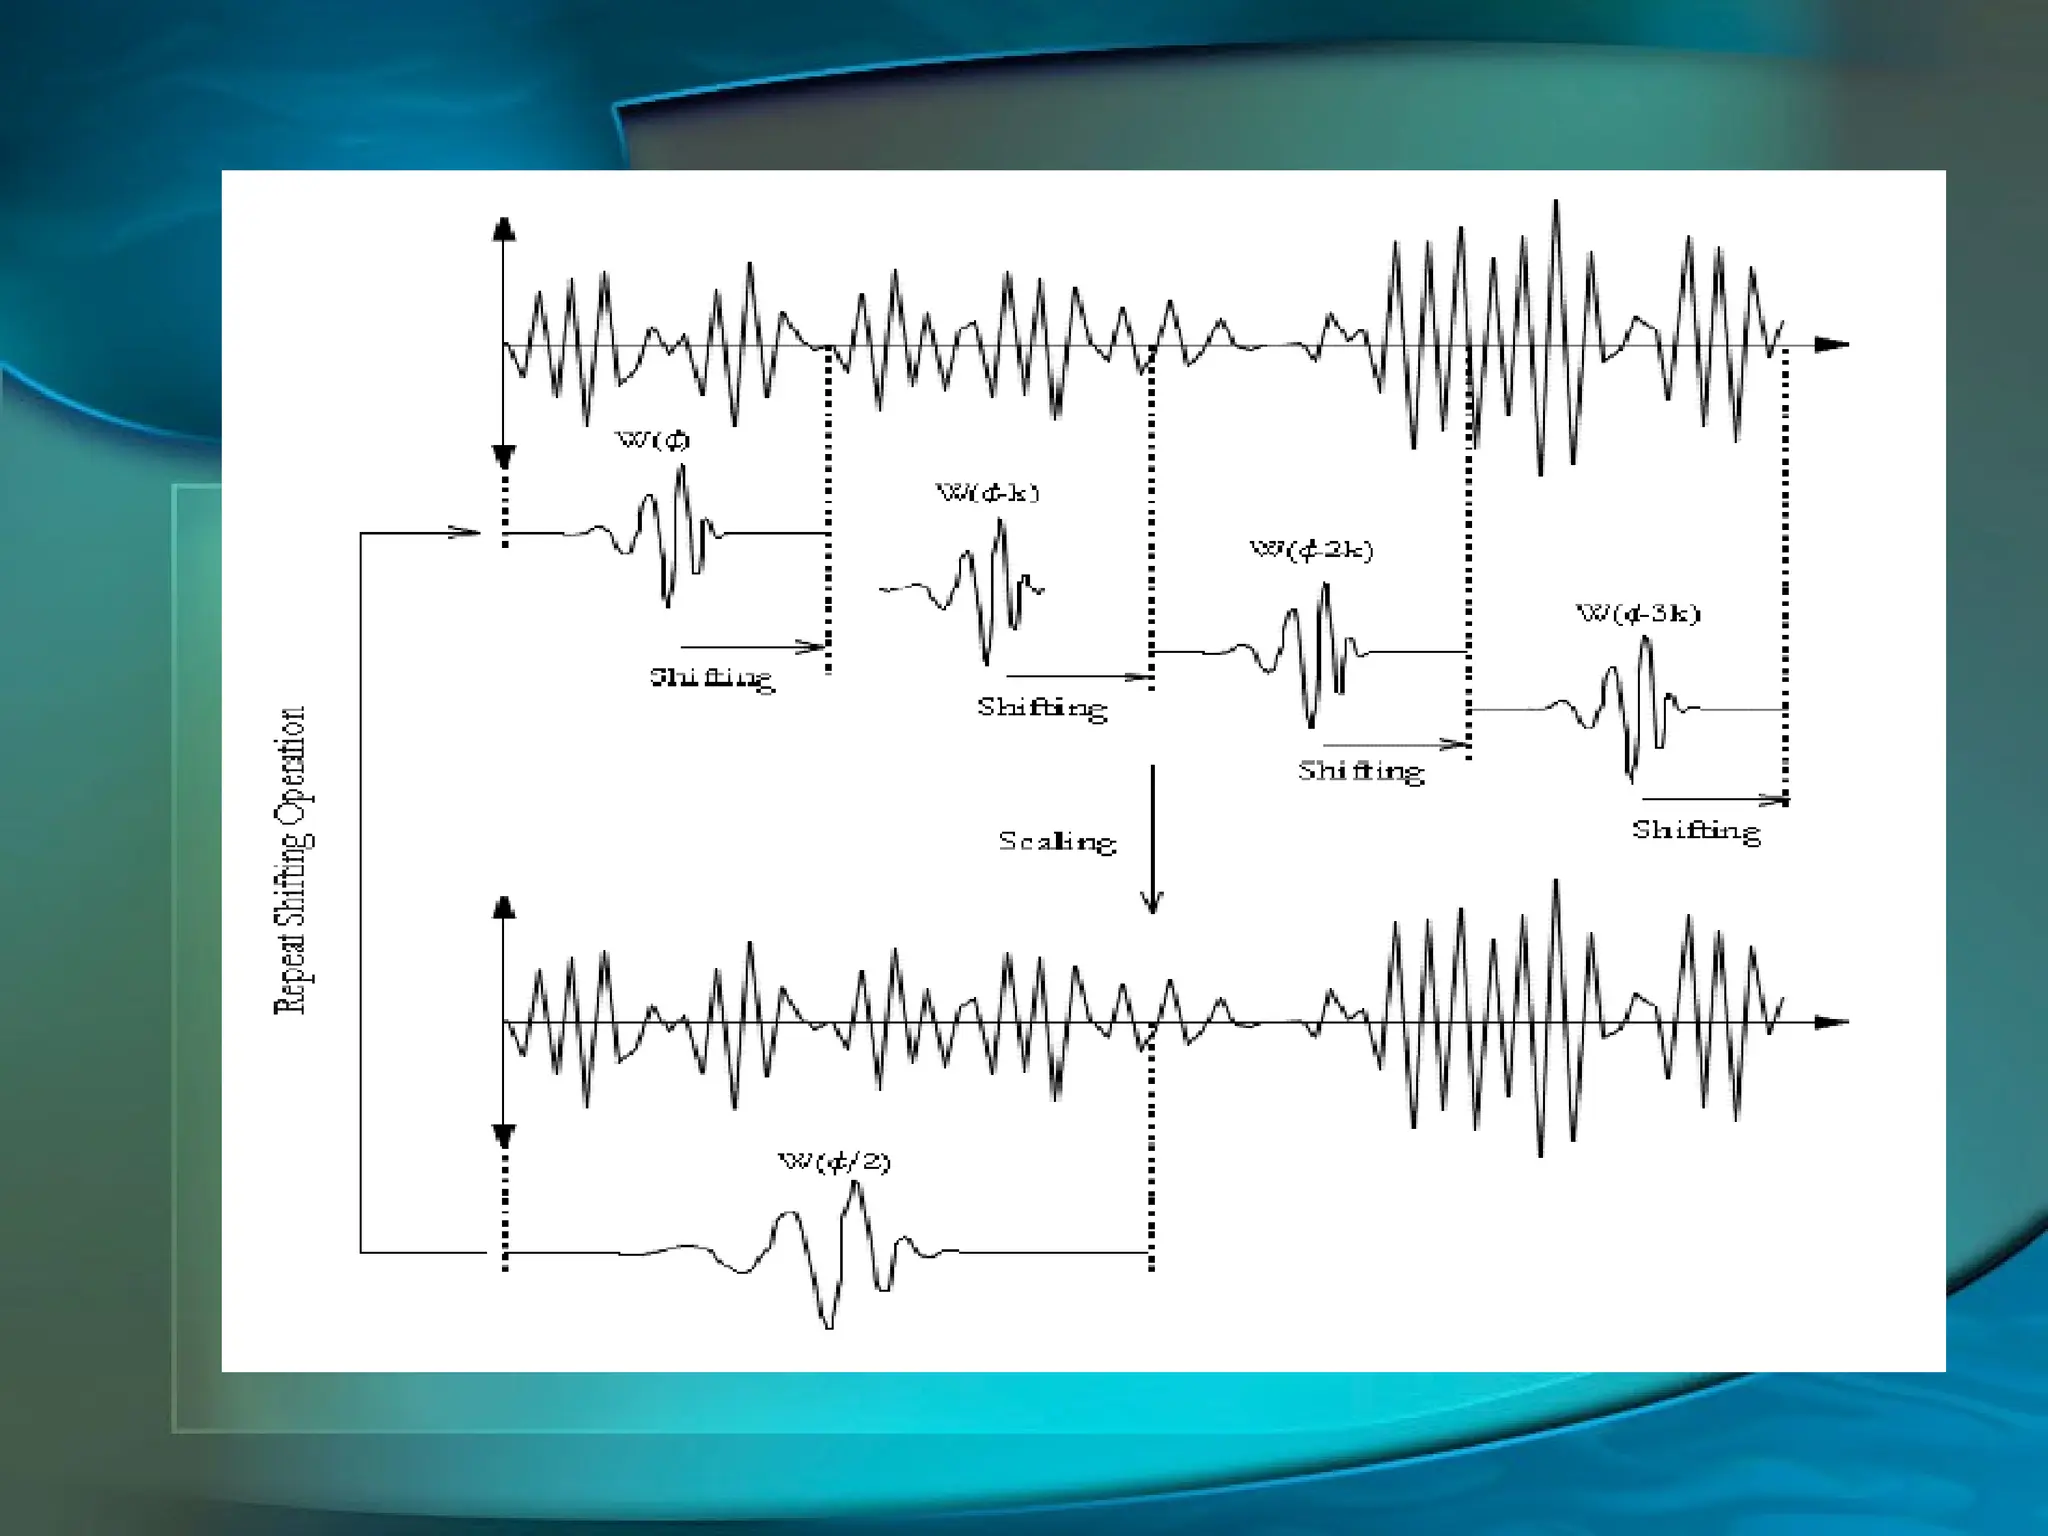
Wavelet analysis
• Usedfor the processing of signals that are
non-stationary and time varying
• Wavelets are parts of functions or any
function consists of an infinite number of
wavelets
• The goal is to express the signal as a linear
combination of a set of functions
• Obtained by running a wavelet of a given
frequency through the original signal
20.
Wavelet Analysis
• Thisprocess creates wavelet coefficients
• When an adequate number of coefficients
have been calculated the signal can be
accurately reconstructed
• The signal is reconstructed as a linear
combination of the basis functions which are
weighted by the wavelet coefficients
21.
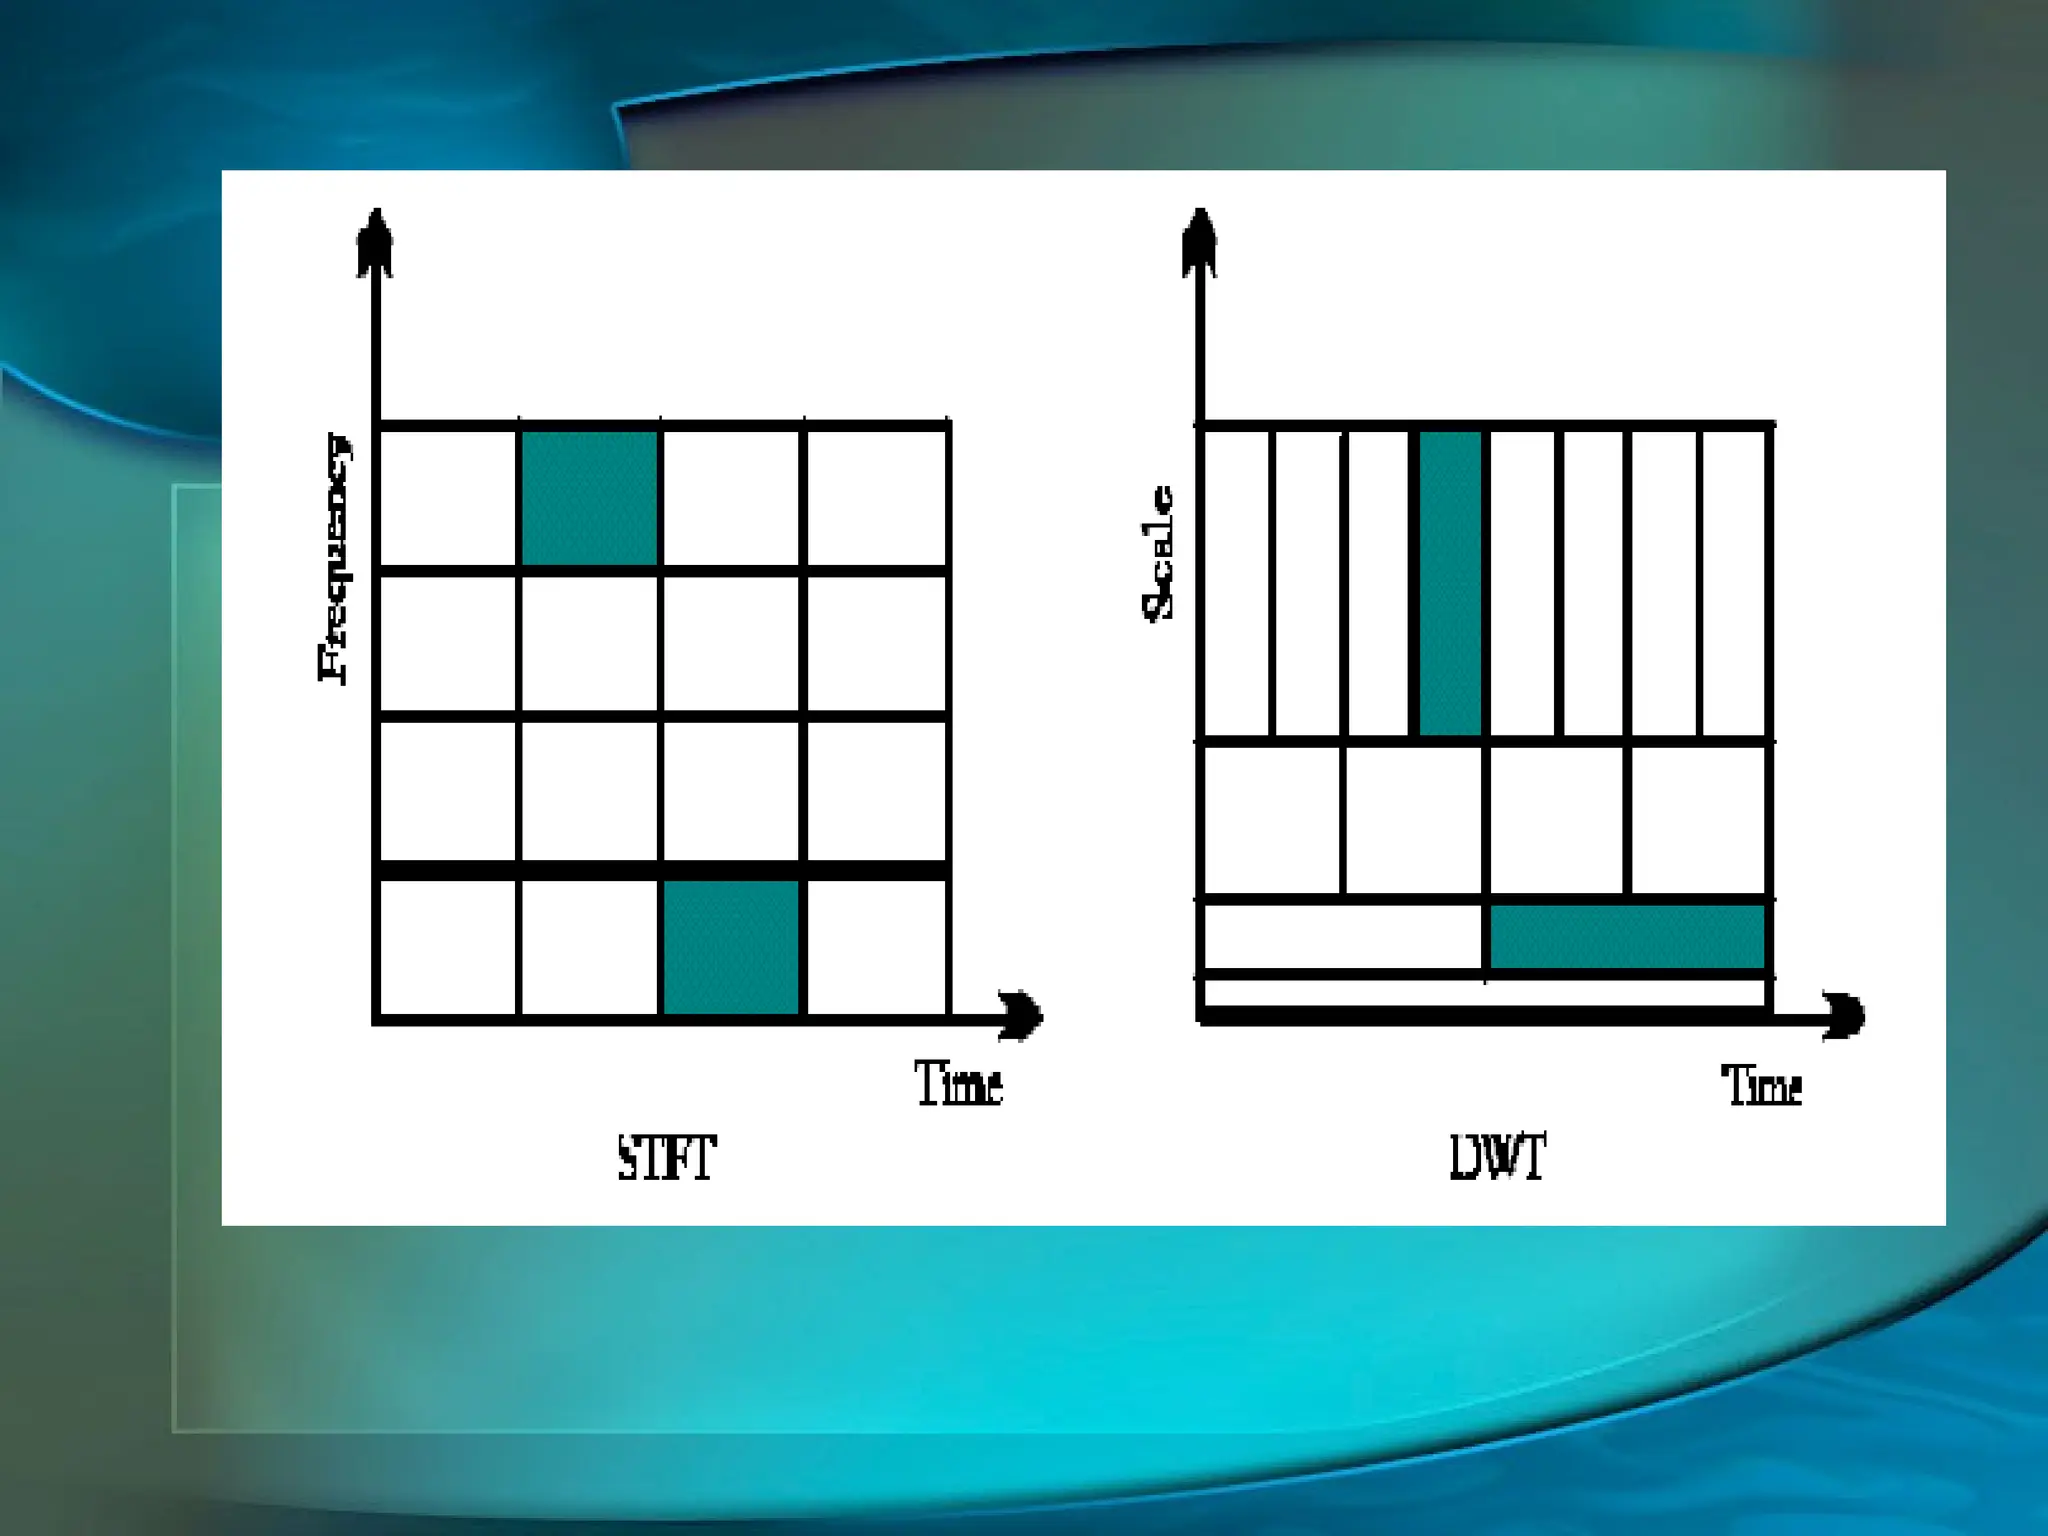
Wavelet Analysis
• Time-frequencylocalization
• Most of the energy of the wavelet is restricted
to a finite time interval
• Fourier transform is band limited
• Produces good frequency localization at low
frequencies, and good time localization at
high frequencies
• Segments, or tiles the time-frequency plane
23.
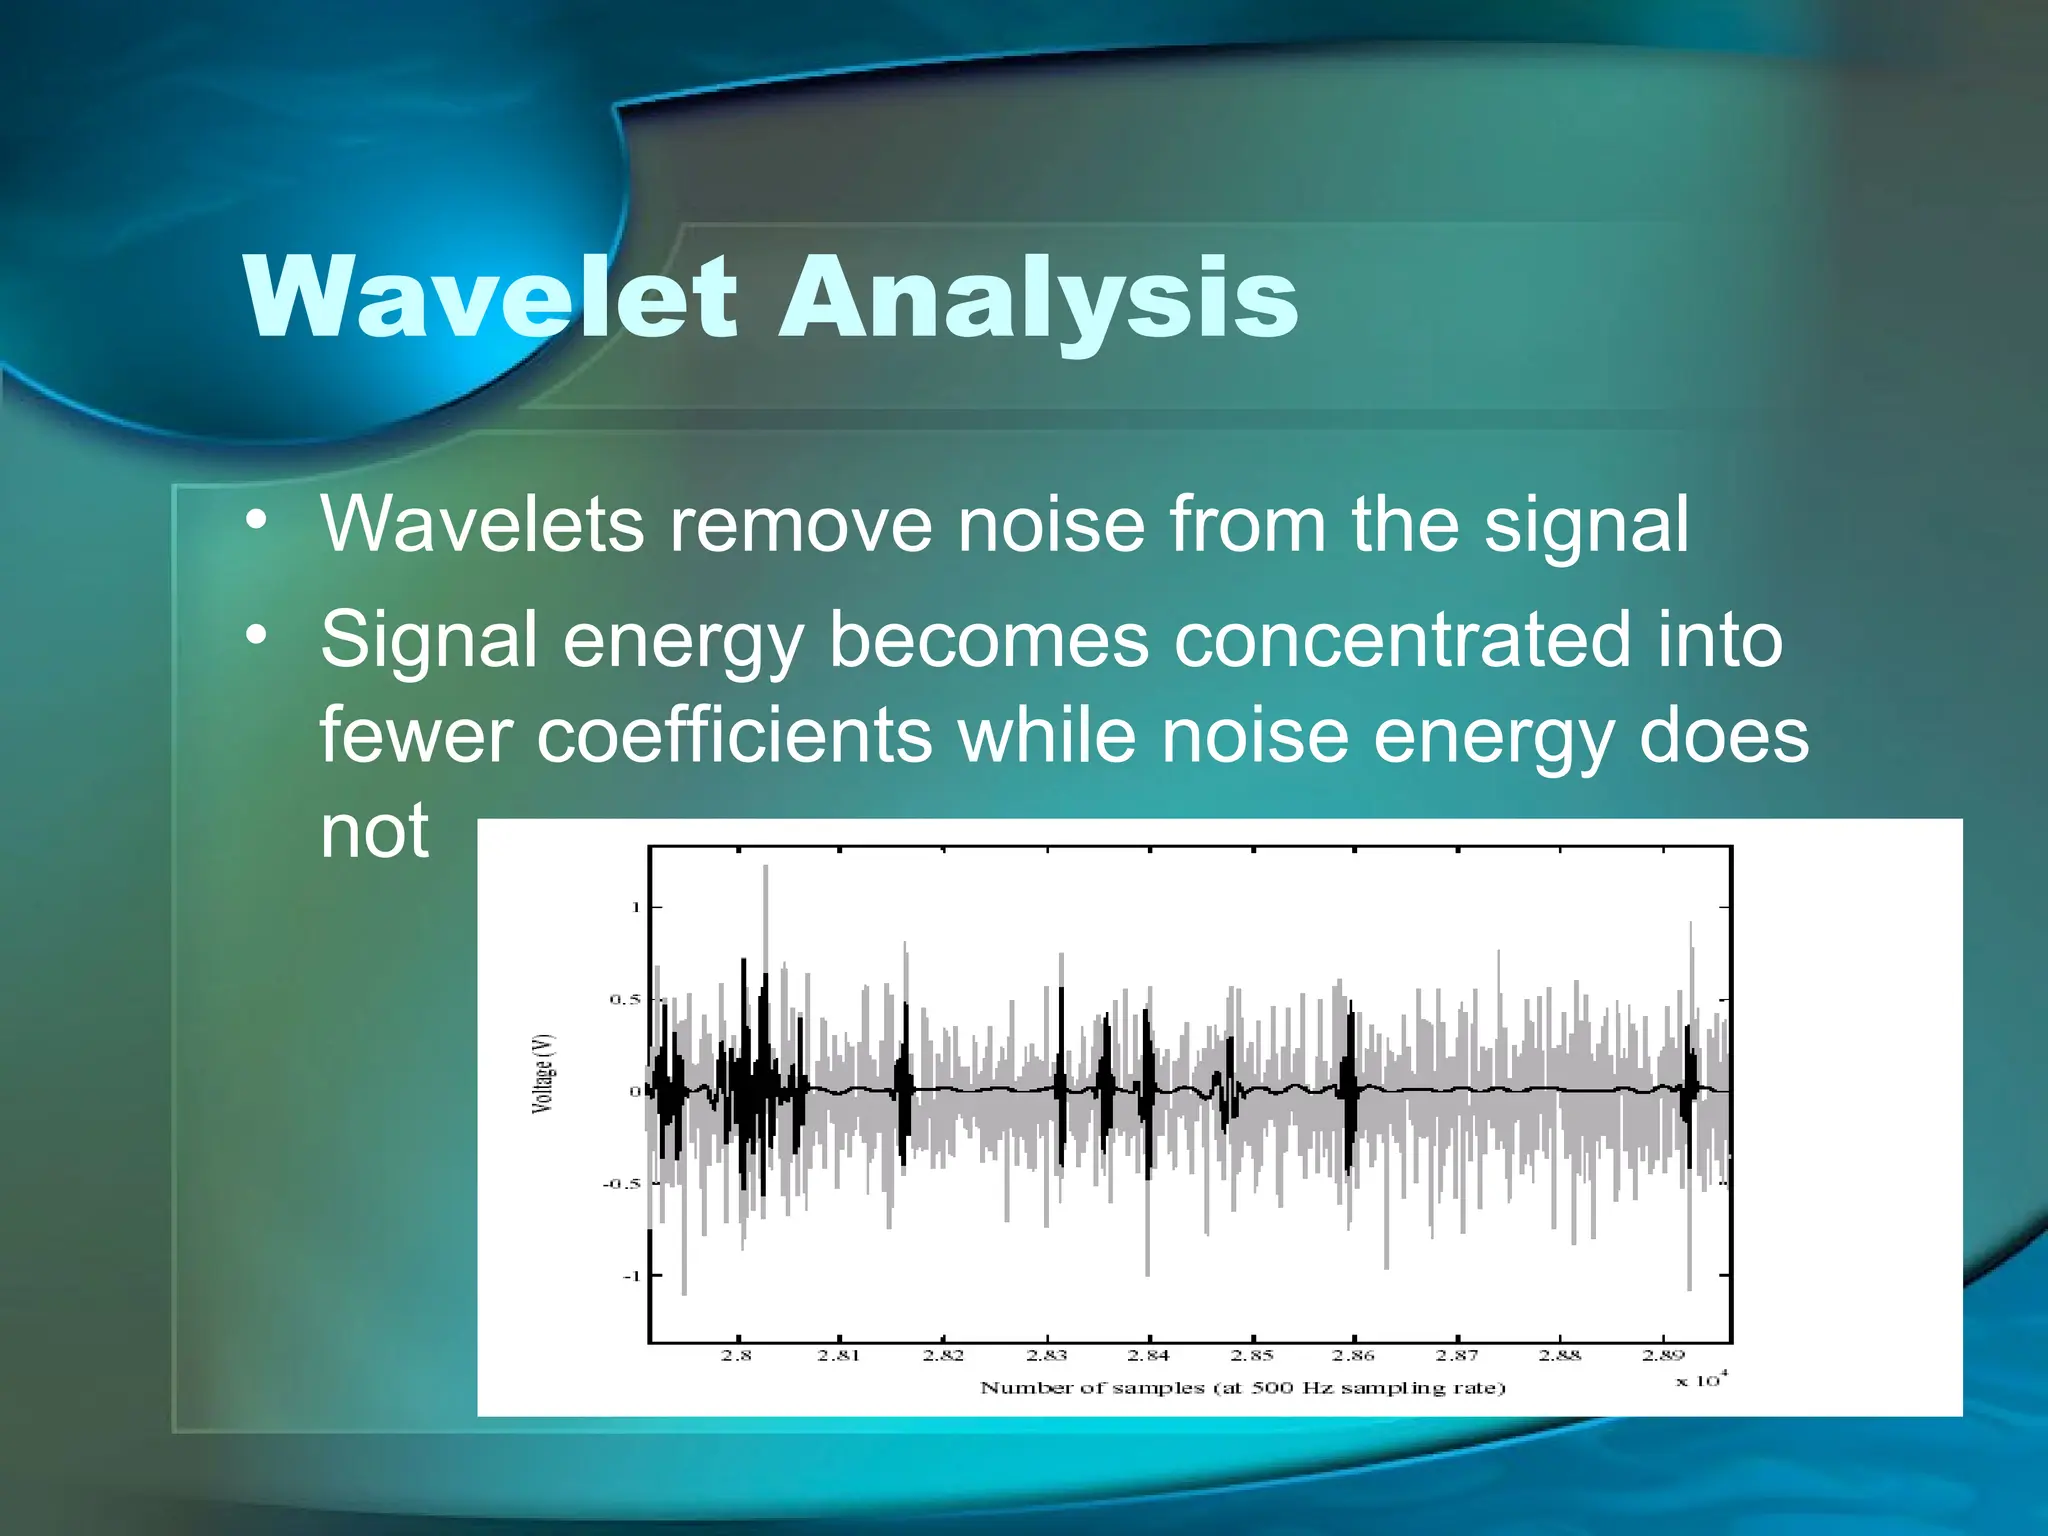
Wavelet Analysis
• Waveletsremove noise from the signal
• Signal energy becomes concentrated into
fewer coefficients while noise energy does
not
24.
Normalizing
• There isno absolute scale so direct
comparisons between subjects or
conditions cannot be made
• Maximum voluntary contraction levels
are often used to compare EMG
readings between subjects (i.e..50%
MVC)
• Relies on subject to give max effort
25.
Normalizing
• Record contractionsover a dynamic
movement cycle
• At least 4 repetitions are required
• Peak values are averaged which
creates an anchor point
• Subsequent values are represented as
a percentage of the anchor point
26.
Conclusion
• EMG offersa great deal of useful
information
• The information is only useful if it can
be quantified
• Quantifying EMG data can be a
qualitative process
Bibliography
• Kleissen, R.F.M,Buurke, J.H., Harlaar, J., Zilvold, G. (1998)
Electromyography in the Biomechanical analysis of human
movement and its clinical application. Gait and Posture. Vol.
8,143-158
• Aminoff, M.J. (1978) Electromyography in Clinical Practice.
Addison-Wesley Publishing Company, Menlo Park, CA
• Dainty, D.A., Norman, R.W. (1987) Standardized
Biomechanical Testing in Sport. Human Kinetics Publishers,
Champaign, IL
• Cram, J.R., Kasman, G.S. (1998) Introduction to Surface
Electromyography. Aspen Publishers, Gaithersburg, MD
• Medved, V. (2001) Measurement of Human Locomotion. CRC
Press, New York, NY
29.
Bibliography
• Loeb, G.E.,Gans, C. (1986) Electromyography for
Experimentalists. The University of Chicago Press, Chicago, IL
• Basmajian, J.V., DeLuca, C.J. (1985) Muscles Alive. Williams
& Wilkins, Baltimore, MD
• Moshou, D., Hostens, I., Ramon, H. (2000) Wavelets and Self-
Organizing Maps in Electromyogram Analysis. Katholieke
Universiteit Leuven
• DeLuca, C.J. (1993) The Use of Surface Electromyography in
Biomechanics. NeuroMuscular Research Center, Boston
University
• DeLuca, C.J. (2002) Surface Electromyography: Detection and
Recording. Delsys Incorporated.