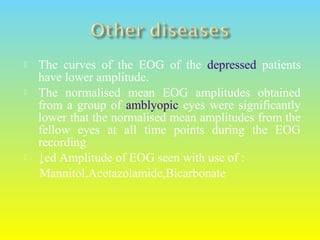
By
SATHISHKUMAR G
(sathishsak111@gmail.com)
 The clinical electro-oculogram is an
electrophysiological test of function of the outer
retina and retinal pigment epithelium in which the
change in the electrical potential between the cornea
and the fundus is recorded during successive periods
of dark and light adaptation.
 Emil du Bois-Reymond (1848) observed that the
cornea of the eye is electrically positive relative to
the back of the eye.
 Elwin Marg named the electrooculogram in 1951
and Geoffrey Arden (Arden et al. 1962) developed
the first clinical application
 The eye has a standing electrical potential between
front and back, sometimes called the corneo-fundal
potential. The potential is mainly derived from the
retinal pigment epithelium (RPE), and it changes in
response to retinal illumination
 The potential decreases for 8–10 min in darkness.
Subsequent retinal illumination causes an initial fall in
the standing potential over 60–75 s (the fast oscillation
(FO)), followed by a slow rise for 7–14 min (the light
response). These phenomena arise from ion
permeability changes across the basal RPE membrane.
 The calibration of the signal may be achieved by
having the patient look consecutively at two
different fixation points located a known angle apart
and recording the concomitant EOGs .
 By attaching skin electrodes on both sides of an eye
the potential can be measured by having the subject
move his or her eyes horizontally a set distance .
 Typical signal magnitudes range from 5-20 µV/°.
 Typically the voltage becomes a little smaller in the
dark reaching its lowest potential after about 8-12
minutes, the so-called “dark trough”.
 When the lights are turned on the potential rises,
the light rise, reaching its peak in about 10 minutes.
 When the size of the "light peak" is compared to
the "dark trough" the relative size should be about
2:1 or greater .
 A light/dark ratio of less than about 1.7 is
considered abnormal.
 Sight loss can be variable but, like other macular
problems, Best's disease threatens central vision in
one or both eyes.
 Within 5 identifiable stages, examination of the
eye discloses a distinct progression. At first and
second stages, there may be little or no effect on
sight.
 The curves of the EOG of the depressed patients
have lower amplitude.
 The normalised mean EOG amplitudes obtained
from a group of amblyopic eyes were significantly
lower that the normalised mean amplitudes from the
fellow eyes at all time points during the EOG
recording
 ↓ed Amplitude of EOG seen with use of :
Mannitol,Acetazolamide,Bicarbonate
THANK YOU

ELECTRO OCULOGRAPHY

  • 1.
  • 2.
     The clinicalelectro-oculogram is an electrophysiological test of function of the outer retina and retinal pigment epithelium in which the change in the electrical potential between the cornea and the fundus is recorded during successive periods of dark and light adaptation.
  • 3.
     Emil duBois-Reymond (1848) observed that the cornea of the eye is electrically positive relative to the back of the eye.  Elwin Marg named the electrooculogram in 1951 and Geoffrey Arden (Arden et al. 1962) developed the first clinical application
  • 4.
     The eyehas a standing electrical potential between front and back, sometimes called the corneo-fundal potential. The potential is mainly derived from the retinal pigment epithelium (RPE), and it changes in response to retinal illumination  The potential decreases for 8–10 min in darkness. Subsequent retinal illumination causes an initial fall in the standing potential over 60–75 s (the fast oscillation (FO)), followed by a slow rise for 7–14 min (the light response). These phenomena arise from ion permeability changes across the basal RPE membrane.
  • 5.
     The calibrationof the signal may be achieved by having the patient look consecutively at two different fixation points located a known angle apart and recording the concomitant EOGs .  By attaching skin electrodes on both sides of an eye the potential can be measured by having the subject move his or her eyes horizontally a set distance .  Typical signal magnitudes range from 5-20 µV/°.
  • 13.
     Typically thevoltage becomes a little smaller in the dark reaching its lowest potential after about 8-12 minutes, the so-called “dark trough”.  When the lights are turned on the potential rises, the light rise, reaching its peak in about 10 minutes.  When the size of the "light peak" is compared to the "dark trough" the relative size should be about 2:1 or greater .  A light/dark ratio of less than about 1.7 is considered abnormal.
  • 15.
     Sight losscan be variable but, like other macular problems, Best's disease threatens central vision in one or both eyes.  Within 5 identifiable stages, examination of the eye discloses a distinct progression. At first and second stages, there may be little or no effect on sight.
  • 16.
     The curvesof the EOG of the depressed patients have lower amplitude.  The normalised mean EOG amplitudes obtained from a group of amblyopic eyes were significantly lower that the normalised mean amplitudes from the fellow eyes at all time points during the EOG recording  ↓ed Amplitude of EOG seen with use of : Mannitol,Acetazolamide,Bicarbonate
  • 20.