Downloaded 1,589 times

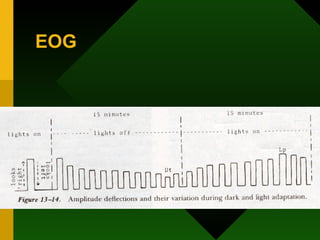
![Light sensitive – [ Light peak ] - Contributed by rods and cones B) Light insensitive – [ Dark trough ] - Contributed by RPE , Photoreceptors inner nuclear layer 2 components of EOG](https://image.slidesharecdn.com/electrodiagnostictests-091220023324-phpapp01/85/Electrodiagnostic-Tests-in-Ophthalmology-31-320.jpg)


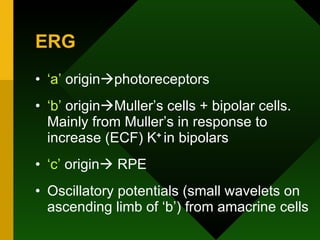
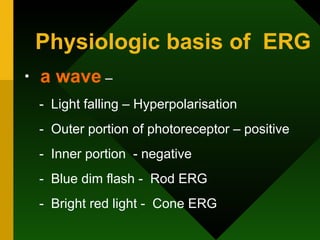
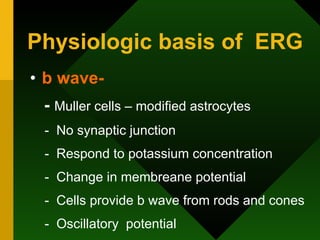
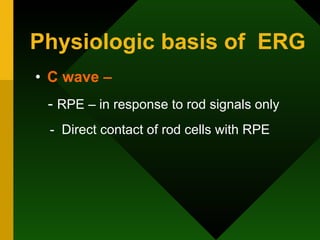
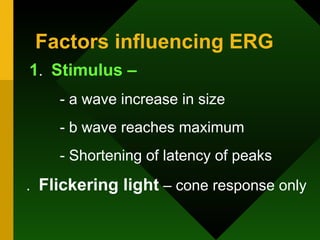
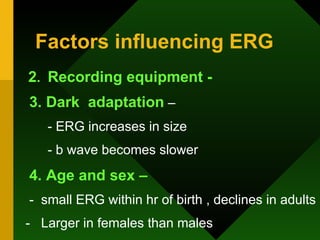
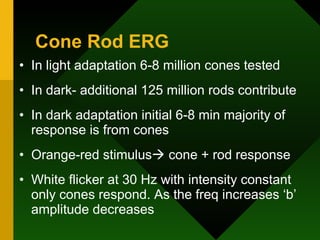
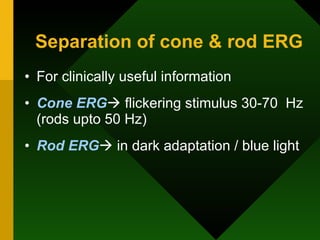
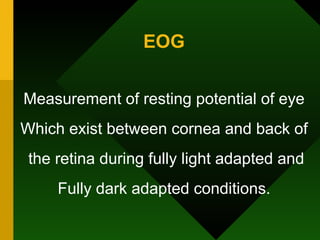
The document provides an overview of electro-diagnostic tests, specifically electroretinography (ERG), electrooculography (EOG), and visual evoked potential (VEP), detailing their physiological bases and recording protocols. It discusses the origins of ERG waveforms, clinical applications for diagnosing retinal disorders, and factors influencing test results. Additionally, it outlines the EOG's method of evaluating retinal function and the VEP's role in assessing visual system functionality beyond the retina.


