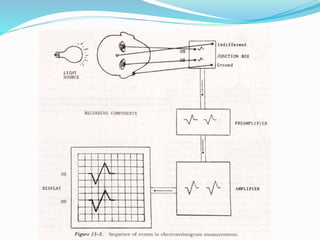
This document provides an overview of electroretinography (ERG), including:
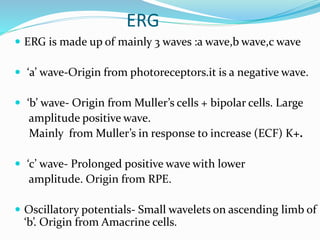
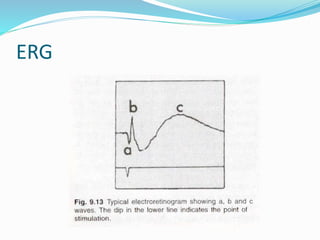
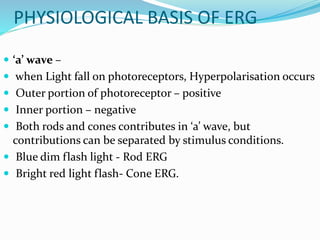
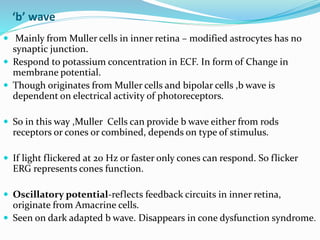
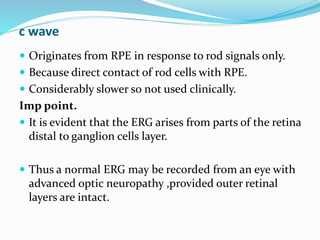
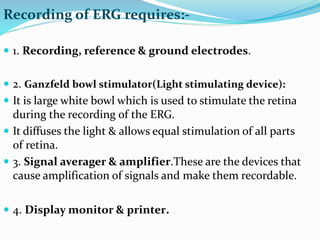
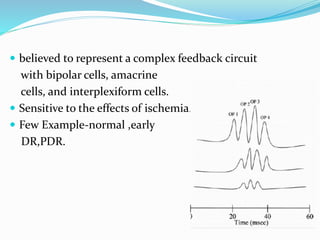
- The three main waves that make up the ERG (a, b, c waves) and their origins
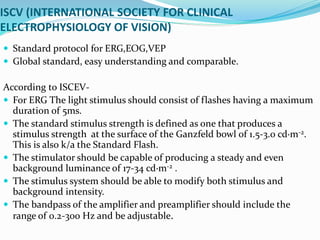
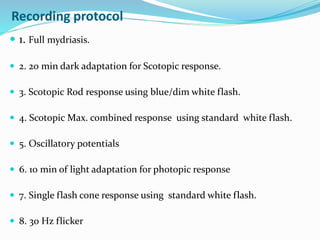
- Protocols for performing ERG based on ISCEV standards
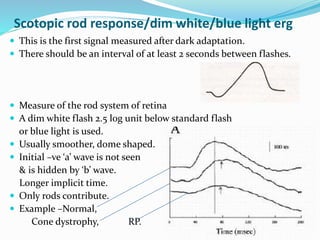
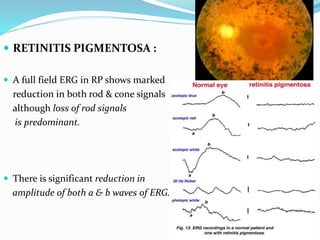
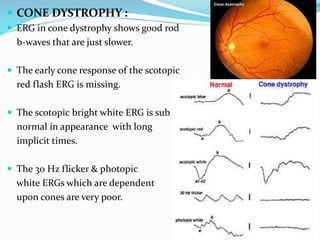
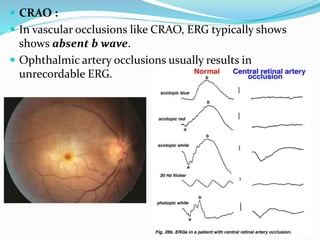
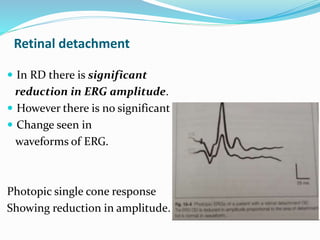
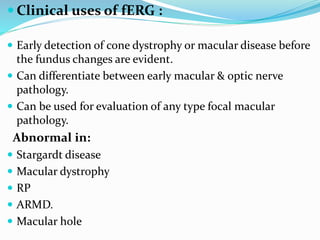
- Clinical applications of ERG for diagnosing and monitoring various retinal conditions like retinitis pigmentosa, cone dystrophy, retinal detachment, and more.
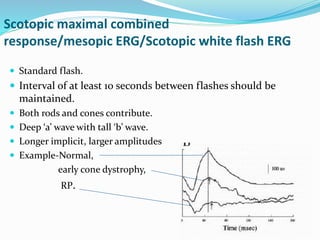
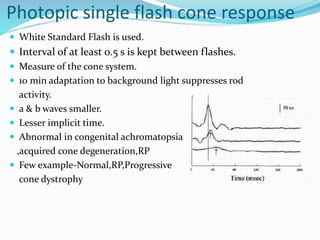
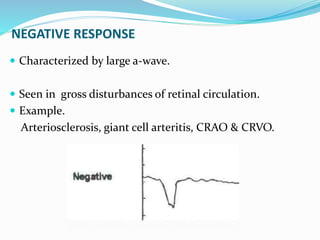
- Interpretation of normal and abnormal ERG responses.