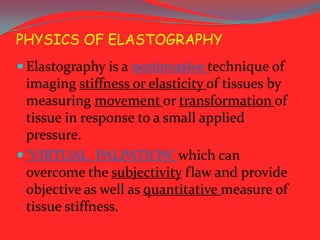
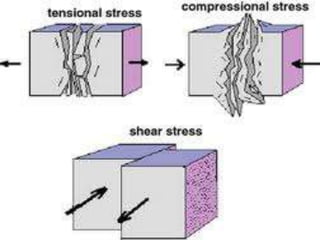
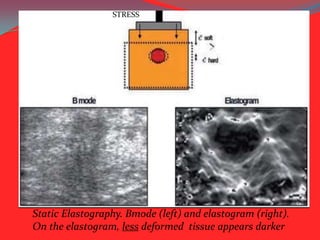
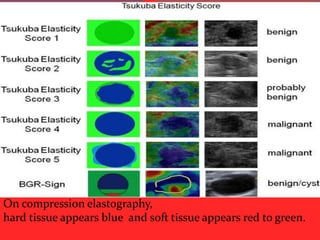
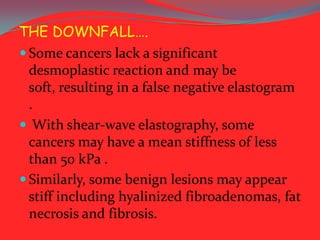
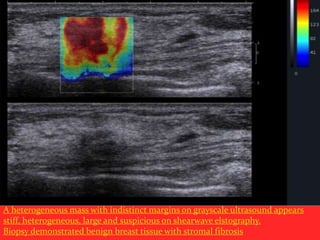
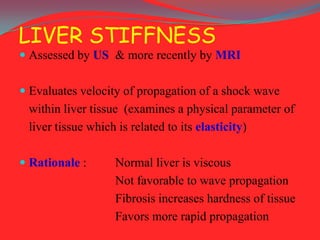
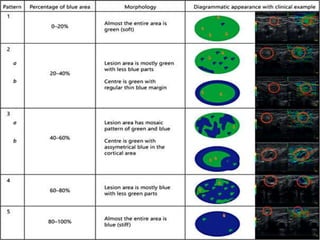
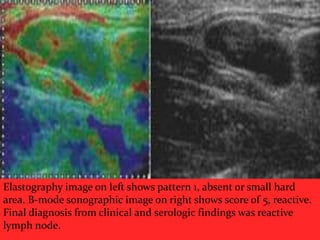
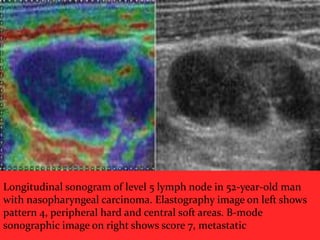
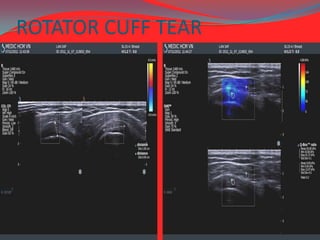
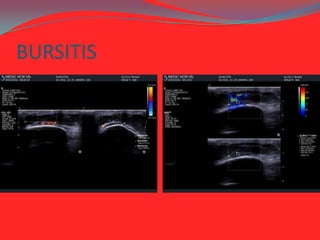
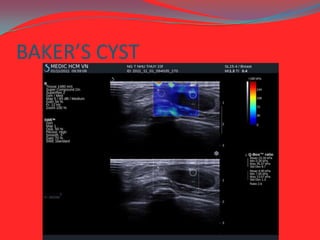
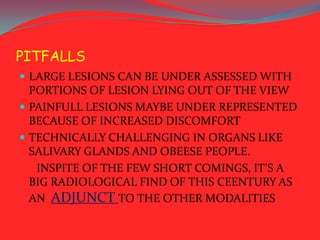
ELASTICITY FOR ME
THEY SPOILED MY CHILDHOOD..
PHYSICS OF ELASTOGRAPHY
 Elastography is a noninvasive technique of

imaging stiffness or elasticity of tissues by
measuring movement or transformation of
tissue in response to a small applied
pressure.
 ‘VIRTUAL PALPATION’ which can
overcome the subjectivity flaw and provide
objective as well as quantitative measure of
tissue stiffness.
Going back to school days….
 Stress: It is defined as force per unit area.

Unit- Pascal.
 Stress can due to: Compression-which acts
Perpendicular to the surface and causes
shortening of an object
: Shear stress which acts
parallel to the surface and causes
deformation.
DEFINITIONS…..(cont…)
 Strain: When subjected to stress an object

tends to undergo deformation of its original
size and shape; the amount of deformation is
known as strain. Unit less-expressed as change
in length per unit length of the object.
 Elasticity: It is the property of the materials to

return back to its original form after stress is
removed.
The Basics of Human Tissue
Elasticity
 Tissue stiffness is generally measured by a

physical quantity called Young’s modulus and
expressed in pressure units - Pascals or kilo
Pascals (kPa).
 The Young’s modulus is defined simply as the
ratio between the applied stress and the
induced strain.
 Young’s modulus, or elasticity E, quantifies
tissue stiffness. Hard tissues have a higher
Young’s modulus than soft ones.
TYPE OF SOFT TISSUE

YOUNG’S MODULUS –(E = s
(in kPa)
e)
18-24
28-66

FIBROUS
TISSUE

96-244

CARCINOMA

PROSTATE

NORMAL FAT
NORMAL
GLANDULAR

BREAST

22-560

NORMAL

55-71

BPH

36-41

CARCINOMA

LIVER

96-241

NORMAL

0.4-6

CIRRHOSIS

15-100
HOW EXACTLY DOES THIS CRAP
WORK??
Three step methodology:
1. Generate a low frequency vibration in tissue to induce
shear stress
2. Image the tissue with the goal of analyzing the resulting
stress
3. Deduce from this analysis a parameter related to tissue
stiffness
 If the Young’s modulus, or elasticity of the tissue, can be
determined directly from the analysis, the technique is
considered quantitative.
TYPES OF ELASTOGRAPHY
 Elastography techniques are commonly

classified according to the type of
vibration applied to the tissue. There are
three classes of Elastography :
 Static
 Dynamic and
 Shear wave based
STATIC ELASTOGRAPHY
 Static elastography uses a uniform compression at

the surface of the body to cause deformation of
the tissue.
 The compression is applied by the user and the
ultrasound scanner calculates and displays the
induced deformation in the imaging plane.
 Young’s modulus cannot be reconstructed as the
stress within the tissues induced is unknown.
STRESS

Static Elastography. Bmode (left) and elastogram (right).
On the elastogram, less deformed tissue appears darker
DYNAMIC ELASTOGRAPHY
 Dynamic elastography utilizes a continuous
(monochromatic) vibration.

 Stationary waves induced in the body are analyzed
to deduce tissue elasticity.
 Dynamic elastography is well suited for MR

systems as the vibration pattern is not time
dependent but must be assessed in a volume.
 It is a quantitative approach but suffers from the
usual MR drawbacks: high cost, limited
availability, and lack of real time imaging.
Dynamic elastography images from MRI .Displacements @
50Hz . Elasticity map (bottom right).
SHEAR WAVE ELASTOGRAPHY
 Shear wave based elastography makes use of

transient pulses to generate shear waves in
the body.
 The tissue’s elasticity is directly deduced by
measuring the speed of wave propagation.
 Shear wave based elastography is the only
approach able to provide quantitative and
local elastic information in real time
 Shear Wave Elastography uses the acoustic

radiation force induced by ultrasound
beams to perturb underlying tissues. This
pressure or “acoustic wind” pushes the
tissue in the direction of propagation.
 An elastic medium such as human tissue
will react to this push by a restoring force.
This force induces mechanical waves and,
more importantly, shear waves which
propagate transversely in the tissue.
A shear wave induced by an ultrasound beam focused
in the center of the image
ADVANCES IN SHEAR WAVE
IMAGING
 SPATIALLY MODULATED

ULTRASOUND RADIATION FORCE
(SMURFS)
 SUPERSONIC SHEAR WAVE
IMAGING
 AXIAL SHEAR STRAIN IMAGING
APPLICATIONS
 Breast Imaging
 Prostate Imaging
 Thyroid Imaging
 Liver Imaging
 Treatment Monitoring
 Intravascular Strain Imaging
 Cardiac Elastography
 Deep Vein Thrombosis
 Kidney Transplant Monitoring
BREAST IMAGING
 Compared to gray-scale

ultrasound, malignant lesions tend to be
larger and more irregular on elastography
likely secondary to stiff peripheral
desmoplastic reaction.
 When measuring lesion size on
elastography, the lesion should be measured
in the exact position on both the elastogram
and B-mode image.
Heterogeneous echo texture , irregular shape and stiff color
elastogram, which appears larger than the gray scale image.
The color scale is a measure of stiffness. In these images, red
indicates very stiff tissue, green/yellow indicates intermediate
stiffness and blue indicates low stiffness IDC
Benign lesions demonstrating : homogenoeus oval shape and very soft
elastogram, which also appears the same size on both gray-scale and shearwave elastography.. Clustered microcysts
FIBROADENOMA
COMPLEX CYST V/S SOLID
LESIONS
 Elastography has the potential to
differentiate complicated cysts form
solid masses.
 Shear-wave propagation does not occur
in cysts and therefore cysts should have
elastography values of zero and will
appear mostly black or homogeneously
blue on the color overlay elastogram
Large simple cyst which shows no elasticity within the lesion and
hence black
COMPLICATED CYST- HOMOGENEOUSLY BLUE
A bull’s eye artifact has also been described as a characteristic feature
present in benign breast cysts, where central fluid may appear bright with
a surrounding dark ring
PROBLEM SOLVING
 Elastography has the potential to downgrade BI-RADS
4a lesions to BI-RADS 3, using qualitative shear-wave

elastography and color assessment of lesion
stiffness, oval shape and a maximum elasticity value of
less than 80 kPa without a significant loss in sensitivity.
 Elastography may also be used to identify oval
circumscribed cancers detected on ultrasound and may
be used to upgrade a BI-RADS 3 lesion to BI-RADS 4.
 Furthermore, elastography feature analysis also has the
potential to downgrade BI-RADS 3 lesion to BI-RADS 2
lesions.
ADVANTAGE

Oval circumscribed hypoechoic mass on gray-scale imaging, which has
benign ultrasound features. However, elastography demonstrates a
QUANTITATIVE ASSESMENT
 Lesion stiffness can also be measured
quantitatively with shear wave elastography.
 Stiffness of malignant lesions is generally greater
than 80–100 kPa), while fat has relatively low
elasticity values near 7 kPa and breast
parenchyma have elasticity values ranging from
30-50 kPa.
 However, one must be careful when using kPa in
lesion evaluation, as some soft cancers may have
low kPA values between 20-80 kPa, similar to
benign lesions
On compression elastography,
hard tissue appears blue and soft tissue appears red to green.
THE DOWNFALL….
 Some cancers lack a significant
desmoplastic reaction and may be
soft, resulting in a false negative elastogram
.
 With shear-wave elastography, some
cancers may have a mean stiffness of less
than 50 kPa .
 Similarly, some benign lesions may appear
stiff including hyalinized fibroadenomas, fat
necrosis and fibrosis.
A heterogeneous mass with indistinct margins on grayscale ultrasound appears
stiff, heterogeneous, large and suspicious on shearwave elstography.
Biopsy demonstrated benign breast tissue with stromal fibrosis
LIVER STIFFNESS
 Assessed by US & more recently by MRI

 Evaluates velocity of propagation of a shock wave

within liver tissue (examines a physical parameter of
liver tissue which is related to its elasticity)
 Rationale :

Normal liver is viscous
Not favorable to wave propagation
Fibrosis increases hardness of tissue
Favors more rapid propagation
Liver stiffness cut-offs in chronic liver
diseases

Matavir

F0-F1

Fibrosis

Mild

F2

F3

Sign Severe

F4

Cirrhosis

LSM 2.5 – 7 kPa → Mild or absent fibrosis is likely

LSM > 12.5 kPa → Cirrhosis is likely
MR elastography
Conventional MR

Wave images at 60 Hz

MR elastography

Shorter wavelength

Normal: 1.7 kPa

Longer wavelength

Cirrhosis: 18.83 kPa

.
LSM According to different etiologies of CLD
FOCAL LIVER LESIONS

Hemangioma, elastic score (ES) =17.31kPa.
Malignant tumor, V= 3.73m/sec, elastic score = 41.76kPa.
LIMITATIONS OF US ELASTOGRAPHY
OF LIVER
 Uninterpretable results
 Acute liver injury
 Extrahepatic cholestasis
 Increased CVP
 Ascites
 Narrow intercostal spaces
OTHER APPLICATIONS IN LIVER
 Decreased stiffness post anti-viral treatment
and increased stiffness in relapse.
 Splenic stiffness > 9kPa correlates with
portal hypertension.
 To d/d between HCV and non HCV
infections in liver transplant recipients.
 Biopsy site from the stiffest region.
 Much larger liver volume assessed then
biopsy
Lymph nodes
 Mainly to d/d between benign and

malignant nodes esp. in axillary and
cervical nodes.
 Score of metastatic nodes in axilla are >
3.5
 Scores of metastatic nodes in neck > 2
 Sensitivity of > 85 % but less specificity.
Elastography image on left shows pattern 1, absent or small hard
area. B-mode sonographic image on right shows score of 5, reactive.
Final diagnosis from clinical and serologic findings was reactive
lymph node.
Longitudinal sonogram of level 5 lymph node in 52-year-old man
with nasopharyngeal carcinoma. Elastography image on left shows
pattern 4, peripheral hard and central soft areas. B-mode
sonographic image on right shows score 7, metastatic
PROSTATE
 TO DIAGNOSE PRIMARY
 TO GUIDE FOR CORE BIOPSY
 TO SEE EXTRA CAPSULAR

EXTENSION
ROTATOR CUFF TEAR
BURSITIS
BAKER’S CYST
PITFALLS
 LARGE LESIONS CAN BE UNDER ASSESSED WITH

PORTIONS OF LESION LYING OUT OF THE VIEW
 PAINFULL LESIONS MAYBE UNDER REPRESENTED
BECAUSE OF INCREASED DISCOMFORT
 TECHNICALLY CHALLENGING IN ORGANS LIKE
SALIVARY GLANDS AND OBEESE PEOPLE.
INSPITE OF THE FEW SHORT COMINGS, IT’S A
BIG RADIOLOGICAL FIND OF THIS CEENTURY AS
AN ADJUNCT TO THE OTHER MODALITIES

Elastography

  • 2.
  • 3.
    THEY SPOILED MYCHILDHOOD..
  • 4.
    PHYSICS OF ELASTOGRAPHY Elastography is a noninvasive technique of imaging stiffness or elasticity of tissues by measuring movement or transformation of tissue in response to a small applied pressure.  ‘VIRTUAL PALPATION’ which can overcome the subjectivity flaw and provide objective as well as quantitative measure of tissue stiffness.
  • 5.
    Going back toschool days….  Stress: It is defined as force per unit area. Unit- Pascal.  Stress can due to: Compression-which acts Perpendicular to the surface and causes shortening of an object : Shear stress which acts parallel to the surface and causes deformation.
  • 7.
    DEFINITIONS…..(cont…)  Strain: Whensubjected to stress an object tends to undergo deformation of its original size and shape; the amount of deformation is known as strain. Unit less-expressed as change in length per unit length of the object.  Elasticity: It is the property of the materials to return back to its original form after stress is removed.
  • 8.
    The Basics ofHuman Tissue Elasticity  Tissue stiffness is generally measured by a physical quantity called Young’s modulus and expressed in pressure units - Pascals or kilo Pascals (kPa).  The Young’s modulus is defined simply as the ratio between the applied stress and the induced strain.  Young’s modulus, or elasticity E, quantifies tissue stiffness. Hard tissues have a higher Young’s modulus than soft ones.
  • 9.
    TYPE OF SOFTTISSUE YOUNG’S MODULUS –(E = s (in kPa) e) 18-24 28-66 FIBROUS TISSUE 96-244 CARCINOMA PROSTATE NORMAL FAT NORMAL GLANDULAR BREAST 22-560 NORMAL 55-71 BPH 36-41 CARCINOMA LIVER 96-241 NORMAL 0.4-6 CIRRHOSIS 15-100
  • 10.
    HOW EXACTLY DOESTHIS CRAP WORK?? Three step methodology: 1. Generate a low frequency vibration in tissue to induce shear stress 2. Image the tissue with the goal of analyzing the resulting stress 3. Deduce from this analysis a parameter related to tissue stiffness  If the Young’s modulus, or elasticity of the tissue, can be determined directly from the analysis, the technique is considered quantitative.
  • 11.
    TYPES OF ELASTOGRAPHY Elastography techniques are commonly classified according to the type of vibration applied to the tissue. There are three classes of Elastography :  Static  Dynamic and  Shear wave based
  • 12.
    STATIC ELASTOGRAPHY  Staticelastography uses a uniform compression at the surface of the body to cause deformation of the tissue.  The compression is applied by the user and the ultrasound scanner calculates and displays the induced deformation in the imaging plane.  Young’s modulus cannot be reconstructed as the stress within the tissues induced is unknown.
  • 13.
    STRESS Static Elastography. Bmode(left) and elastogram (right). On the elastogram, less deformed tissue appears darker
  • 14.
    DYNAMIC ELASTOGRAPHY  Dynamicelastography utilizes a continuous (monochromatic) vibration.  Stationary waves induced in the body are analyzed to deduce tissue elasticity.  Dynamic elastography is well suited for MR systems as the vibration pattern is not time dependent but must be assessed in a volume.  It is a quantitative approach but suffers from the usual MR drawbacks: high cost, limited availability, and lack of real time imaging.
  • 15.
    Dynamic elastography imagesfrom MRI .Displacements @ 50Hz . Elasticity map (bottom right).
  • 16.
    SHEAR WAVE ELASTOGRAPHY Shear wave based elastography makes use of transient pulses to generate shear waves in the body.  The tissue’s elasticity is directly deduced by measuring the speed of wave propagation.  Shear wave based elastography is the only approach able to provide quantitative and local elastic information in real time
  • 17.
     Shear WaveElastography uses the acoustic radiation force induced by ultrasound beams to perturb underlying tissues. This pressure or “acoustic wind” pushes the tissue in the direction of propagation.  An elastic medium such as human tissue will react to this push by a restoring force. This force induces mechanical waves and, more importantly, shear waves which propagate transversely in the tissue.
  • 18.
    A shear waveinduced by an ultrasound beam focused in the center of the image
  • 19.
    ADVANCES IN SHEARWAVE IMAGING  SPATIALLY MODULATED ULTRASOUND RADIATION FORCE (SMURFS)  SUPERSONIC SHEAR WAVE IMAGING  AXIAL SHEAR STRAIN IMAGING
  • 20.
    APPLICATIONS  Breast Imaging Prostate Imaging  Thyroid Imaging  Liver Imaging  Treatment Monitoring  Intravascular Strain Imaging  Cardiac Elastography  Deep Vein Thrombosis  Kidney Transplant Monitoring
  • 21.
    BREAST IMAGING  Comparedto gray-scale ultrasound, malignant lesions tend to be larger and more irregular on elastography likely secondary to stiff peripheral desmoplastic reaction.  When measuring lesion size on elastography, the lesion should be measured in the exact position on both the elastogram and B-mode image.
  • 22.
    Heterogeneous echo texture, irregular shape and stiff color elastogram, which appears larger than the gray scale image. The color scale is a measure of stiffness. In these images, red indicates very stiff tissue, green/yellow indicates intermediate stiffness and blue indicates low stiffness IDC
  • 24.
    Benign lesions demonstrating: homogenoeus oval shape and very soft elastogram, which also appears the same size on both gray-scale and shearwave elastography.. Clustered microcysts
  • 25.
  • 26.
    COMPLEX CYST V/SSOLID LESIONS  Elastography has the potential to differentiate complicated cysts form solid masses.  Shear-wave propagation does not occur in cysts and therefore cysts should have elastography values of zero and will appear mostly black or homogeneously blue on the color overlay elastogram
  • 27.
    Large simple cystwhich shows no elasticity within the lesion and hence black
  • 28.
  • 29.
    A bull’s eyeartifact has also been described as a characteristic feature present in benign breast cysts, where central fluid may appear bright with a surrounding dark ring
  • 30.
    PROBLEM SOLVING  Elastographyhas the potential to downgrade BI-RADS 4a lesions to BI-RADS 3, using qualitative shear-wave elastography and color assessment of lesion stiffness, oval shape and a maximum elasticity value of less than 80 kPa without a significant loss in sensitivity.  Elastography may also be used to identify oval circumscribed cancers detected on ultrasound and may be used to upgrade a BI-RADS 3 lesion to BI-RADS 4.  Furthermore, elastography feature analysis also has the potential to downgrade BI-RADS 3 lesion to BI-RADS 2 lesions.
  • 31.
    ADVANTAGE Oval circumscribed hypoechoicmass on gray-scale imaging, which has benign ultrasound features. However, elastography demonstrates a
  • 32.
    QUANTITATIVE ASSESMENT  Lesionstiffness can also be measured quantitatively with shear wave elastography.  Stiffness of malignant lesions is generally greater than 80–100 kPa), while fat has relatively low elasticity values near 7 kPa and breast parenchyma have elasticity values ranging from 30-50 kPa.  However, one must be careful when using kPa in lesion evaluation, as some soft cancers may have low kPA values between 20-80 kPa, similar to benign lesions
  • 33.
    On compression elastography, hardtissue appears blue and soft tissue appears red to green.
  • 34.
    THE DOWNFALL….  Somecancers lack a significant desmoplastic reaction and may be soft, resulting in a false negative elastogram .  With shear-wave elastography, some cancers may have a mean stiffness of less than 50 kPa .  Similarly, some benign lesions may appear stiff including hyalinized fibroadenomas, fat necrosis and fibrosis.
  • 35.
    A heterogeneous masswith indistinct margins on grayscale ultrasound appears stiff, heterogeneous, large and suspicious on shearwave elstography. Biopsy demonstrated benign breast tissue with stromal fibrosis
  • 36.
    LIVER STIFFNESS  Assessedby US & more recently by MRI  Evaluates velocity of propagation of a shock wave within liver tissue (examines a physical parameter of liver tissue which is related to its elasticity)  Rationale : Normal liver is viscous Not favorable to wave propagation Fibrosis increases hardness of tissue Favors more rapid propagation
  • 37.
    Liver stiffness cut-offsin chronic liver diseases Matavir F0-F1 Fibrosis Mild F2 F3 Sign Severe F4 Cirrhosis LSM 2.5 – 7 kPa → Mild or absent fibrosis is likely LSM > 12.5 kPa → Cirrhosis is likely
  • 38.
    MR elastography Conventional MR Waveimages at 60 Hz MR elastography Shorter wavelength Normal: 1.7 kPa Longer wavelength Cirrhosis: 18.83 kPa .
  • 39.
    LSM According todifferent etiologies of CLD
  • 40.
    FOCAL LIVER LESIONS Hemangioma,elastic score (ES) =17.31kPa.
  • 41.
    Malignant tumor, V=3.73m/sec, elastic score = 41.76kPa.
  • 42.
    LIMITATIONS OF USELASTOGRAPHY OF LIVER  Uninterpretable results  Acute liver injury  Extrahepatic cholestasis  Increased CVP  Ascites  Narrow intercostal spaces
  • 43.
    OTHER APPLICATIONS INLIVER  Decreased stiffness post anti-viral treatment and increased stiffness in relapse.  Splenic stiffness > 9kPa correlates with portal hypertension.  To d/d between HCV and non HCV infections in liver transplant recipients.  Biopsy site from the stiffest region.  Much larger liver volume assessed then biopsy
  • 44.
    Lymph nodes  Mainlyto d/d between benign and malignant nodes esp. in axillary and cervical nodes.  Score of metastatic nodes in axilla are > 3.5  Scores of metastatic nodes in neck > 2  Sensitivity of > 85 % but less specificity.
  • 46.
    Elastography image onleft shows pattern 1, absent or small hard area. B-mode sonographic image on right shows score of 5, reactive. Final diagnosis from clinical and serologic findings was reactive lymph node.
  • 47.
    Longitudinal sonogram oflevel 5 lymph node in 52-year-old man with nasopharyngeal carcinoma. Elastography image on left shows pattern 4, peripheral hard and central soft areas. B-mode sonographic image on right shows score 7, metastatic
  • 48.
    PROSTATE  TO DIAGNOSEPRIMARY  TO GUIDE FOR CORE BIOPSY  TO SEE EXTRA CAPSULAR EXTENSION
  • 49.
  • 50.
  • 51.
  • 52.
    PITFALLS  LARGE LESIONSCAN BE UNDER ASSESSED WITH PORTIONS OF LESION LYING OUT OF THE VIEW  PAINFULL LESIONS MAYBE UNDER REPRESENTED BECAUSE OF INCREASED DISCOMFORT  TECHNICALLY CHALLENGING IN ORGANS LIKE SALIVARY GLANDS AND OBEESE PEOPLE. INSPITE OF THE FEW SHORT COMINGS, IT’S A BIG RADIOLOGICAL FIND OF THIS CEENTURY AS AN ADJUNCT TO THE OTHER MODALITIES