Downloaded 143 times


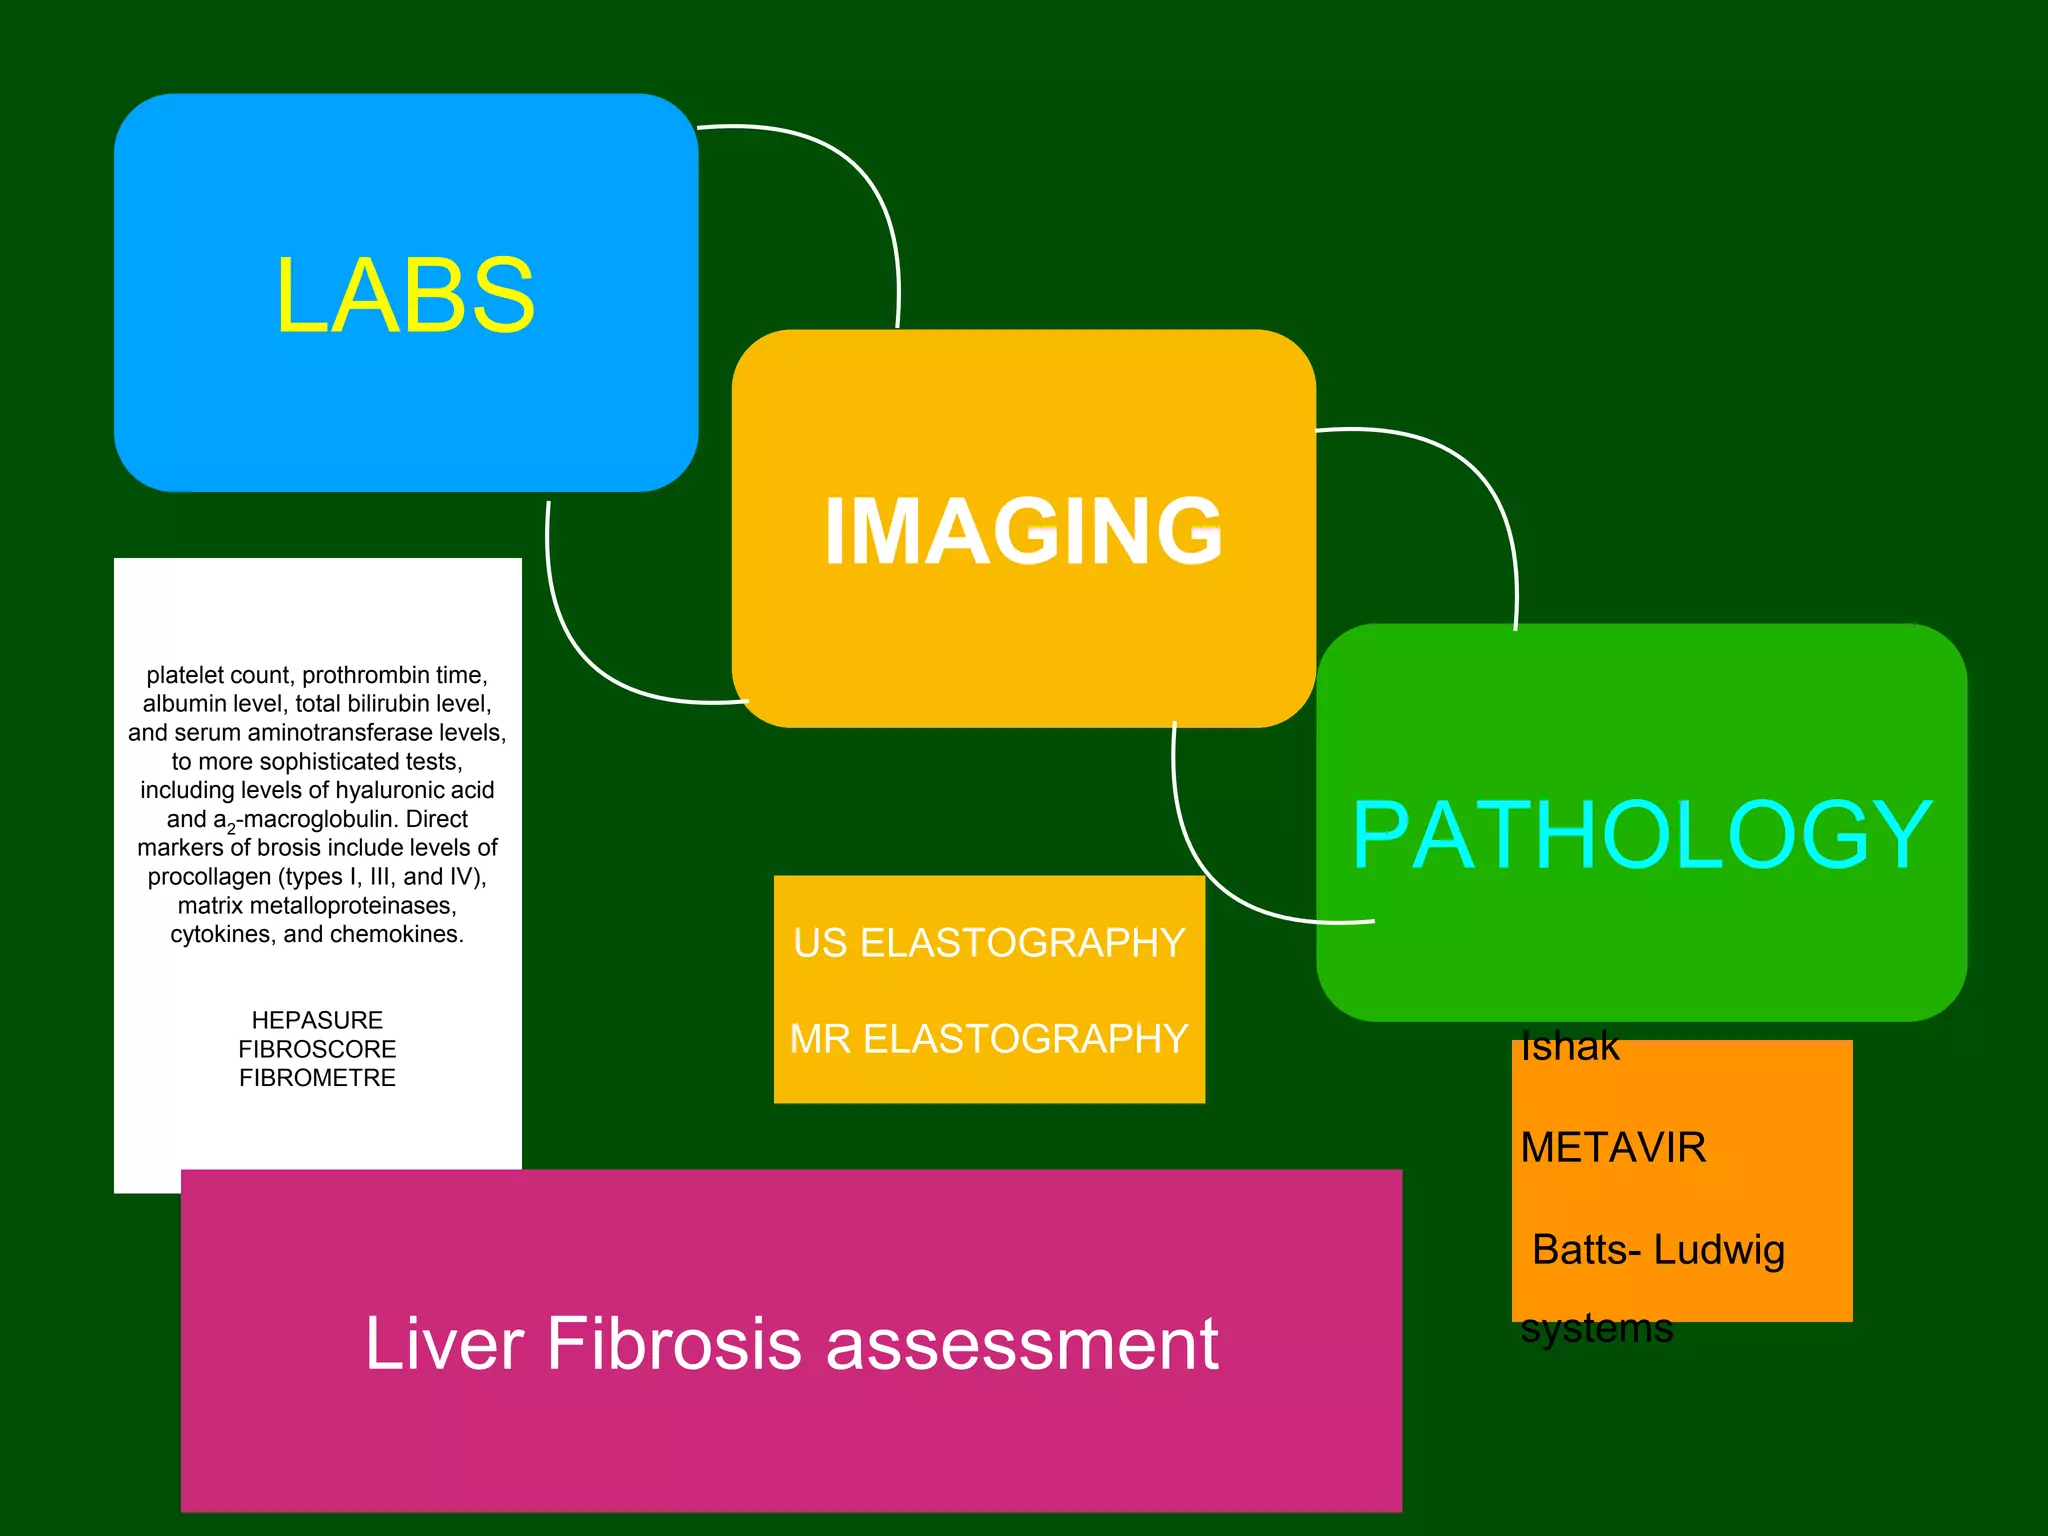


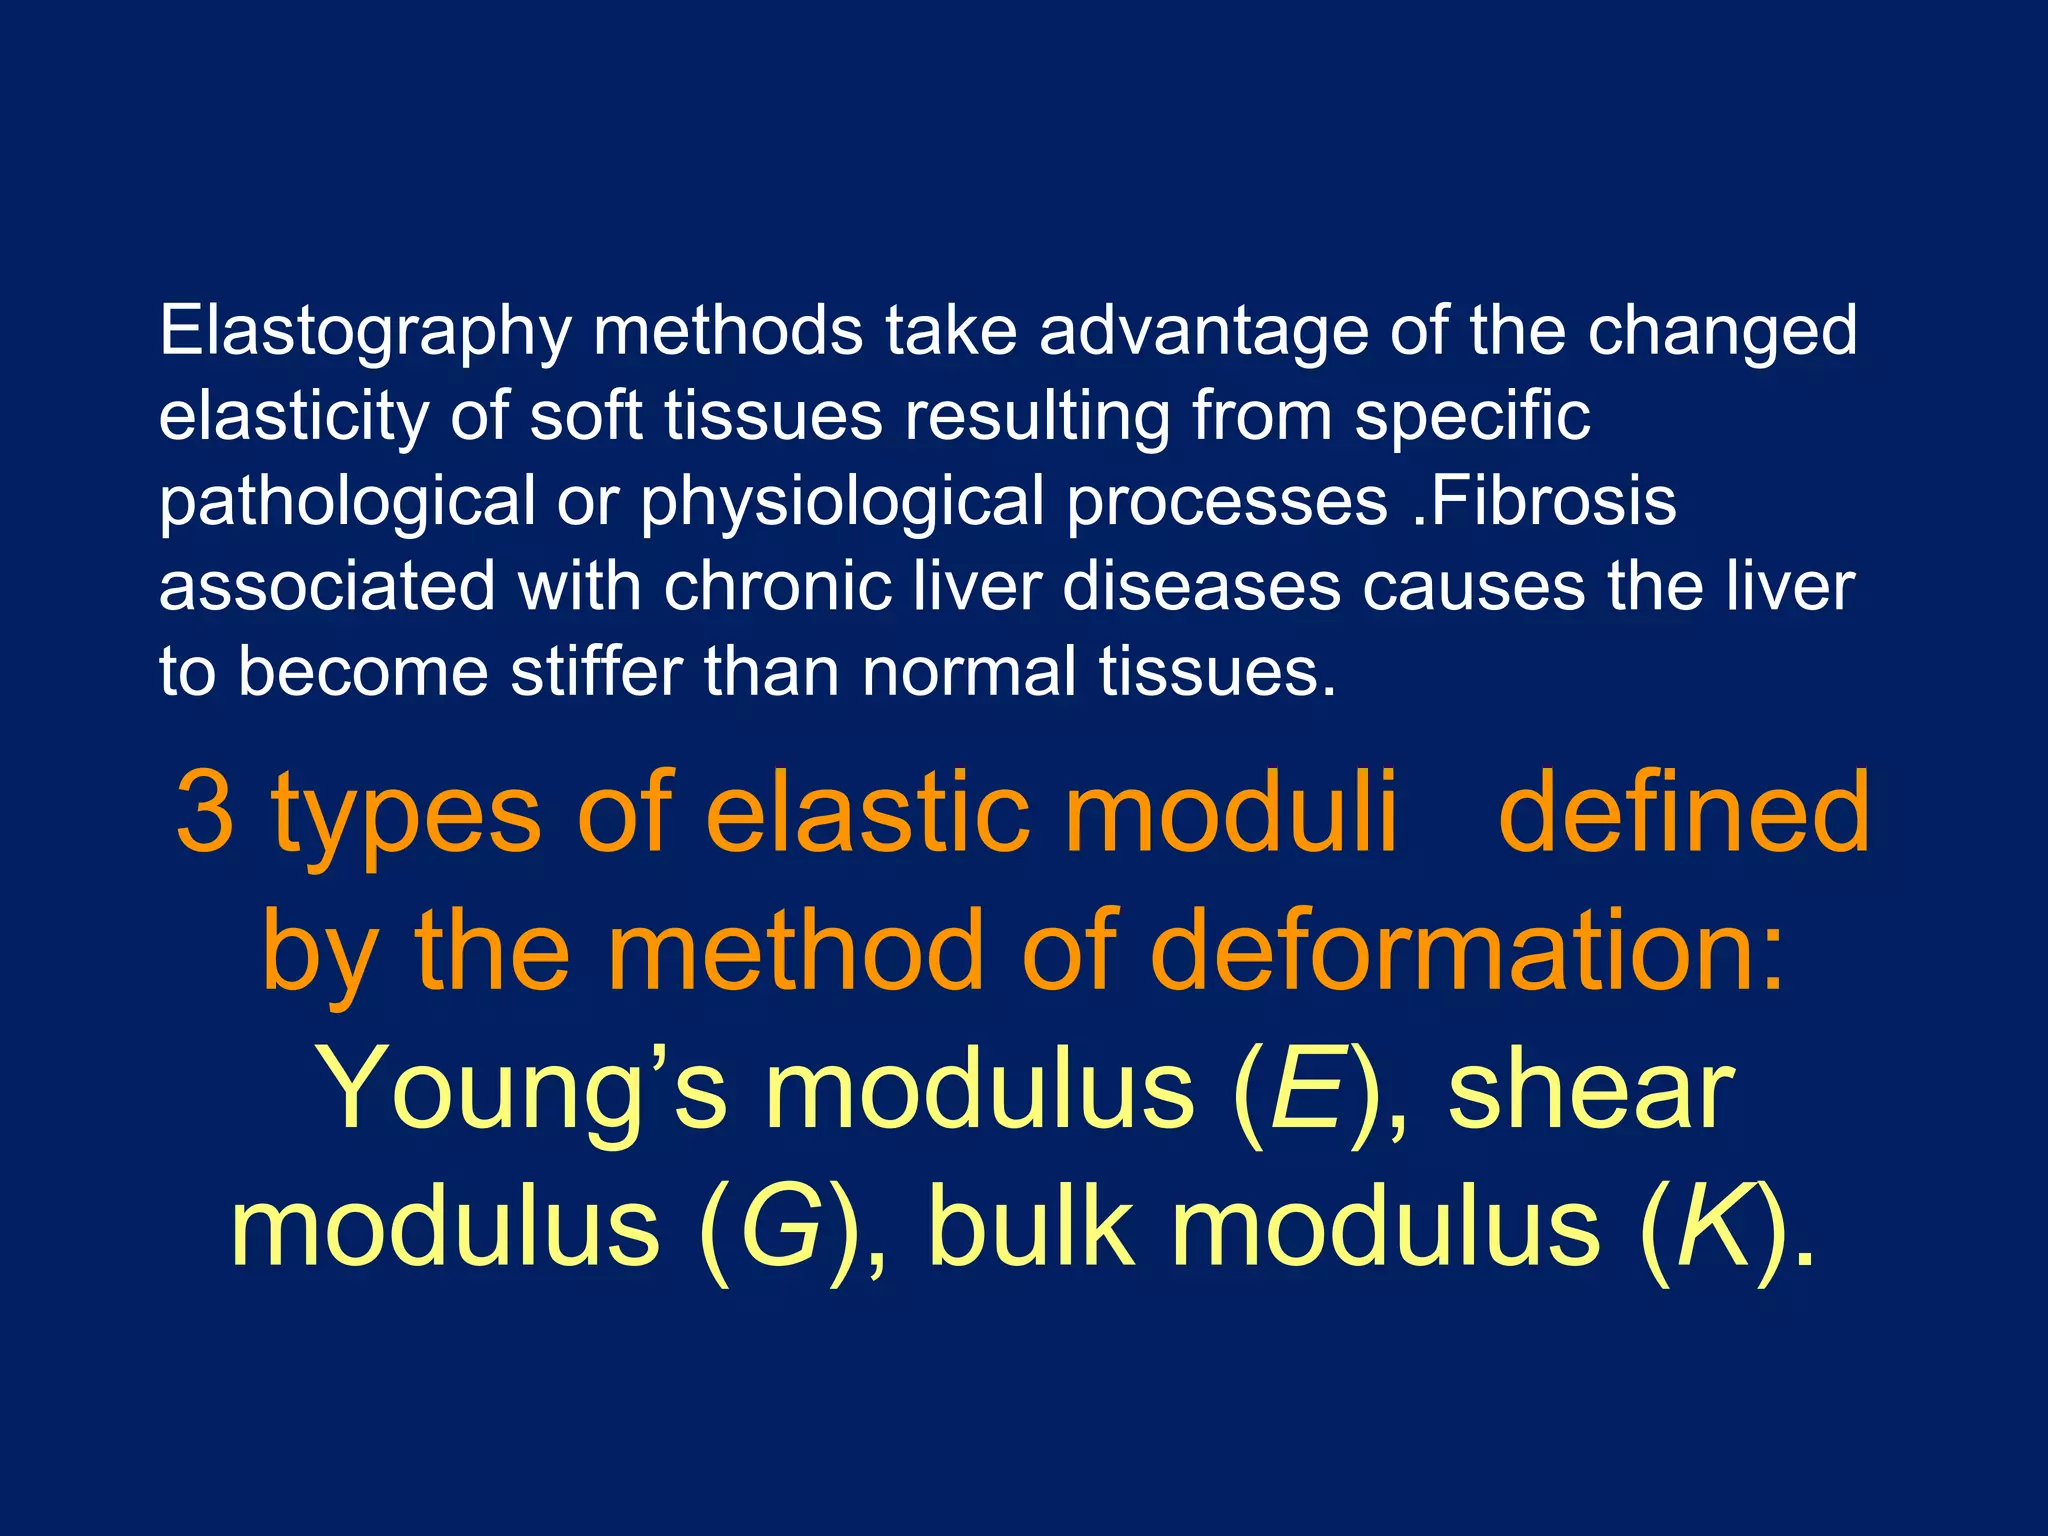


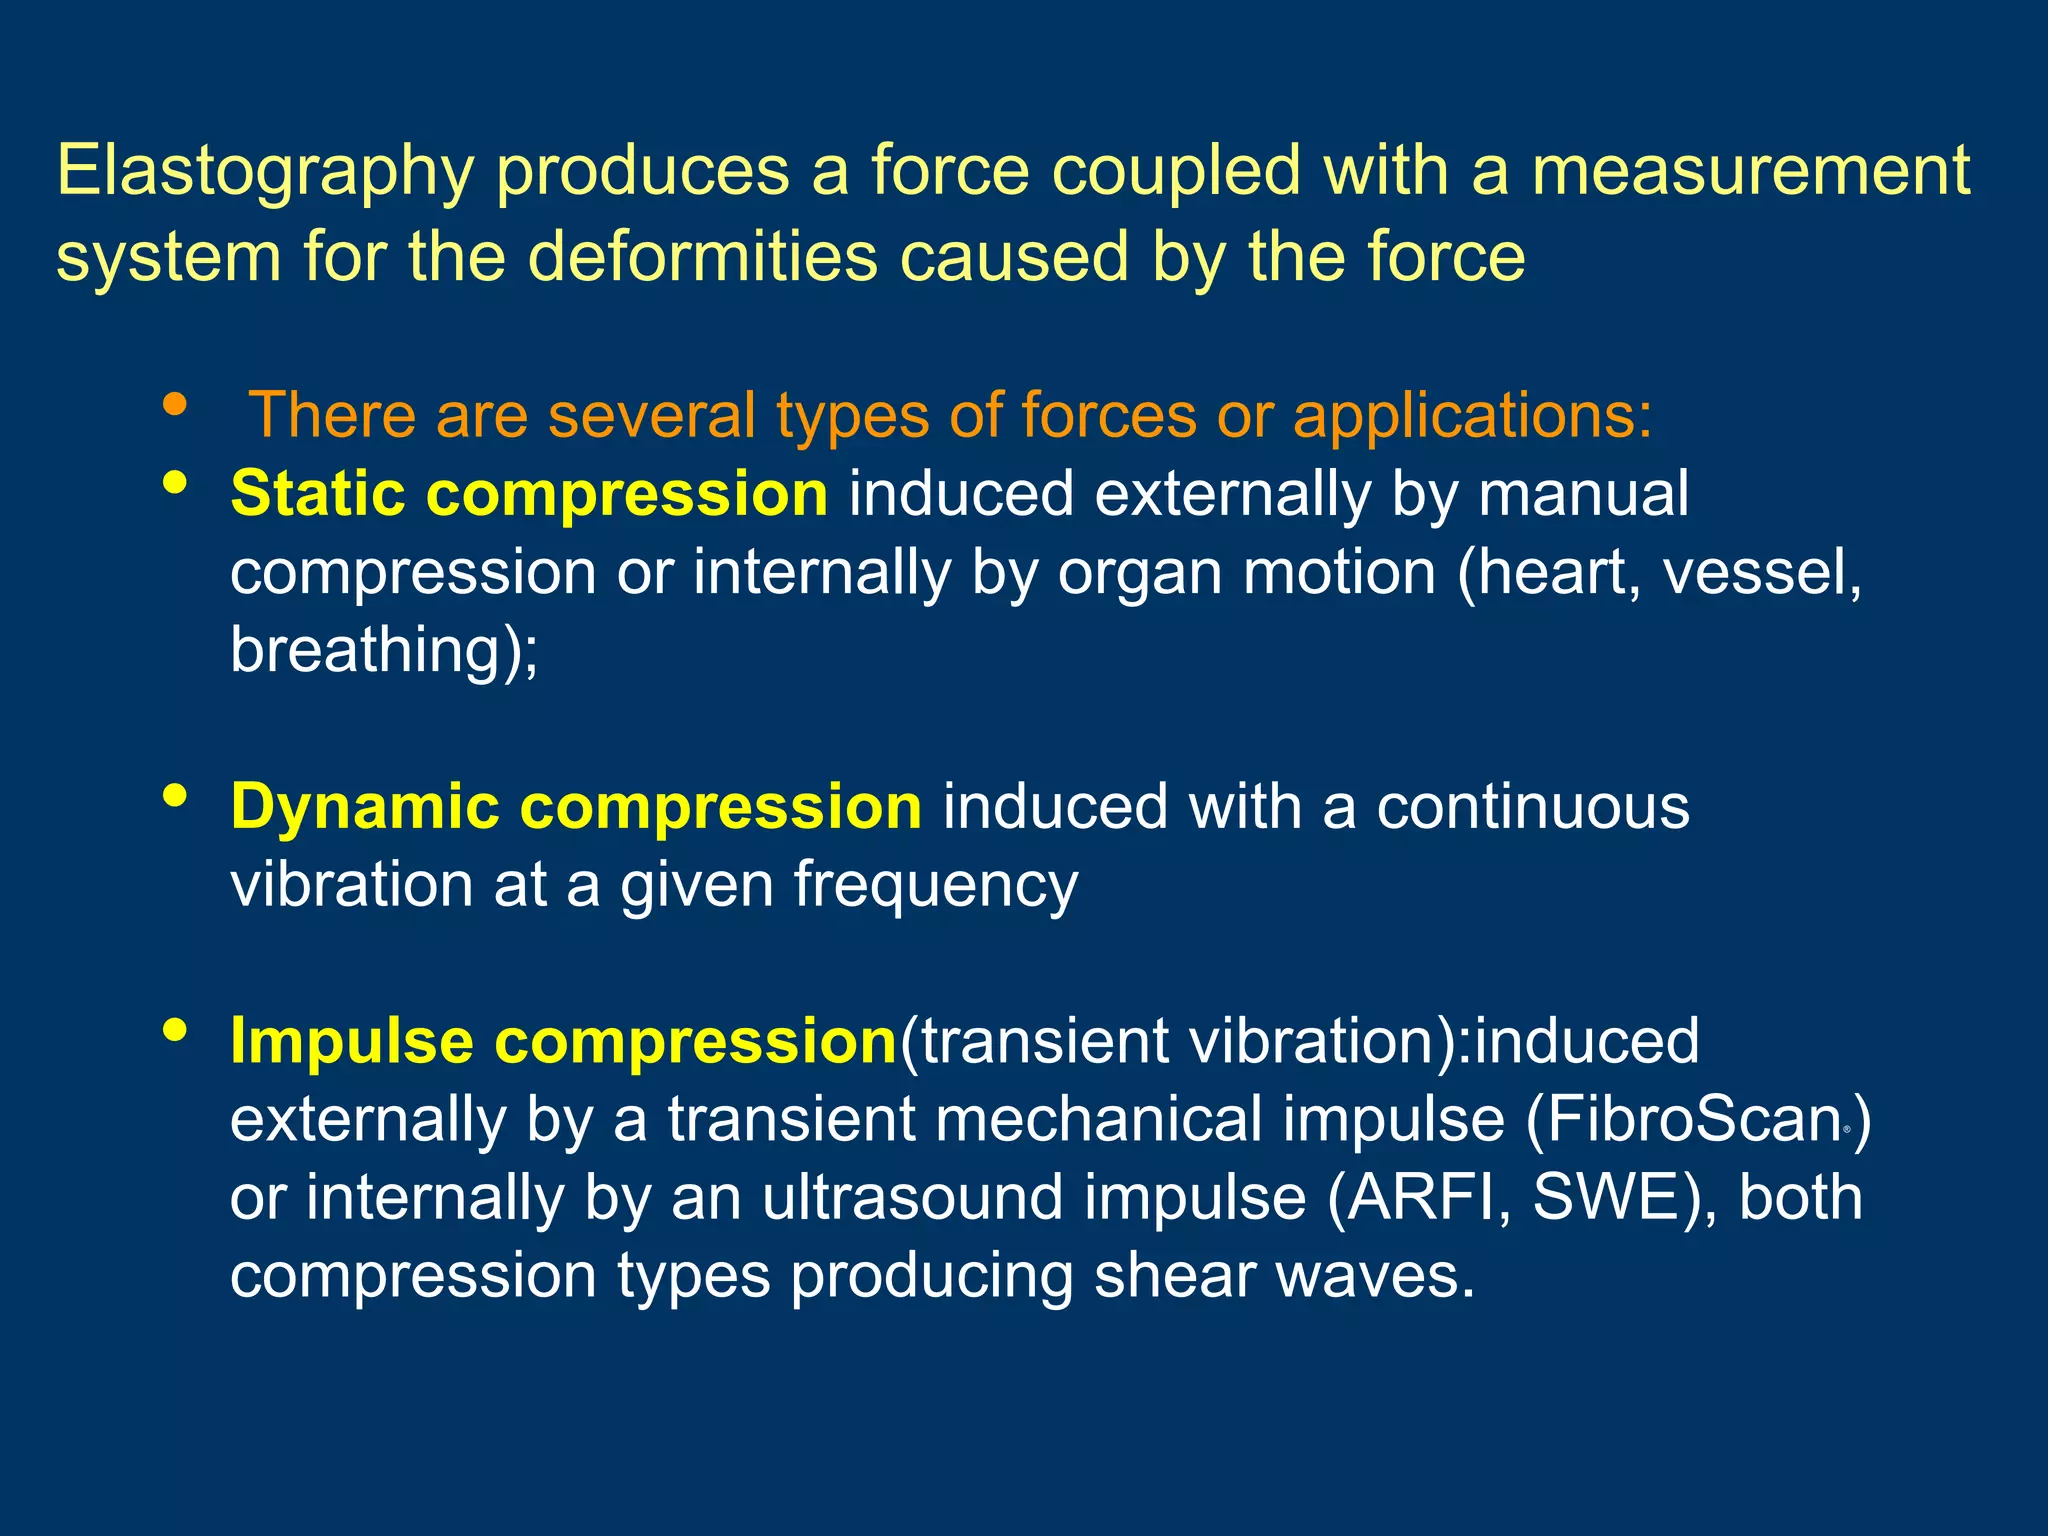
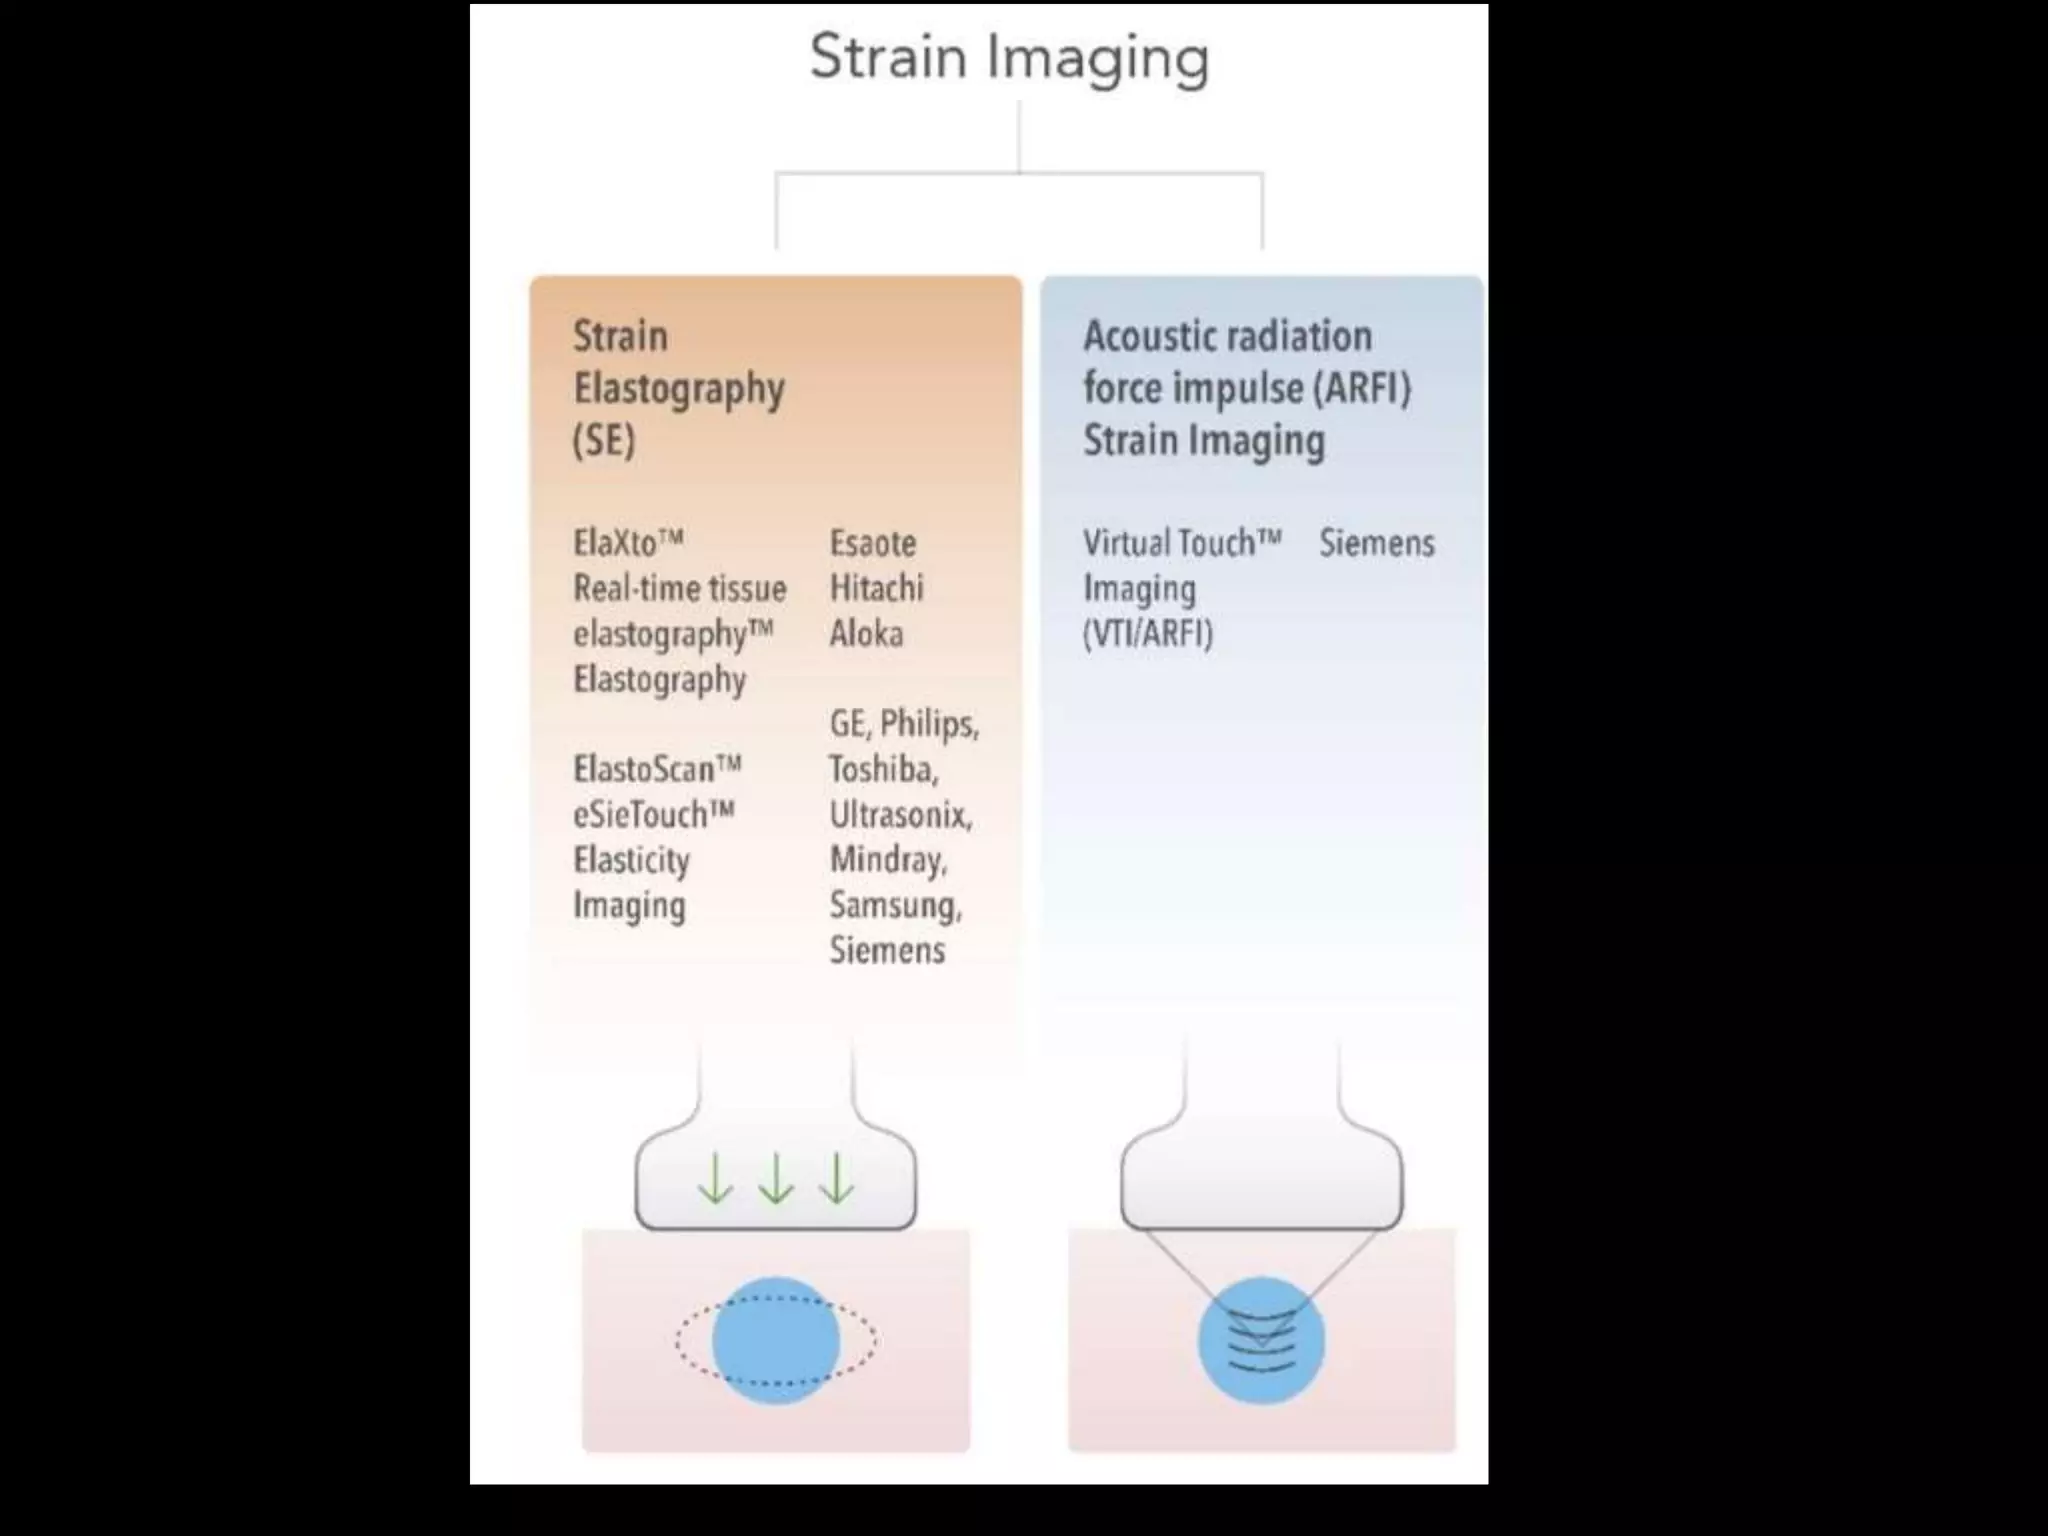


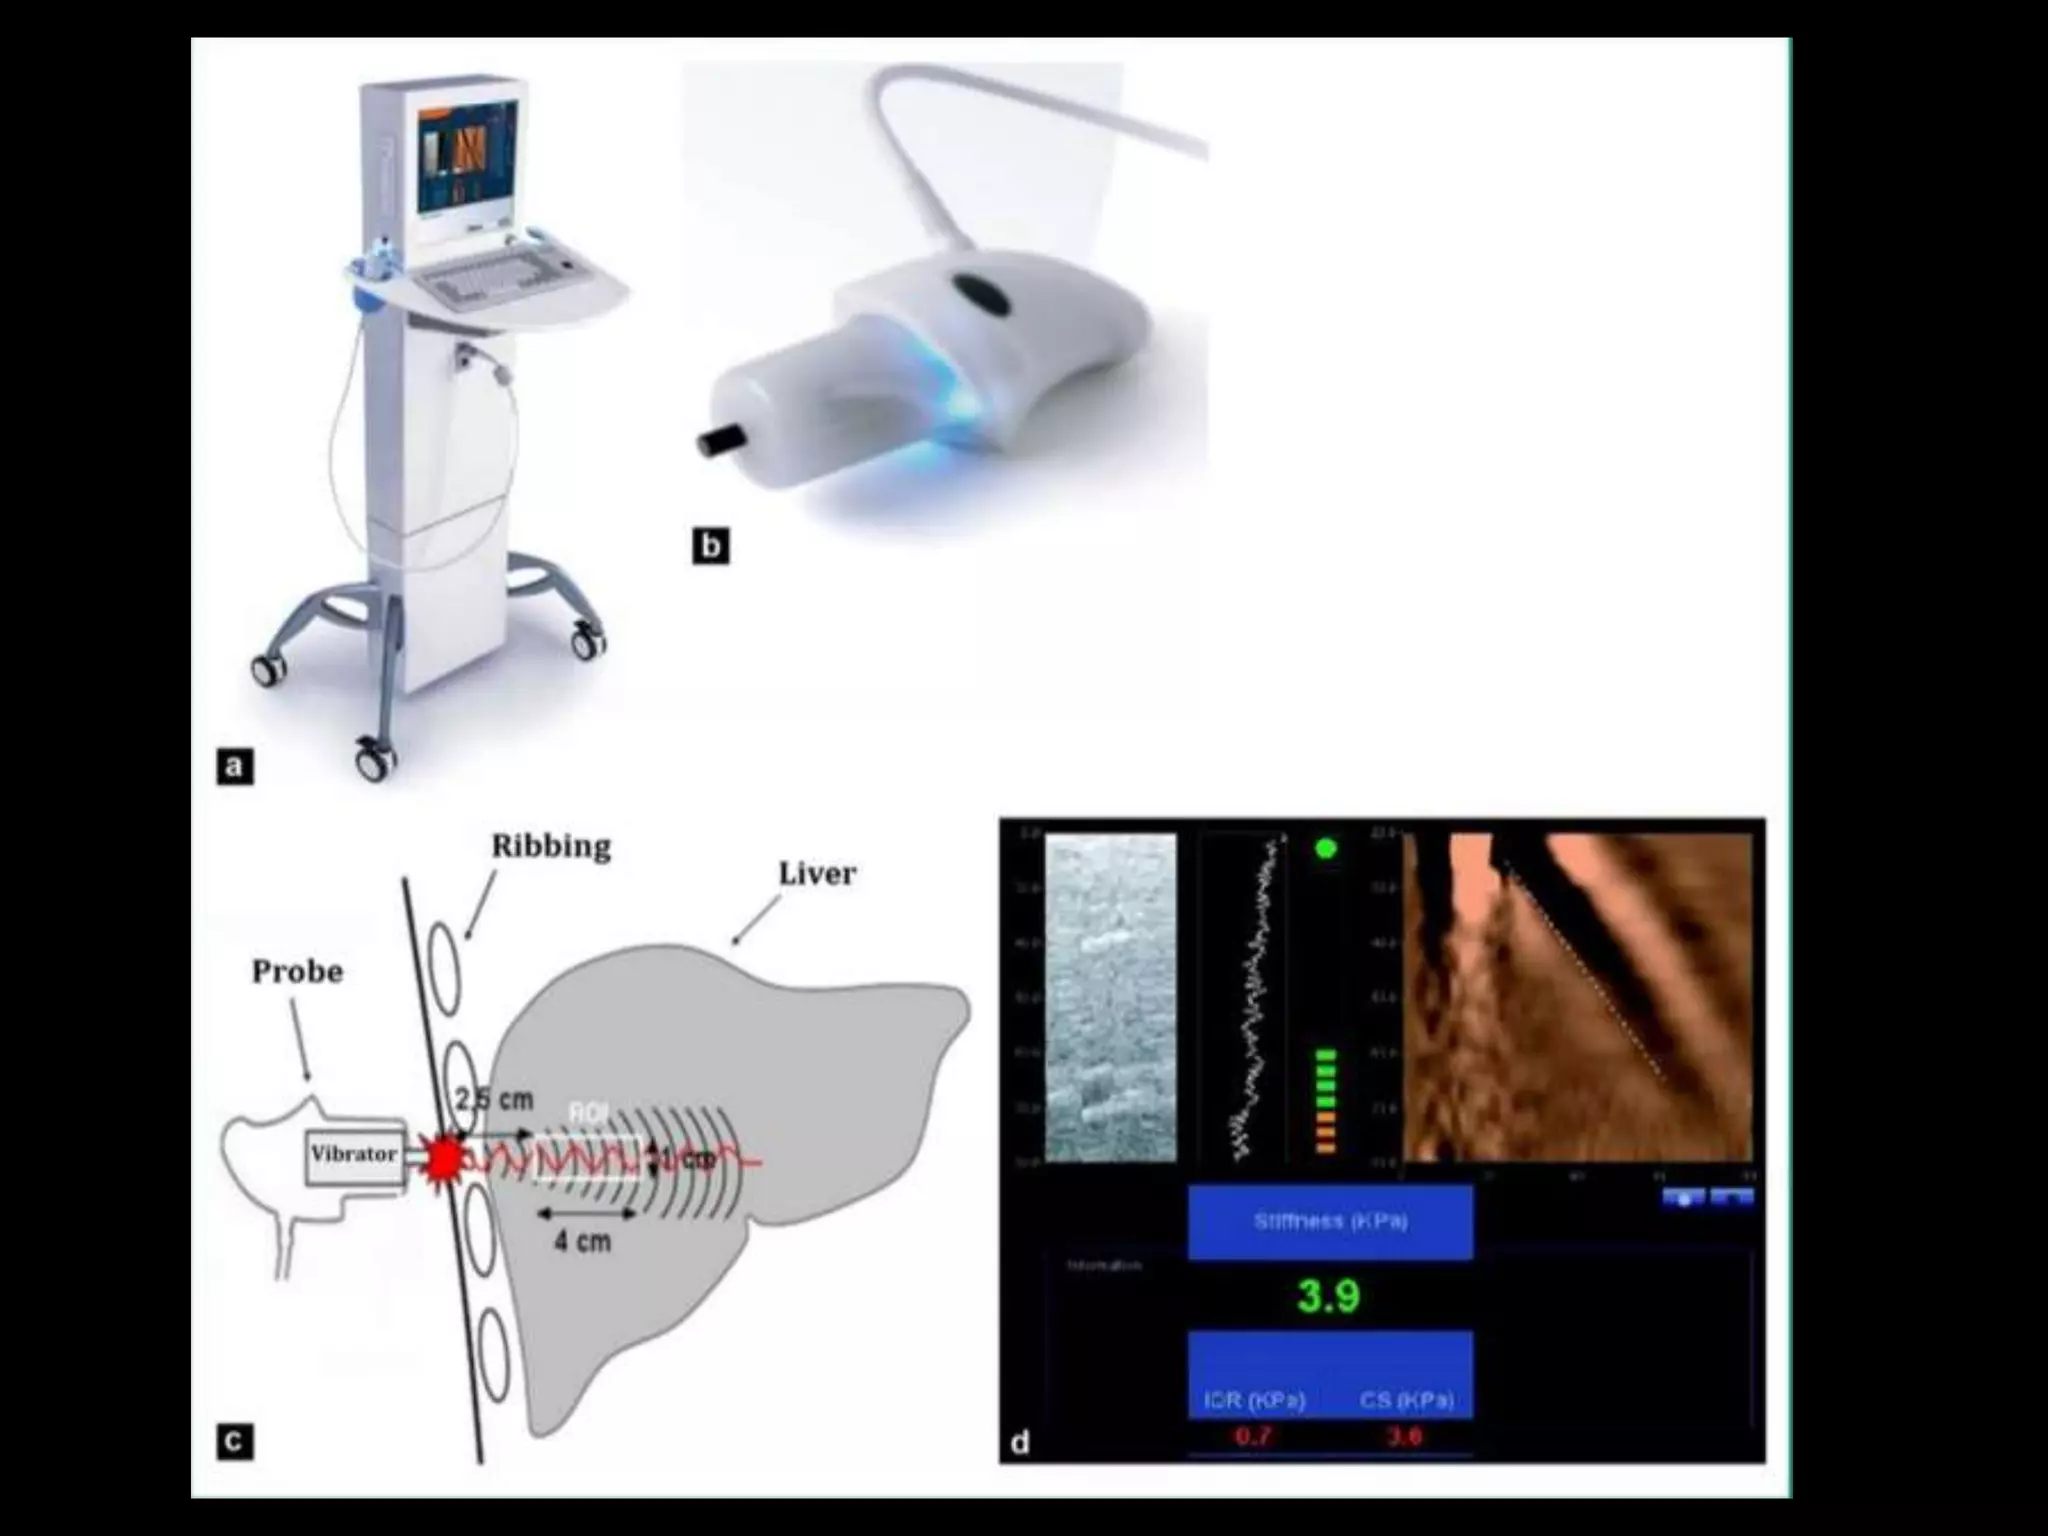


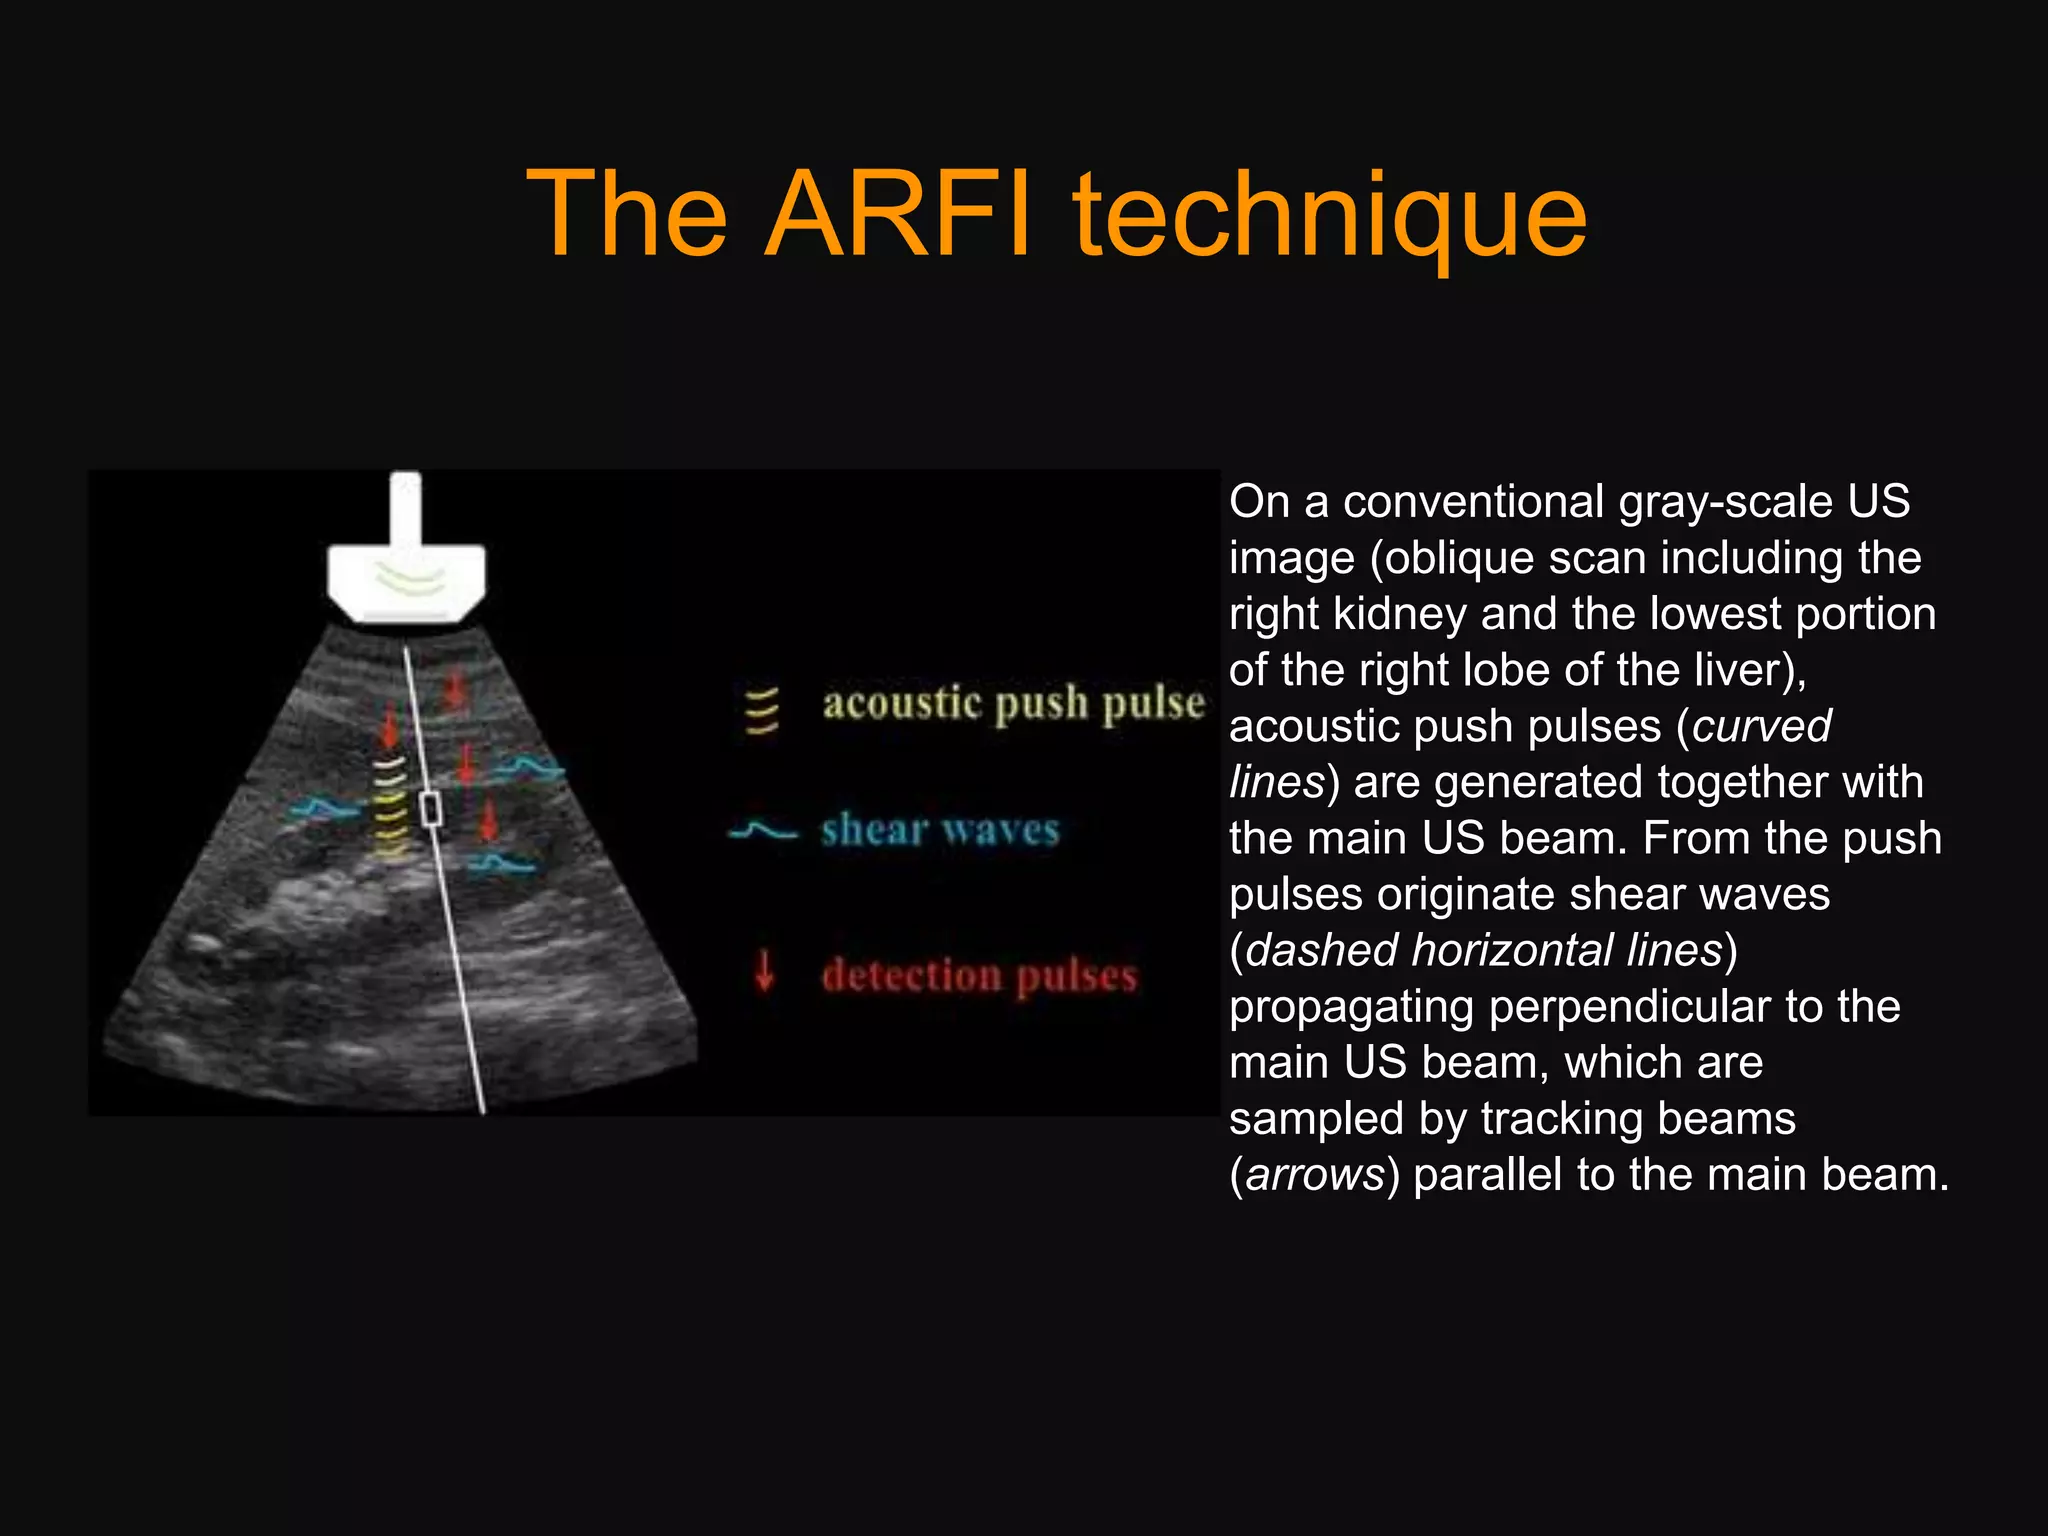


The document discusses ultrasound elastography, a technique used to assess tissue stiffness and liver fibrosis through various methods such as transient elastography and shear wave elastography. It highlights the principles of elasticity and the different forms of elastography used to measure mechanical properties of tissues, especially in the context of chronic liver diseases. Clinical applications include staging liver fibrosis, monitoring treatment response, and the importance of accurate imaging techniques in diagnosing liver conditions.


