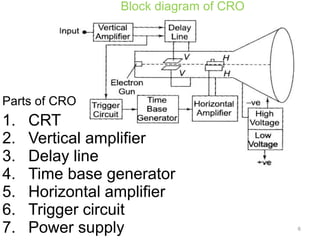
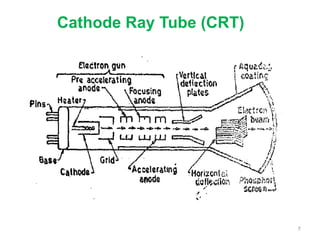
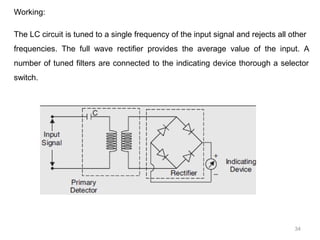
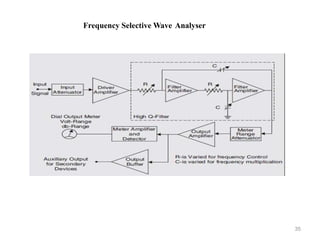
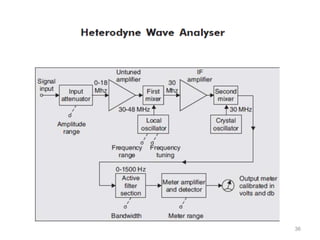
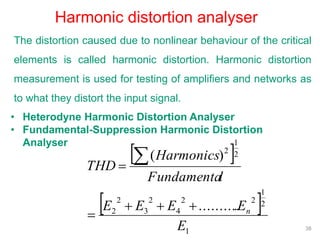
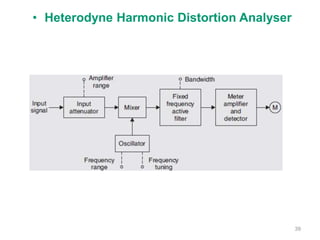
SlideShare a Scribd company logo
Unit-2
CATHODE RAY OSCILLOSCOPE &
SIGNAL ANALYZERS
EI8692 Electronic Instrumentation
Dr. T. Babu
Prof & Head
Department of ICE
St. Joseph’s College of Engineering
Unit II Syllabus
• General purpose cathode ray oscilloscope
• Dual trace, dual beam
• sampling oscilloscopes
• Analog and digital storage oscilloscope
• wave analyser – frequency selective and
heterodyne
• Harmonic distortion analyser
• Spectrum analyzer.
2
Books
• TEXT BOOKS:
• A.D. Helfrick and W.D. Cooper, Modern Electronic Instrumentation and
Measurement Techniques, Prentice Hall India Private Ltd., New Delhi, 2010.
• David A Bell, “ Electronic Instrumentation and Measurements”, Ox for
University Press, 2013.
• Jerome J., Virtual Instrumentation using Lab VIEW, Prentice Hall India Private
Ltd., New Delhi,2010
.
REFERENCES:
• H.S. Kalsi, Electronic Instrumentation, Tata McGraw-Hill, New Delhi, 2010.
• J.J. Carr, Elements of Electronic Instrumentation and Measurement, Pearson
Education India, New Delhi, 2011.
• M.M.S. Anand, Electronics Instruments and Instrumentation Technology,
Prentice Hall India, New Delhi, 2009.
• Sanjay Gupta, Virtual Instrumentation using Lab view, Tata McGraw-Hill
Education, 2010. 3
Cathode Ray Oscilloscope
(CRO)
• Used to
– Display and analyze the waveforms
– Measurement (Voltage, phase angle, frequency)
– Display the waveform with respect to time
– Compare two waveforms (Dual Oscilloscope)
4
Types
 Dual beam- Dual Trace CRO
• Sampling oscilloscope
• Storage oscilloscope
Analog
Digital
5
6
Block diagram of CRO
1. CRT
2. Vertical amplifier
3. Delay line
4. Time base generator
5. Horizontal amplifier
6. Trigger circuit
7. Power supply
Parts of CRO
7
Cathode Ray Tube (CRT)
8
A cathode ray tube (CRT) contains four basic parts:
• Electron gun – (Produces sharply focussed electron beam)
Cathode
Accelerating anode
Focusing Anode
• Deflecting systems
Vertical
Horizontal
• evacuated glass envelope with a phosphorescent screen
that glows visibly when struck by the electron beam.
9
Deflection Plates:
Vertical
Horizontal
Time base Generators (sawtooth wave ) - Horizontal
CRO is used to display the signals with respect to
time, hence it requires a horizontal constant velocity beam.
A deflecting voltage linearly increase and rapidly
decrease called Sawtooth. (Sweep)
10
Vertical Deflection plates
it’s the principal factor of sensitivity and bandwidth
• V/div
• Bandwidth (range of frequencies that can be accurately
reproduced on the CRT screen).
Screen
Inner side of CRT screen – Phosphor (P31)- green
Phosphor material decides the colour of the beam
CRT graticule – grid of lines on the scale when making
measurements of time and amplitude of any signal.
Aquadag:
A layer pasted inside the CRT, to collect the secondary
emitted electrons.
11
Applications of CRO
• Measurement of Voltage and current
• Measurement of phase and frequency (Lissajous Pattern)
When sinusoidal voltages applied to both vertical and horizontal
plate simultaneously
.Measurement of Voltage
Measurement of phase
Two equal voltages of equal
frequency and phase
displacement are applied to a
CRO, the trace on the screen
is a straight Line.
Two equal voltages of equal
frequency but with 90' phase
displacement are applied to a
CRO, the trace on the screen
is a circle
12
13
When two equal voltages of same frequency and phase shift Φ
2
1
2
1
X
X
Y
Y
Sin 
14
Measurement of Frequency
15
Lissajous pattern with frequency ratio 2 : 1, Lissajous pattern with frequency ratio 1 : 2
16
Multi Input Oscilloscopes
• Two or more number of Inputs can be viewed at a time
• Compare any two or more wave forms
• Dual Beam CRO
• Dual trace CRO
This oscilloscope uses a single electron gun and produces
multiple traces by switching the Y deflection plates from one
input signal to another (this means that the Y channel is time
shared by many signals). The eyes interpret this as a
continuous simultaneous display of the input signals although it
is a sampled display.
17
Dual Beam CRO
• Beam splitter arrangement
• Separate vertical system for two channels
Dual trace oscilloscope -2 Channels
18
Dual trace CRO
19
Dual trace modes (Alternate)
20
Dual trace modes (Chop)
21
22
Sampling Oscilloscope
23
• To Examine very fast signals (10ps/div)
• To View Higher frequency waveform, Particularly more than
50- 500 MHz even upto 10 Ghz
• It collects samples from several successive waveform and
construct the complete waveform from the sampled data.
• Combined waveform is amplified by low band pass filter and
then displayed on the screen
• The frequency of the waveform to be displayed should be
more than the sampling frequency of oscilloscope.
24
• The display may be made up from as many 1000 dots of
luminescence.
• The horizontal deflection of the electron beam is obtained
by a staircase waveform to X deflection plates.
• The vertical deflection for each dot is obtained from
progressively later points in each successive cycle of the
input waveform
• Only for repetitive waveform.(Disadv) cannot be used
for the display of transient waveforms.
• sampling techniques
• Real time sampling
• Equivalent sample method
25
Sampling Method
• Before sampling, a trigger pulse activates an oscillator and linear
voltage
• When the amplitude of two voltages are equal, the stair case move up
one step and a sampling pulse is generated to open the gate for
sample the voltage.
• The resolution of the waveform depends on the dimensions of the
steps of the stair case generator.
26
Sampling Oscilloscope
Storage Oscilloscope
Analog Digital
• Variable persistence
• Bistable Storage oscilloscope
27
28
1. There is a finite amount of time that the storage tube can
preserve a stored waveform. Eventually, the waveform will be lost.
The power to the storage tube must be present as long as the
image is to be stored.
2. The trace of a storage tube is, generally, not as fine as a normal
cathode ray tube. Thus, the stored trace is not as crisp as a
conventional oscilloscope trace.
3. The writing rate of the storage tube is less than a conventional
cathode ray tube, which limits the speed of the storage
oscilloscope.
4. The storage cathode ray tube is considerably more expensive
than a conventional tube and requires additional power supplies.
5. Only one image can be stored. If two traces are to be compared,
they must be superimposed on the same screen and displayed
together.
Disadvantage of Analog storage Oscilloscope
•Conventional analogue cathode ray oscilloscope
•Measured signal converted to digital format and stored in
computer memory within the instrument.
•This stored data can then be reconverted to analogue form at the
frequency necessary to refresh the analogue display on the screen.
•Some digital oscilloscopes compute signal parameters such
as peak values, mean values and R.M.S. values.
• They are also ideally suited to capturing transient signals
when set to single-sweep mode.
DSO
29
DSO
30
output analogue signals to
devices like chart recorders
and output digital signals in a
form that is compatible with
standard interfaces like
IEEE488 and RS232.
Some even have disk drives to
extend their storage ability.
Digital Storage Oscilloscope
31
32
wave analyzer
Wave analyser is an instrument to measure relative
amplitudes of single frequency components in a complex
waveform
Types of wave analyser:
1. Basic Wave analyser
2. Based upon the frequency ranges
(a) Frequency selective wave analyser
(frequency ranges from 20 Hz to 20 kHz)
(b) Heterodyne wave analyser
(frequency ranges from 10 kHz to 18 MHz)
33
Principle
Basically the instrument acts as a frequency-
selective voltmeter which is tuned to the frequency of one
signal component while rejecting all the other signal
components. The amplitude is indicated either by a
suitable voltmeter or a CRO.
Primary Detector: This is a simple LC circuit. It’s adjusted for
resonance at the frequency of the particular harmonic component
to be measured.
(b) Full-wave rectifier: It is an intermediate stage of the basic
wave analyser. It obtains the average value of the input signal.
(c) Indicating Device: The indicating device is a simple dc
voltmeter that is calibrated to read the peak value of the
sinusoidal input voltage.
34
Working:
The LC circuit is tuned to a single frequency of the input signal and rejects all other
frequencies. The full wave rectifier provides the average value of the input. A
number of tuned filters are connected to the indicating device thorough a selector
switch.
35
Frequency Selective Wave Analyser
36
37
Applications of wave analyser
1. Measure relative amplitudes of signal frequency
components in a completer waveform.
2. Measure the signal energy with well defined bandwidth.
3. The wave analysers are applied industrially in the field of
reduction of sound and vibrations generated by rotating
electrical machines and apparatus.
4. Measure the harmonic distortion of an amplifier.
5. Measure the amplitude in the presence of noise and other
interfering signals.
6. Use in harmonic analysis.
38
Harmonic distortion analyser
The distortion caused due to nonlinear behaviour of the critical
elements is called harmonic distortion. Harmonic distortion
measurement is used for testing of amplifiers and networks as
to what they distort the input signal.
• Heterodyne Harmonic Distortion Analyser
• Fundamental-Suppression Harmonic Distortion
Analyser
 
 
1
2
1
22
4
2
3
2
2
2
1
2
...........
)(
E
EEEE
lFundamenta
Harmonics
THD
n



39
• Heterodyne Harmonic Distortion Analyser
40
The input signal is mixed with output of variable frequency oscillator in a
mixer circuit. The balance mixer consists of a balanced modulator and it
eliminates original frequency of the harmonic. After successful mixing,
output of mixer supplies the sum and the difference of each harmonic
beating against the oscillator frequency. Now for each harmonic
component either the sum or difference of frequencies is made equal to
the frequency of the filter by varying the frequency of oscillator. The
quartz crystal type highly selective filters can be used as each harmonic
frequency is converted to a constant frequency. This allows selecting
constant frequency signal related to a particular harmonic and passing it
to the metering circuit.
• Heterodyne Harmonic Distortion Analyser
41
Output of mixer has rms value which is proportional to the rms
value of that harmonic component. So when output of mixer is
supplied to a true rms reading voltmeter through amplifier, the
voltmeter reads the rms value of that harmonic component. This
instrument is also called carrier frequency voltmeters and
selective level voltmeters.
Let us assume, for example a 50 Hz distorted sinusoidal
signal for analysis. The oscillator has a frequency range of 50-60
kHz and the filter has a frequency of 50 kHz.
42
Now harmonic components occure at frequencies of 50, 100,
150, 200 Hz and so on. Now we take one harmonic at a time
and the difference of two frequencies.
i.e., the frequency of an oscillator and that of harmonic equals
filter frequency. Now let us suppose the oscillator frequency is
adjusted to 50.05 kHz. Output of mixer contains the sum and
differences of each harmonic beating against the oscillator
frequency. But only mixer output signal, whose frequency is 50
kHz, which is the result of 50 Hz frequency signal beating with
oscillator frequency of 50.05 kHz, passes through the filter.
43
All other mixer output signals are of frequencies above or
below 50 kHz. So voltmeter reads the rms value of 50 kHz
signal. Since rms value of 50 kHz signal is proportional to the
rms value of 50 Hz harmonic component or fundamental of
input signal, so the voltmeter can be calibrated to read directly
the rms value of the 50 Hz fundamental wave.
44
Fundamental-Suppression Harmonic Distortion
Analyser
45
This instrument is used when the total harmonic distortion rather
than the harmonic distortion of each component. The input is applied
to a network of filters that suppresses or rejects the fundamental
frequency but passes the harmonic frequency components.
1. Input circuit with impedance converter: The impedance
converter offers a low-noise, high-impedance input circuit,
independent of the signal source impedance placed at the input
terminals to the instrument.
2. Rejection amplifier: The rejection amplifier rejects the
fundamental frequency of the input signal and passes the
remaining frequency components on to the metering circuit where
the harmonic distortion is measured.
3. Metering circuit: The meter circuit provides a visual indication
of total harmonic distortion in terms of a percentage of total input
voltage
46
Voltmeter Mode:
With the function switch in the voltmeter position, the instrument operates
as a conventional ac voltmeter, a very convenient feature. In this mode the
input signal is applied to the impedance converter circuit through the 10/1
or 100/1 attenuator, which selects the appropriate meter range. The output
of the impedance converter then bypasses the rejection amplifier and the
signal is impresses directly to the metering circuit. The voltmeter section
can be employed separately for general-purpose voltage and gain
measurements
47
Distortion Mode:
With the function switch in the distortion position, the rejection
amplifier is included in the circuit and distortion is measured. In this
mode the input signal is applied to 1 MW attenuator that provides
50db attenuation in 10db steps, controlled by a front panel switch
marked sensitivity. When the desired attenuation is selected, the
signal is supplied to the impedance converter, which is a low-
distortion, high-input impedance amplifier circuit whose gain is
independent of the source impedance placed at the input terminals.
The overall negative feedback in this amplifier results in unity gain
and low distortion. Signals having high impedance can be measured
accurately and the sensitivity selector can be used in high-impedance
positions without distorting the input signal.
48
For frequencies other than the fundamental, the Wien bridge offers a
varying degrees of phase shift and attenuation, and the resultant is
connected through a post-attenuator to the meter circuit and displayed
on the front panel meter. The attenuator limits the signal level to the
meter amplifier to 1 mV for full-scale deflection on all ranges. The
meter amplifier is a multistage circuit designed for low drift and low
noise, and with flat response characteristics. The meter is connected
in a bridge-type rectifier and reads the average value of the signal
impressed on the circuit. The meter scale is calibrated to the rms
value of a sinusoidal wave.
1. The harmonic distortion generated within the instrument is very
small and can be neglected
2. Only the fundamental frequency component must be suppressed

More Related Content

What's hot

cathode ray oscilloscope &function generator
cathode ray oscilloscope &function generatorcathode ray oscilloscope &function generator
cathode ray oscilloscope &function generatormegha agrawal
 
Cathode Ray Oscilloscope
Cathode Ray OscilloscopeCathode Ray Oscilloscope
Cathode Ray Oscilloscope
rajainayat
 
Cro (emmi) (3)
Cro (emmi) (3)Cro (emmi) (3)
Cro (emmi) (3)Ravi Anand
 
Oscilloscopes and their Calibration-Web
Oscilloscopes and their Calibration-WebOscilloscopes and their Calibration-Web
Oscilloscopes and their Calibration-WebDavid Martson
 
DUAL TRACE OSCILLOSCOPE
DUAL TRACE OSCILLOSCOPEDUAL TRACE OSCILLOSCOPE
DUAL TRACE OSCILLOSCOPE
Abdul Qayoom Mangrio
 
CRO
CROCRO
CRO
vmr1124
 
Cro basics
Cro  basicsCro  basics
Cathode ray oscilloscope and related experiments
Cathode ray oscilloscope and related experimentsCathode ray oscilloscope and related experiments
Cathode ray oscilloscope and related experimentsTrisha Banerjee
 
Cro(nnm)
Cro(nnm)Cro(nnm)
Cro(nnm)
nnmaurya
 
ELECTRICAL AND ELECTRONICS MEASURING INSTRUMETNTS,CRO,CRT,PROBES,OSCILLOSCOPES
ELECTRICAL AND ELECTRONICS MEASURING INSTRUMETNTS,CRO,CRT,PROBES,OSCILLOSCOPESELECTRICAL AND ELECTRONICS MEASURING INSTRUMETNTS,CRO,CRT,PROBES,OSCILLOSCOPES
ELECTRICAL AND ELECTRONICS MEASURING INSTRUMETNTS,CRO,CRT,PROBES,OSCILLOSCOPES
AKSHIT KOHLI
 
Emi cathode ray oscilloscope
Emi cathode ray oscilloscopeEmi cathode ray oscilloscope
Emi cathode ray oscilloscopeyssb91
 
Cathode Ray Oscilloscope CRO & Digital Oscilloscope 'S WORKING
Cathode Ray Oscilloscope CRO & Digital Oscilloscope 'S WORKINGCathode Ray Oscilloscope CRO & Digital Oscilloscope 'S WORKING
Cathode Ray Oscilloscope CRO & Digital Oscilloscope 'S WORKING
Abdul Qayoom Mangrio
 
Oscilloscope
OscilloscopeOscilloscope
Cro (cathod ray oscilloscope)
Cro (cathod ray oscilloscope)Cro (cathod ray oscilloscope)
Cro (cathod ray oscilloscope)
noble group og institute,junagadh
 
Cathode Ray Oscilloscope
Cathode Ray OscilloscopeCathode Ray Oscilloscope
Cathode Ray Oscilloscope
EkambareshToulam
 
(19) electronic instruments 1
(19) electronic instruments 1(19) electronic instruments 1
(19) electronic instruments 1delhiking92
 
Digital storage ocilloscope
Digital storage ocilloscopeDigital storage ocilloscope
Digital storage ocilloscope
kajal8899
 
Presentaion on dual trace oscilloscope
Presentaion on dual trace oscilloscopePresentaion on dual trace oscilloscope
Presentaion on dual trace oscilloscope
Aliya Sahir
 
Understanding Lab Instruments
Understanding Lab InstrumentsUnderstanding Lab Instruments
Understanding Lab Instruments
Dattaraj Vidyasagar
 

What's hot (20)

cathode ray oscilloscope &function generator
cathode ray oscilloscope &function generatorcathode ray oscilloscope &function generator
cathode ray oscilloscope &function generator
 
Cathode Ray Oscilloscope
Cathode Ray OscilloscopeCathode Ray Oscilloscope
Cathode Ray Oscilloscope
 
Cro (emmi) (3)
Cro (emmi) (3)Cro (emmi) (3)
Cro (emmi) (3)
 
Oscilloscopes and their Calibration-Web
Oscilloscopes and their Calibration-WebOscilloscopes and their Calibration-Web
Oscilloscopes and their Calibration-Web
 
DUAL TRACE OSCILLOSCOPE
DUAL TRACE OSCILLOSCOPEDUAL TRACE OSCILLOSCOPE
DUAL TRACE OSCILLOSCOPE
 
Oscilloscope
OscilloscopeOscilloscope
Oscilloscope
 
CRO
CROCRO
CRO
 
Cro basics
Cro  basicsCro  basics
Cro basics
 
Cathode ray oscilloscope and related experiments
Cathode ray oscilloscope and related experimentsCathode ray oscilloscope and related experiments
Cathode ray oscilloscope and related experiments
 
Cro(nnm)
Cro(nnm)Cro(nnm)
Cro(nnm)
 
ELECTRICAL AND ELECTRONICS MEASURING INSTRUMETNTS,CRO,CRT,PROBES,OSCILLOSCOPES
ELECTRICAL AND ELECTRONICS MEASURING INSTRUMETNTS,CRO,CRT,PROBES,OSCILLOSCOPESELECTRICAL AND ELECTRONICS MEASURING INSTRUMETNTS,CRO,CRT,PROBES,OSCILLOSCOPES
ELECTRICAL AND ELECTRONICS MEASURING INSTRUMETNTS,CRO,CRT,PROBES,OSCILLOSCOPES
 
Emi cathode ray oscilloscope
Emi cathode ray oscilloscopeEmi cathode ray oscilloscope
Emi cathode ray oscilloscope
 
Cathode Ray Oscilloscope CRO & Digital Oscilloscope 'S WORKING
Cathode Ray Oscilloscope CRO & Digital Oscilloscope 'S WORKINGCathode Ray Oscilloscope CRO & Digital Oscilloscope 'S WORKING
Cathode Ray Oscilloscope CRO & Digital Oscilloscope 'S WORKING
 
Oscilloscope
OscilloscopeOscilloscope
Oscilloscope
 
Cro (cathod ray oscilloscope)
Cro (cathod ray oscilloscope)Cro (cathod ray oscilloscope)
Cro (cathod ray oscilloscope)
 
Cathode Ray Oscilloscope
Cathode Ray OscilloscopeCathode Ray Oscilloscope
Cathode Ray Oscilloscope
 
(19) electronic instruments 1
(19) electronic instruments 1(19) electronic instruments 1
(19) electronic instruments 1
 
Digital storage ocilloscope
Digital storage ocilloscopeDigital storage ocilloscope
Digital storage ocilloscope
 
Presentaion on dual trace oscilloscope
Presentaion on dual trace oscilloscopePresentaion on dual trace oscilloscope
Presentaion on dual trace oscilloscope
 
Understanding Lab Instruments
Understanding Lab InstrumentsUnderstanding Lab Instruments
Understanding Lab Instruments
 

Similar to Ei unit 2

Ultrasonic Range Finder
Ultrasonic Range FinderUltrasonic Range Finder
Ultrasonic Range Finder
Hicham Berkouk
 
STSN1132 Radiation Detection #3.pptx
STSN1132 Radiation Detection #3.pptxSTSN1132 Radiation Detection #3.pptx
STSN1132 Radiation Detection #3.pptx
NurmaizatulAtikah
 
Color flow medical cardiac ultrasound
Color flow medical cardiac ultrasoundColor flow medical cardiac ultrasound
Color flow medical cardiac ultrasound
Larry Miller PhD
 
Ultrasound imaging system
Ultrasound imaging system Ultrasound imaging system
Ultrasound imaging system
Riadh Al-Haidari
 
Laser Doppler Anemometry Dantec 199.PPT
Laser Doppler Anemometry Dantec  199.PPTLaser Doppler Anemometry Dantec  199.PPT
Laser Doppler Anemometry Dantec 199.PPT
abhrabhattacharyyabm
 
Coffee can radar
Coffee can radarCoffee can radar
Coffee can radar
youssef ramzy
 
UV-VIS SPECTRO final.ppt
UV-VIS SPECTRO final.pptUV-VIS SPECTRO final.ppt
UV-VIS SPECTRO final.ppt
Jgdishrathi
 
Instrumentation: Liquid and Gas Sensing - VE2013
Instrumentation: Liquid and Gas Sensing - VE2013Instrumentation: Liquid and Gas Sensing - VE2013
Instrumentation: Liquid and Gas Sensing - VE2013
Analog Devices, Inc.
 
Spectrum analyzer
Spectrum analyzerSpectrum analyzer
Spectrum analyzer
Mohammed AbouHaggar
 
53_36765_ME591_2012_1__1_1_SENSORS.pdf
53_36765_ME591_2012_1__1_1_SENSORS.pdf53_36765_ME591_2012_1__1_1_SENSORS.pdf
53_36765_ME591_2012_1__1_1_SENSORS.pdf
DrPArivalaganASSTPRO
 
Electronic instrumentation in NMT
Electronic instrumentation in NMTElectronic instrumentation in NMT
Electronic instrumentation in NMT
SUMAN GOWNDER
 
Spectrum analyzer
Spectrum analyzerSpectrum analyzer
Spectrum analyzer
Tahrimur Rahman
 
Gaurav seminar
Gaurav seminarGaurav seminar
Gaurav seminar
Akshay Malik
 
Lab LCA 1 7
Lab LCA 1 7Lab LCA 1 7
Lab LCA 1 7
NUST Stuff
 
Design of Microcontroller Based Multi-Frequency Ultrasonic Pulser Receiver
Design of Microcontroller Based Multi-Frequency Ultrasonic Pulser ReceiverDesign of Microcontroller Based Multi-Frequency Ultrasonic Pulser Receiver
Design of Microcontroller Based Multi-Frequency Ultrasonic Pulser Receiver
IJERA Editor
 
A_Tutorial_on_Radar_System_Engineering.pptx
A_Tutorial_on_Radar_System_Engineering.pptxA_Tutorial_on_Radar_System_Engineering.pptx
A_Tutorial_on_Radar_System_Engineering.pptx
LusiaRakhmawati1
 
A Tutorial on Radar System Engineering
A Tutorial on Radar System EngineeringA Tutorial on Radar System Engineering
A Tutorial on Radar System Engineering
TBSS Group
 

Similar to Ei unit 2 (20)

Ultrasonic Range Finder
Ultrasonic Range FinderUltrasonic Range Finder
Ultrasonic Range Finder
 
STSN1132 Radiation Detection #3.pptx
STSN1132 Radiation Detection #3.pptxSTSN1132 Radiation Detection #3.pptx
STSN1132 Radiation Detection #3.pptx
 
Color flow medical cardiac ultrasound
Color flow medical cardiac ultrasoundColor flow medical cardiac ultrasound
Color flow medical cardiac ultrasound
 
Ultrasound imaging system
Ultrasound imaging system Ultrasound imaging system
Ultrasound imaging system
 
Laser Doppler Anemometry Dantec 199.PPT
Laser Doppler Anemometry Dantec  199.PPTLaser Doppler Anemometry Dantec  199.PPT
Laser Doppler Anemometry Dantec 199.PPT
 
Coffee can radar
Coffee can radarCoffee can radar
Coffee can radar
 
UV-VIS SPECTRO final.ppt
UV-VIS SPECTRO final.pptUV-VIS SPECTRO final.ppt
UV-VIS SPECTRO final.ppt
 
Instrumentation: Liquid and Gas Sensing - VE2013
Instrumentation: Liquid and Gas Sensing - VE2013Instrumentation: Liquid and Gas Sensing - VE2013
Instrumentation: Liquid and Gas Sensing - VE2013
 
Basics of amplifier
Basics of amplifierBasics of amplifier
Basics of amplifier
 
Spectrum analyzer
Spectrum analyzerSpectrum analyzer
Spectrum analyzer
 
53_36765_ME591_2012_1__1_1_SENSORS.pdf
53_36765_ME591_2012_1__1_1_SENSORS.pdf53_36765_ME591_2012_1__1_1_SENSORS.pdf
53_36765_ME591_2012_1__1_1_SENSORS.pdf
 
Electronic instrumentation in NMT
Electronic instrumentation in NMTElectronic instrumentation in NMT
Electronic instrumentation in NMT
 
Spectrum analyzer
Spectrum analyzerSpectrum analyzer
Spectrum analyzer
 
Gaurav seminar
Gaurav seminarGaurav seminar
Gaurav seminar
 
Lab LCA 1 7
Lab LCA 1 7Lab LCA 1 7
Lab LCA 1 7
 
Ir
IrIr
Ir
 
Design of Microcontroller Based Multi-Frequency Ultrasonic Pulser Receiver
Design of Microcontroller Based Multi-Frequency Ultrasonic Pulser ReceiverDesign of Microcontroller Based Multi-Frequency Ultrasonic Pulser Receiver
Design of Microcontroller Based Multi-Frequency Ultrasonic Pulser Receiver
 
A_Tutorial_on_Radar_System_Engineering.pptx
A_Tutorial_on_Radar_System_Engineering.pptxA_Tutorial_on_Radar_System_Engineering.pptx
A_Tutorial_on_Radar_System_Engineering.pptx
 
A Tutorial on Radar System Engineering
A Tutorial on Radar System EngineeringA Tutorial on Radar System Engineering
A Tutorial on Radar System Engineering
 
Sub157
Sub157Sub157
Sub157
 

Recently uploaded

Quality defects in TMT Bars, Possible causes and Potential Solutions.
Quality defects in TMT Bars, Possible causes and Potential Solutions.Quality defects in TMT Bars, Possible causes and Potential Solutions.
Quality defects in TMT Bars, Possible causes and Potential Solutions.
PrashantGoswami42
 
一比一原版(SFU毕业证)西蒙菲莎大学毕业证成绩单如何办理
一比一原版(SFU毕业证)西蒙菲莎大学毕业证成绩单如何办理一比一原版(SFU毕业证)西蒙菲莎大学毕业证成绩单如何办理
一比一原版(SFU毕业证)西蒙菲莎大学毕业证成绩单如何办理
bakpo1
 
Halogenation process of chemical process industries
Halogenation process of chemical process industriesHalogenation process of chemical process industries
Halogenation process of chemical process industries
MuhammadTufail242431
 
Final project report on grocery store management system..pdf
Final project report on grocery store management system..pdfFinal project report on grocery store management system..pdf
Final project report on grocery store management system..pdf
Kamal Acharya
 
The role of big data in decision making.
The role of big data in decision making.The role of big data in decision making.
The role of big data in decision making.
ankuprajapati0525
 
ethical hacking-mobile hacking methods.ppt
ethical hacking-mobile hacking methods.pptethical hacking-mobile hacking methods.ppt
ethical hacking-mobile hacking methods.ppt
Jayaprasanna4
 
Architectural Portfolio Sean Lockwood
Architectural Portfolio Sean LockwoodArchitectural Portfolio Sean Lockwood
Architectural Portfolio Sean Lockwood
seandesed
 
Student information management system project report ii.pdf
Student information management system project report ii.pdfStudent information management system project report ii.pdf
Student information management system project report ii.pdf
Kamal Acharya
 
Automobile Management System Project Report.pdf
Automobile Management System Project Report.pdfAutomobile Management System Project Report.pdf
Automobile Management System Project Report.pdf
Kamal Acharya
 
H.Seo, ICLR 2024, MLILAB, KAIST AI.pdf
H.Seo,  ICLR 2024, MLILAB,  KAIST AI.pdfH.Seo,  ICLR 2024, MLILAB,  KAIST AI.pdf
H.Seo, ICLR 2024, MLILAB, KAIST AI.pdf
MLILAB
 
Planning Of Procurement o different goods and services
Planning Of Procurement o different goods and servicesPlanning Of Procurement o different goods and services
Planning Of Procurement o different goods and services
JoytuBarua2
 
Nuclear Power Economics and Structuring 2024
Nuclear Power Economics and Structuring 2024Nuclear Power Economics and Structuring 2024
Nuclear Power Economics and Structuring 2024
Massimo Talia
 
MCQ Soil mechanics questions (Soil shear strength).pdf
MCQ Soil mechanics questions (Soil shear strength).pdfMCQ Soil mechanics questions (Soil shear strength).pdf
MCQ Soil mechanics questions (Soil shear strength).pdf
Osamah Alsalih
 
Courier management system project report.pdf
Courier management system project report.pdfCourier management system project report.pdf
Courier management system project report.pdf
Kamal Acharya
 
Democratizing Fuzzing at Scale by Abhishek Arya
Democratizing Fuzzing at Scale by Abhishek AryaDemocratizing Fuzzing at Scale by Abhishek Arya
Democratizing Fuzzing at Scale by Abhishek Arya
abh.arya
 
Design and Analysis of Algorithms-DP,Backtracking,Graphs,B&B
Design and Analysis of Algorithms-DP,Backtracking,Graphs,B&BDesign and Analysis of Algorithms-DP,Backtracking,Graphs,B&B
Design and Analysis of Algorithms-DP,Backtracking,Graphs,B&B
Sreedhar Chowdam
 
在线办理(ANU毕业证书)澳洲国立大学毕业证录取通知书一模一样
在线办理(ANU毕业证书)澳洲国立大学毕业证录取通知书一模一样在线办理(ANU毕业证书)澳洲国立大学毕业证录取通知书一模一样
在线办理(ANU毕业证书)澳洲国立大学毕业证录取通知书一模一样
obonagu
 
Pile Foundation by Venkatesh Taduvai (Sub Geotechnical Engineering II)-conver...
Pile Foundation by Venkatesh Taduvai (Sub Geotechnical Engineering II)-conver...Pile Foundation by Venkatesh Taduvai (Sub Geotechnical Engineering II)-conver...
Pile Foundation by Venkatesh Taduvai (Sub Geotechnical Engineering II)-conver...
AJAYKUMARPUND1
 
COLLEGE BUS MANAGEMENT SYSTEM PROJECT REPORT.pdf
COLLEGE BUS MANAGEMENT SYSTEM PROJECT REPORT.pdfCOLLEGE BUS MANAGEMENT SYSTEM PROJECT REPORT.pdf
COLLEGE BUS MANAGEMENT SYSTEM PROJECT REPORT.pdf
Kamal Acharya
 
Gen AI Study Jams _ For the GDSC Leads in India.pdf
Gen AI Study Jams _ For the GDSC Leads in India.pdfGen AI Study Jams _ For the GDSC Leads in India.pdf
Gen AI Study Jams _ For the GDSC Leads in India.pdf
gdsczhcet
 

Recently uploaded (20)

Quality defects in TMT Bars, Possible causes and Potential Solutions.
Quality defects in TMT Bars, Possible causes and Potential Solutions.Quality defects in TMT Bars, Possible causes and Potential Solutions.
Quality defects in TMT Bars, Possible causes and Potential Solutions.
 
一比一原版(SFU毕业证)西蒙菲莎大学毕业证成绩单如何办理
一比一原版(SFU毕业证)西蒙菲莎大学毕业证成绩单如何办理一比一原版(SFU毕业证)西蒙菲莎大学毕业证成绩单如何办理
一比一原版(SFU毕业证)西蒙菲莎大学毕业证成绩单如何办理
 
Halogenation process of chemical process industries
Halogenation process of chemical process industriesHalogenation process of chemical process industries
Halogenation process of chemical process industries
 
Final project report on grocery store management system..pdf
Final project report on grocery store management system..pdfFinal project report on grocery store management system..pdf
Final project report on grocery store management system..pdf
 
The role of big data in decision making.
The role of big data in decision making.The role of big data in decision making.
The role of big data in decision making.
 
ethical hacking-mobile hacking methods.ppt
ethical hacking-mobile hacking methods.pptethical hacking-mobile hacking methods.ppt
ethical hacking-mobile hacking methods.ppt
 
Architectural Portfolio Sean Lockwood
Architectural Portfolio Sean LockwoodArchitectural Portfolio Sean Lockwood
Architectural Portfolio Sean Lockwood
 
Student information management system project report ii.pdf
Student information management system project report ii.pdfStudent information management system project report ii.pdf
Student information management system project report ii.pdf
 
Automobile Management System Project Report.pdf
Automobile Management System Project Report.pdfAutomobile Management System Project Report.pdf
Automobile Management System Project Report.pdf
 
H.Seo, ICLR 2024, MLILAB, KAIST AI.pdf
H.Seo,  ICLR 2024, MLILAB,  KAIST AI.pdfH.Seo,  ICLR 2024, MLILAB,  KAIST AI.pdf
H.Seo, ICLR 2024, MLILAB, KAIST AI.pdf
 
Planning Of Procurement o different goods and services
Planning Of Procurement o different goods and servicesPlanning Of Procurement o different goods and services
Planning Of Procurement o different goods and services
 
Nuclear Power Economics and Structuring 2024
Nuclear Power Economics and Structuring 2024Nuclear Power Economics and Structuring 2024
Nuclear Power Economics and Structuring 2024
 
MCQ Soil mechanics questions (Soil shear strength).pdf
MCQ Soil mechanics questions (Soil shear strength).pdfMCQ Soil mechanics questions (Soil shear strength).pdf
MCQ Soil mechanics questions (Soil shear strength).pdf
 
Courier management system project report.pdf
Courier management system project report.pdfCourier management system project report.pdf
Courier management system project report.pdf
 
Democratizing Fuzzing at Scale by Abhishek Arya
Democratizing Fuzzing at Scale by Abhishek AryaDemocratizing Fuzzing at Scale by Abhishek Arya
Democratizing Fuzzing at Scale by Abhishek Arya
 
Design and Analysis of Algorithms-DP,Backtracking,Graphs,B&B
Design and Analysis of Algorithms-DP,Backtracking,Graphs,B&BDesign and Analysis of Algorithms-DP,Backtracking,Graphs,B&B
Design and Analysis of Algorithms-DP,Backtracking,Graphs,B&B
 
在线办理(ANU毕业证书)澳洲国立大学毕业证录取通知书一模一样
在线办理(ANU毕业证书)澳洲国立大学毕业证录取通知书一模一样在线办理(ANU毕业证书)澳洲国立大学毕业证录取通知书一模一样
在线办理(ANU毕业证书)澳洲国立大学毕业证录取通知书一模一样
 
Pile Foundation by Venkatesh Taduvai (Sub Geotechnical Engineering II)-conver...
Pile Foundation by Venkatesh Taduvai (Sub Geotechnical Engineering II)-conver...Pile Foundation by Venkatesh Taduvai (Sub Geotechnical Engineering II)-conver...
Pile Foundation by Venkatesh Taduvai (Sub Geotechnical Engineering II)-conver...
 
COLLEGE BUS MANAGEMENT SYSTEM PROJECT REPORT.pdf
COLLEGE BUS MANAGEMENT SYSTEM PROJECT REPORT.pdfCOLLEGE BUS MANAGEMENT SYSTEM PROJECT REPORT.pdf
COLLEGE BUS MANAGEMENT SYSTEM PROJECT REPORT.pdf
 
Gen AI Study Jams _ For the GDSC Leads in India.pdf
Gen AI Study Jams _ For the GDSC Leads in India.pdfGen AI Study Jams _ For the GDSC Leads in India.pdf
Gen AI Study Jams _ For the GDSC Leads in India.pdf
 

Ei unit 2

  • 1. Unit-2 CATHODE RAY OSCILLOSCOPE & SIGNAL ANALYZERS EI8692 Electronic Instrumentation Dr. T. Babu Prof & Head Department of ICE St. Joseph’s College of Engineering
  • 2. Unit II Syllabus • General purpose cathode ray oscilloscope • Dual trace, dual beam • sampling oscilloscopes • Analog and digital storage oscilloscope • wave analyser – frequency selective and heterodyne • Harmonic distortion analyser • Spectrum analyzer. 2
  • 3. Books • TEXT BOOKS: • A.D. Helfrick and W.D. Cooper, Modern Electronic Instrumentation and Measurement Techniques, Prentice Hall India Private Ltd., New Delhi, 2010. • David A Bell, “ Electronic Instrumentation and Measurements”, Ox for University Press, 2013. • Jerome J., Virtual Instrumentation using Lab VIEW, Prentice Hall India Private Ltd., New Delhi,2010 . REFERENCES: • H.S. Kalsi, Electronic Instrumentation, Tata McGraw-Hill, New Delhi, 2010. • J.J. Carr, Elements of Electronic Instrumentation and Measurement, Pearson Education India, New Delhi, 2011. • M.M.S. Anand, Electronics Instruments and Instrumentation Technology, Prentice Hall India, New Delhi, 2009. • Sanjay Gupta, Virtual Instrumentation using Lab view, Tata McGraw-Hill Education, 2010. 3
  • 4. Cathode Ray Oscilloscope (CRO) • Used to – Display and analyze the waveforms – Measurement (Voltage, phase angle, frequency) – Display the waveform with respect to time – Compare two waveforms (Dual Oscilloscope) 4
  • 5. Types  Dual beam- Dual Trace CRO • Sampling oscilloscope • Storage oscilloscope Analog Digital 5
  • 6. 6 Block diagram of CRO 1. CRT 2. Vertical amplifier 3. Delay line 4. Time base generator 5. Horizontal amplifier 6. Trigger circuit 7. Power supply Parts of CRO
  • 8. 8 A cathode ray tube (CRT) contains four basic parts: • Electron gun – (Produces sharply focussed electron beam) Cathode Accelerating anode Focusing Anode • Deflecting systems Vertical Horizontal • evacuated glass envelope with a phosphorescent screen that glows visibly when struck by the electron beam.
  • 9. 9 Deflection Plates: Vertical Horizontal Time base Generators (sawtooth wave ) - Horizontal CRO is used to display the signals with respect to time, hence it requires a horizontal constant velocity beam. A deflecting voltage linearly increase and rapidly decrease called Sawtooth. (Sweep)
  • 10. 10 Vertical Deflection plates it’s the principal factor of sensitivity and bandwidth • V/div • Bandwidth (range of frequencies that can be accurately reproduced on the CRT screen). Screen Inner side of CRT screen – Phosphor (P31)- green Phosphor material decides the colour of the beam CRT graticule – grid of lines on the scale when making measurements of time and amplitude of any signal. Aquadag: A layer pasted inside the CRT, to collect the secondary emitted electrons.
  • 11. 11 Applications of CRO • Measurement of Voltage and current • Measurement of phase and frequency (Lissajous Pattern) When sinusoidal voltages applied to both vertical and horizontal plate simultaneously .Measurement of Voltage
  • 12. Measurement of phase Two equal voltages of equal frequency and phase displacement are applied to a CRO, the trace on the screen is a straight Line. Two equal voltages of equal frequency but with 90' phase displacement are applied to a CRO, the trace on the screen is a circle 12
  • 13. 13 When two equal voltages of same frequency and phase shift Φ 2 1 2 1 X X Y Y Sin 
  • 14. 14
  • 15. Measurement of Frequency 15 Lissajous pattern with frequency ratio 2 : 1, Lissajous pattern with frequency ratio 1 : 2
  • 16. 16 Multi Input Oscilloscopes • Two or more number of Inputs can be viewed at a time • Compare any two or more wave forms • Dual Beam CRO • Dual trace CRO This oscilloscope uses a single electron gun and produces multiple traces by switching the Y deflection plates from one input signal to another (this means that the Y channel is time shared by many signals). The eyes interpret this as a continuous simultaneous display of the input signals although it is a sampled display.
  • 17. 17 Dual Beam CRO • Beam splitter arrangement • Separate vertical system for two channels
  • 18. Dual trace oscilloscope -2 Channels 18
  • 20. Dual trace modes (Alternate) 20
  • 21. Dual trace modes (Chop) 21
  • 22. 22
  • 23. Sampling Oscilloscope 23 • To Examine very fast signals (10ps/div) • To View Higher frequency waveform, Particularly more than 50- 500 MHz even upto 10 Ghz • It collects samples from several successive waveform and construct the complete waveform from the sampled data. • Combined waveform is amplified by low band pass filter and then displayed on the screen • The frequency of the waveform to be displayed should be more than the sampling frequency of oscilloscope.
  • 24. 24 • The display may be made up from as many 1000 dots of luminescence. • The horizontal deflection of the electron beam is obtained by a staircase waveform to X deflection plates. • The vertical deflection for each dot is obtained from progressively later points in each successive cycle of the input waveform • Only for repetitive waveform.(Disadv) cannot be used for the display of transient waveforms. • sampling techniques • Real time sampling • Equivalent sample method
  • 25. 25 Sampling Method • Before sampling, a trigger pulse activates an oscillator and linear voltage • When the amplitude of two voltages are equal, the stair case move up one step and a sampling pulse is generated to open the gate for sample the voltage. • The resolution of the waveform depends on the dimensions of the steps of the stair case generator.
  • 27. Storage Oscilloscope Analog Digital • Variable persistence • Bistable Storage oscilloscope 27
  • 28. 28 1. There is a finite amount of time that the storage tube can preserve a stored waveform. Eventually, the waveform will be lost. The power to the storage tube must be present as long as the image is to be stored. 2. The trace of a storage tube is, generally, not as fine as a normal cathode ray tube. Thus, the stored trace is not as crisp as a conventional oscilloscope trace. 3. The writing rate of the storage tube is less than a conventional cathode ray tube, which limits the speed of the storage oscilloscope. 4. The storage cathode ray tube is considerably more expensive than a conventional tube and requires additional power supplies. 5. Only one image can be stored. If two traces are to be compared, they must be superimposed on the same screen and displayed together. Disadvantage of Analog storage Oscilloscope
  • 29. •Conventional analogue cathode ray oscilloscope •Measured signal converted to digital format and stored in computer memory within the instrument. •This stored data can then be reconverted to analogue form at the frequency necessary to refresh the analogue display on the screen. •Some digital oscilloscopes compute signal parameters such as peak values, mean values and R.M.S. values. • They are also ideally suited to capturing transient signals when set to single-sweep mode. DSO 29
  • 30. DSO 30 output analogue signals to devices like chart recorders and output digital signals in a form that is compatible with standard interfaces like IEEE488 and RS232. Some even have disk drives to extend their storage ability.
  • 32. 32 wave analyzer Wave analyser is an instrument to measure relative amplitudes of single frequency components in a complex waveform Types of wave analyser: 1. Basic Wave analyser 2. Based upon the frequency ranges (a) Frequency selective wave analyser (frequency ranges from 20 Hz to 20 kHz) (b) Heterodyne wave analyser (frequency ranges from 10 kHz to 18 MHz)
  • 33. 33 Principle Basically the instrument acts as a frequency- selective voltmeter which is tuned to the frequency of one signal component while rejecting all the other signal components. The amplitude is indicated either by a suitable voltmeter or a CRO. Primary Detector: This is a simple LC circuit. It’s adjusted for resonance at the frequency of the particular harmonic component to be measured. (b) Full-wave rectifier: It is an intermediate stage of the basic wave analyser. It obtains the average value of the input signal. (c) Indicating Device: The indicating device is a simple dc voltmeter that is calibrated to read the peak value of the sinusoidal input voltage.
  • 34. 34 Working: The LC circuit is tuned to a single frequency of the input signal and rejects all other frequencies. The full wave rectifier provides the average value of the input. A number of tuned filters are connected to the indicating device thorough a selector switch.
  • 36. 36
  • 37. 37 Applications of wave analyser 1. Measure relative amplitudes of signal frequency components in a completer waveform. 2. Measure the signal energy with well defined bandwidth. 3. The wave analysers are applied industrially in the field of reduction of sound and vibrations generated by rotating electrical machines and apparatus. 4. Measure the harmonic distortion of an amplifier. 5. Measure the amplitude in the presence of noise and other interfering signals. 6. Use in harmonic analysis.
  • 38. 38 Harmonic distortion analyser The distortion caused due to nonlinear behaviour of the critical elements is called harmonic distortion. Harmonic distortion measurement is used for testing of amplifiers and networks as to what they distort the input signal. • Heterodyne Harmonic Distortion Analyser • Fundamental-Suppression Harmonic Distortion Analyser     1 2 1 22 4 2 3 2 2 2 1 2 ........... )( E EEEE lFundamenta Harmonics THD n   
  • 39. 39 • Heterodyne Harmonic Distortion Analyser
  • 40. 40 The input signal is mixed with output of variable frequency oscillator in a mixer circuit. The balance mixer consists of a balanced modulator and it eliminates original frequency of the harmonic. After successful mixing, output of mixer supplies the sum and the difference of each harmonic beating against the oscillator frequency. Now for each harmonic component either the sum or difference of frequencies is made equal to the frequency of the filter by varying the frequency of oscillator. The quartz crystal type highly selective filters can be used as each harmonic frequency is converted to a constant frequency. This allows selecting constant frequency signal related to a particular harmonic and passing it to the metering circuit. • Heterodyne Harmonic Distortion Analyser
  • 41. 41 Output of mixer has rms value which is proportional to the rms value of that harmonic component. So when output of mixer is supplied to a true rms reading voltmeter through amplifier, the voltmeter reads the rms value of that harmonic component. This instrument is also called carrier frequency voltmeters and selective level voltmeters. Let us assume, for example a 50 Hz distorted sinusoidal signal for analysis. The oscillator has a frequency range of 50-60 kHz and the filter has a frequency of 50 kHz.
  • 42. 42 Now harmonic components occure at frequencies of 50, 100, 150, 200 Hz and so on. Now we take one harmonic at a time and the difference of two frequencies. i.e., the frequency of an oscillator and that of harmonic equals filter frequency. Now let us suppose the oscillator frequency is adjusted to 50.05 kHz. Output of mixer contains the sum and differences of each harmonic beating against the oscillator frequency. But only mixer output signal, whose frequency is 50 kHz, which is the result of 50 Hz frequency signal beating with oscillator frequency of 50.05 kHz, passes through the filter.
  • 43. 43 All other mixer output signals are of frequencies above or below 50 kHz. So voltmeter reads the rms value of 50 kHz signal. Since rms value of 50 kHz signal is proportional to the rms value of 50 Hz harmonic component or fundamental of input signal, so the voltmeter can be calibrated to read directly the rms value of the 50 Hz fundamental wave.
  • 45. 45 This instrument is used when the total harmonic distortion rather than the harmonic distortion of each component. The input is applied to a network of filters that suppresses or rejects the fundamental frequency but passes the harmonic frequency components. 1. Input circuit with impedance converter: The impedance converter offers a low-noise, high-impedance input circuit, independent of the signal source impedance placed at the input terminals to the instrument. 2. Rejection amplifier: The rejection amplifier rejects the fundamental frequency of the input signal and passes the remaining frequency components on to the metering circuit where the harmonic distortion is measured. 3. Metering circuit: The meter circuit provides a visual indication of total harmonic distortion in terms of a percentage of total input voltage
  • 46. 46 Voltmeter Mode: With the function switch in the voltmeter position, the instrument operates as a conventional ac voltmeter, a very convenient feature. In this mode the input signal is applied to the impedance converter circuit through the 10/1 or 100/1 attenuator, which selects the appropriate meter range. The output of the impedance converter then bypasses the rejection amplifier and the signal is impresses directly to the metering circuit. The voltmeter section can be employed separately for general-purpose voltage and gain measurements
  • 47. 47 Distortion Mode: With the function switch in the distortion position, the rejection amplifier is included in the circuit and distortion is measured. In this mode the input signal is applied to 1 MW attenuator that provides 50db attenuation in 10db steps, controlled by a front panel switch marked sensitivity. When the desired attenuation is selected, the signal is supplied to the impedance converter, which is a low- distortion, high-input impedance amplifier circuit whose gain is independent of the source impedance placed at the input terminals. The overall negative feedback in this amplifier results in unity gain and low distortion. Signals having high impedance can be measured accurately and the sensitivity selector can be used in high-impedance positions without distorting the input signal.
  • 48. 48 For frequencies other than the fundamental, the Wien bridge offers a varying degrees of phase shift and attenuation, and the resultant is connected through a post-attenuator to the meter circuit and displayed on the front panel meter. The attenuator limits the signal level to the meter amplifier to 1 mV for full-scale deflection on all ranges. The meter amplifier is a multistage circuit designed for low drift and low noise, and with flat response characteristics. The meter is connected in a bridge-type rectifier and reads the average value of the signal impressed on the circuit. The meter scale is calibrated to the rms value of a sinusoidal wave. 1. The harmonic distortion generated within the instrument is very small and can be neglected 2. Only the fundamental frequency component must be suppressed