Downloaded 1,176 times

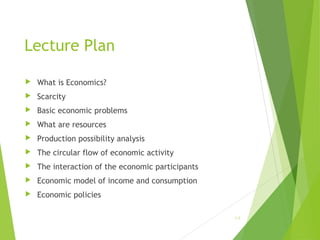
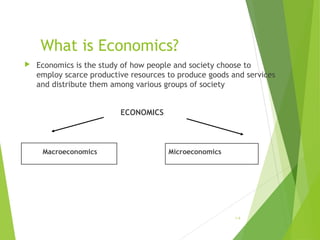


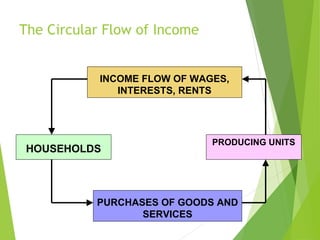

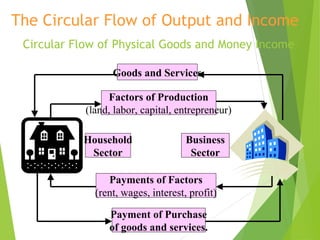

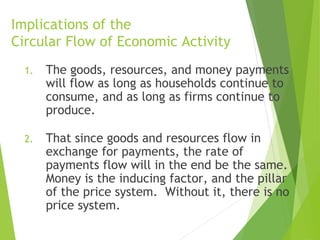


This document provides an overview of key economic concepts for grade 11 learners. It begins with definitions of economics and microeconomics and macroeconomics. It then covers concepts like scarcity, resources, opportunity costs, and production possibility frontiers. It introduces the circular flow of economic activity and models of income and consumption. It discusses the basic economic problems of what, how, and for whom to produce. Overall, the document provides a comprehensive introduction to foundational economic ideas.